| Param | Original file | Final file |
|---|---|---|
| Filename | modeM0/AS1A12_054T02_9000005444_39173cztM0_level2.fits | modeM0/AS1A12_054T02_9000005444_39173cztM0_level2_quad_clean.evt |
| Size (bytes) | 469,221,120 | 87,920,640 |
| Size | 447.5 MB | 83.8 MB |
| Events in quadrant A | 2,860,596 | 650,926 |
| Events in quadrant B | 2,415,952 | 651,485 |
| Events in quadrant C | 2,765,383 | 602,103 |
| Events in quadrant D | 8,927,404 | 397,200 |
| Mode M9 | |||
|---|---|---|---|
| Quadrant | BADHDUFLAG | Total packets | Discarded packets |
| A | 0 | 31 | 0 |
| B | 0 | 31 | 0 |
| C | 0 | 31 | 0 |
| D | 0 | 32 | 0 |
| Mode M0 | |||
|---|---|---|---|
| Quadrant | BADHDUFLAG | Total packets | Discarded packets |
| A | 0 | 11657 | 3 |
| B | 0 | 10500 | 2 |
| C | 0 | 11301 | 2 |
| D | 0 | 30069 | 2 |
| Mode SS | |||
|---|---|---|---|
| Quadrant | BADHDUFLAG | Total packets | Discarded packets |
| A | 0 | 106 | 0 |
| B | 0 | 106 | 0 |
| C | 0 | 106 | 0 |
| D | 0 | 106 | 0 |
| Quadrant | Total seconds | Saturated seconds | Saturation percentage |
|---|---|---|---|
| A | 5140 | 19 | 0.369650% |
| B | 5140 | 12 | 0.233463% |
| C | 5140 | 42 | 0.817121% |
| D | 5140 | 2004 | 38.988327% |
Noise dominated data is calculated using 1-second bins in cleaned event files. If a bin has >2000 counts, and if more than 50% of those come from <1% of pixels, then it is considered to be noise-dominated and hence unusable.
| Quadrant | # 1 sec bins | Bins with >0 counts | Bins with >2000 counts | High rate bins dominated by noise | Noise dominated (total time) | Noise dominated (detector-on time) | Marked lightcurve |
|---|---|---|---|---|---|---|---|
| A | 7262 | 5141 | 8 | 8 | 0.11% | 0.16% | 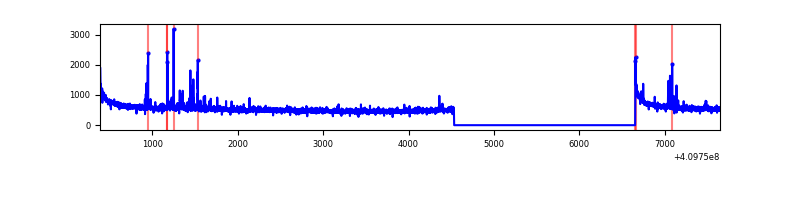 |
| B | 7262 | 5141 | 1 | 1 | 0.01% | 0.02% | 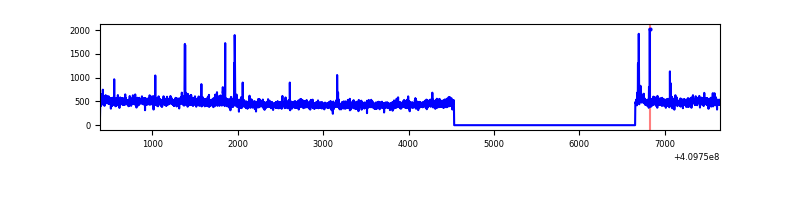 |
| C | 7262 | 5141 | 32 | 32 | 0.44% | 0.62% | 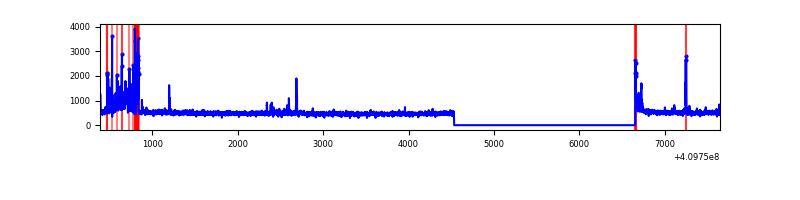 |
| D | 7262 | 5141 | 1889 | 1889 | 26.01% | 36.74% | 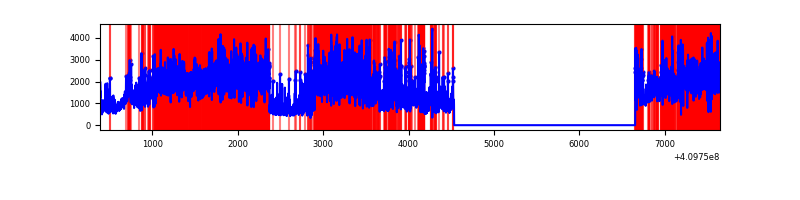 |
Top three noisy pixels from each quadrant. If the there are fewer than three noisy pixels in the level2.evt file, extra rows are filled as -1
| Pixel properties | Quadrant properties | ||||||
|---|---|---|---|---|---|---|---|
| Quadrant | DetID | PixID | Counts | Sigma | Mean | Median | Sigma |
| A | 10 | 83 | 436094 | 3538.2 | 600 | 590 | 123.1 |
| A | 13 | 248 | 50677 | 406.93 | 600 | 590 | 123.1 |
| A | 2 | 79 | 34461 | 275.18 | 600 | 590 | 123.1 |
| B | 5 | 172 | 47009 | 409.3 | 591 | 577 | 113.4 |
| B | 0 | 213 | 42259 | 367.43 | 591 | 577 | 113.4 |
| B | 12 | 111 | 13403 | 113.06 | 591 | 577 | 113.4 |
| C | 9 | 187 | 283729 | 2123.56 | 577 | 580 | 133.3 |
| C | 15 | 214 | 216281 | 1617.71 | 577 | 580 | 133.3 |
| C | 0 | 10 | 8607 | 60.2 | 577 | 580 | 133.3 |
| D | 12 | 235 | 5967383 | 46692.66 | 523 | 508 | 127.8 |
| D | 5 | 222 | 346311 | 2706.02 | 523 | 508 | 127.8 |
| D | 12 | 227 | 221306 | 1727.81 | 523 | 508 | 127.8 |
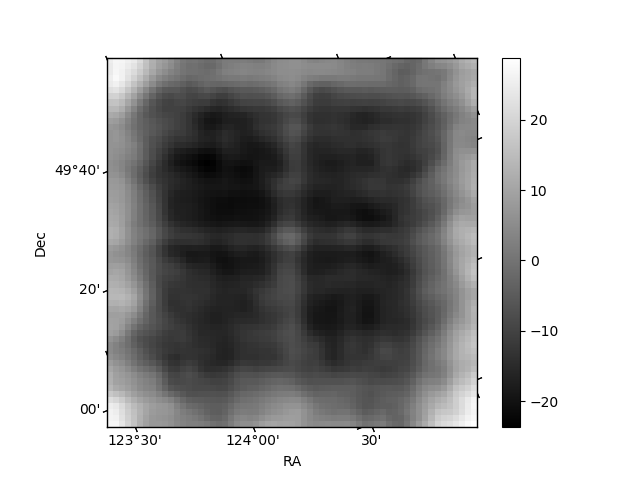
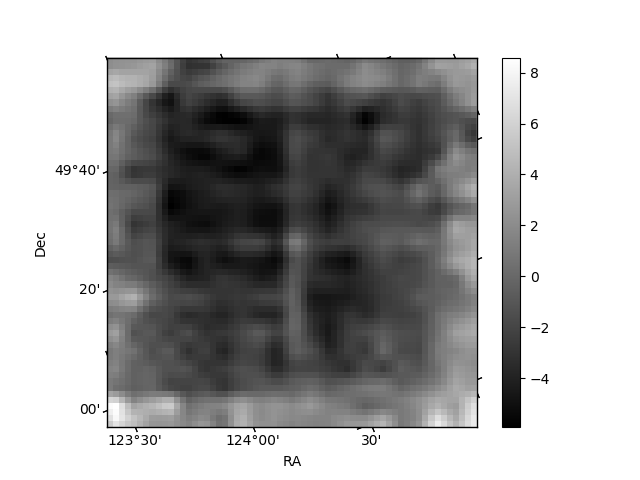
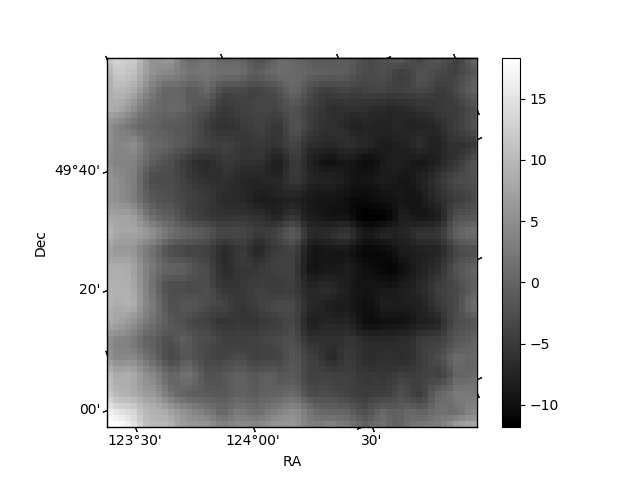
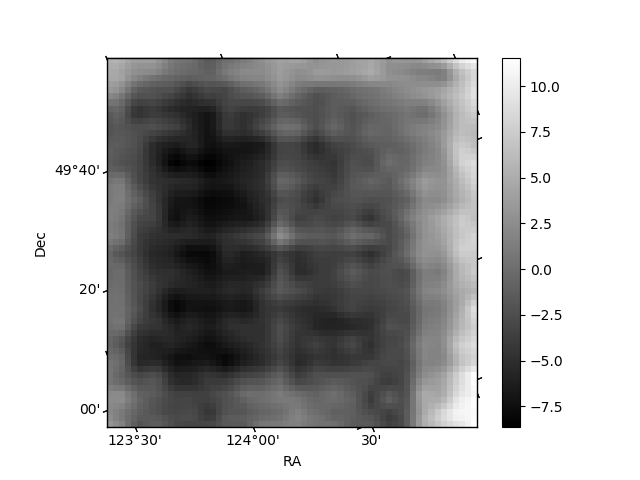
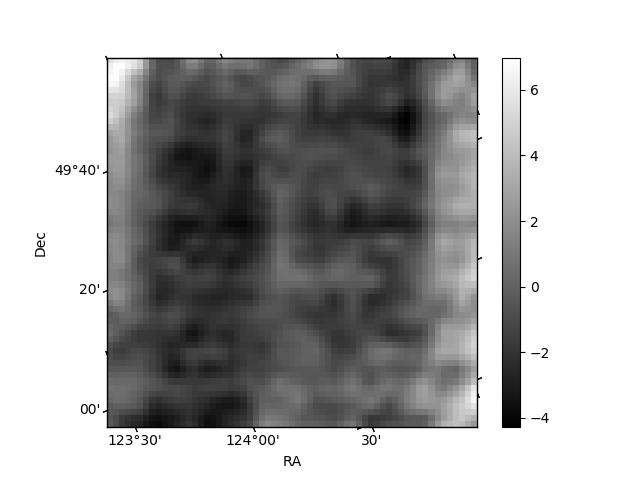
Histogram calculated using DETX and DETY for each event in the final _common_clean file
| Quadrant A | 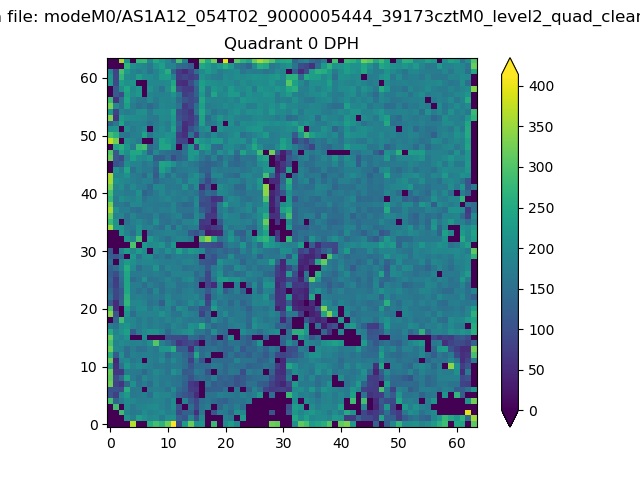 |
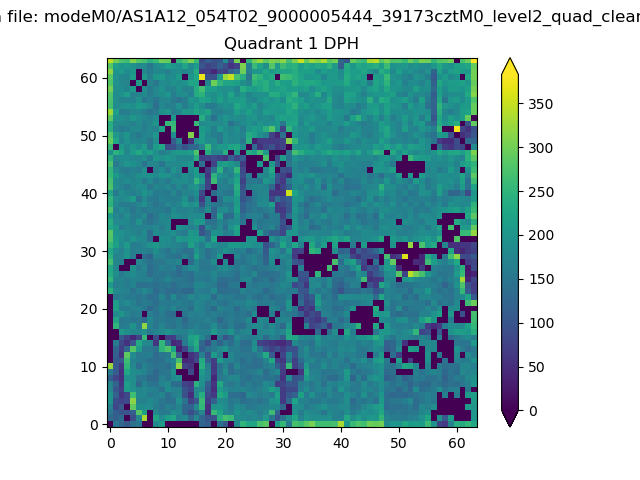 |
Quadrant B |
|---|---|---|---|
| Quadrant D | 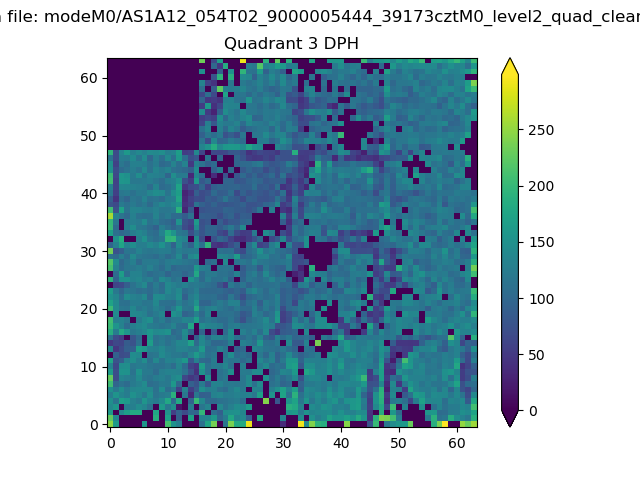 |
 |
Quadrant C |
| Plot type | Count rate plots | Images |
|---|---|---|
| Comparison with Poisson distribution Blue bars denote a histogram of data divided into 1 sec bins. Red curve is a Poisson curve with rate = median count rate of data. |
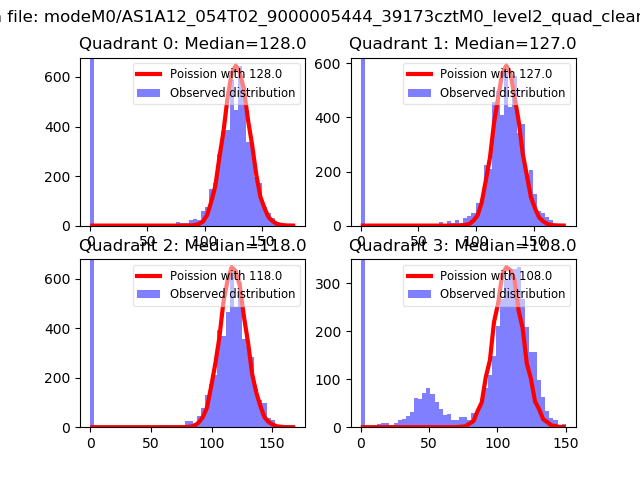 |
 |
| Quadrant-wise count rates Data is divided into 100 sec bins |
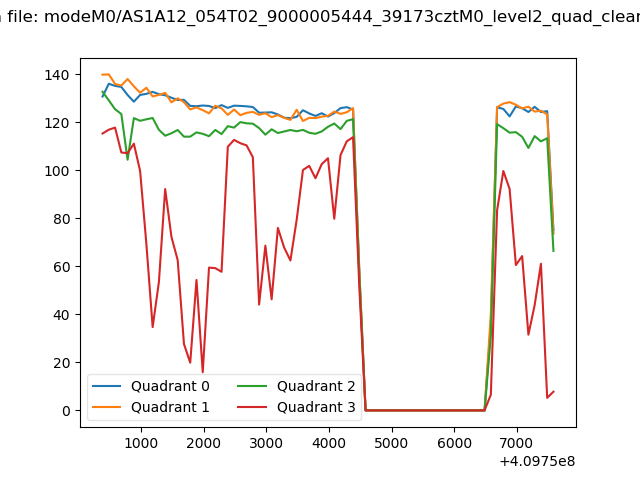 |
|
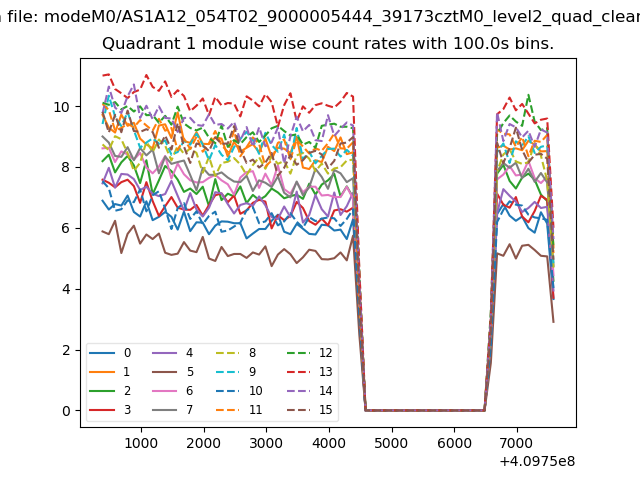
| Module-wise count rates for Quadrant A Data is divided into 100 sec bins |
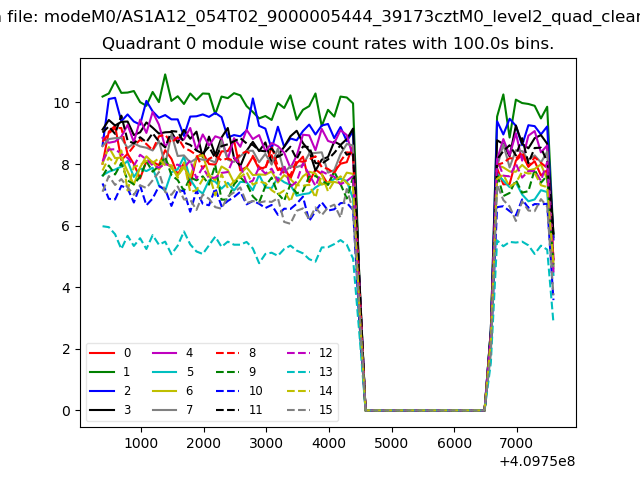 |
 |
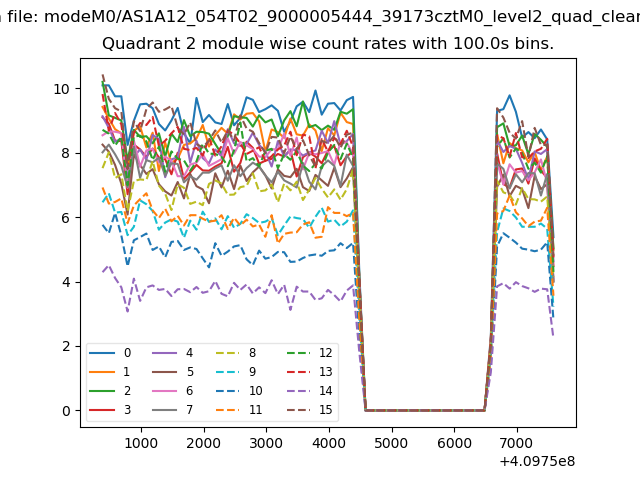
| Module-wise count rates for Quadrant B Data is divided into 100 sec bins |
 |
 |
| Module-wise count rates for Quadrant C Data is divided into 100 sec bins |
 |
 |
| Module-wise count rates for Quadrant D Data is divided into 100 sec bins |
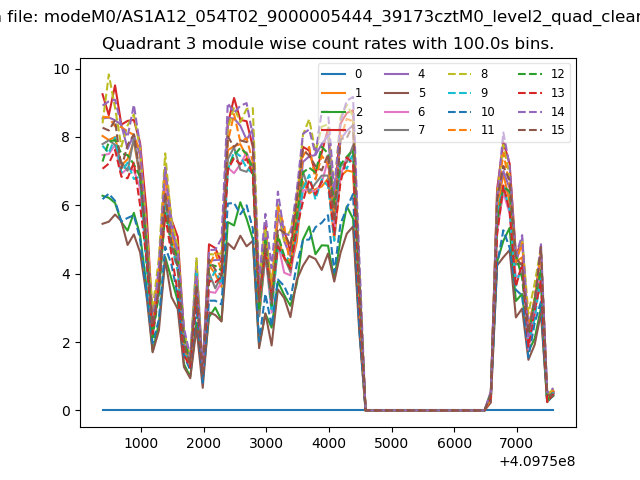 |
 |
| Parameter | Plot |
|---|---|
| CZT HV Monitor | 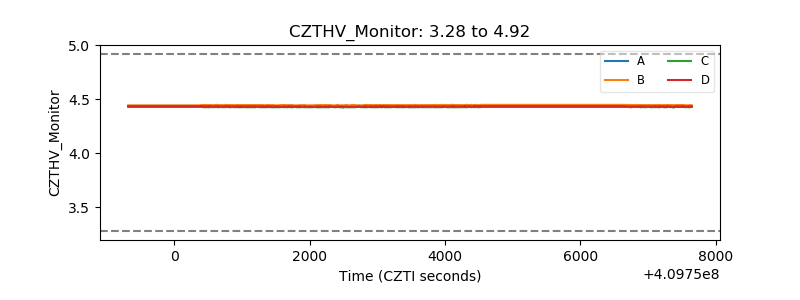 |
| D_VDD | 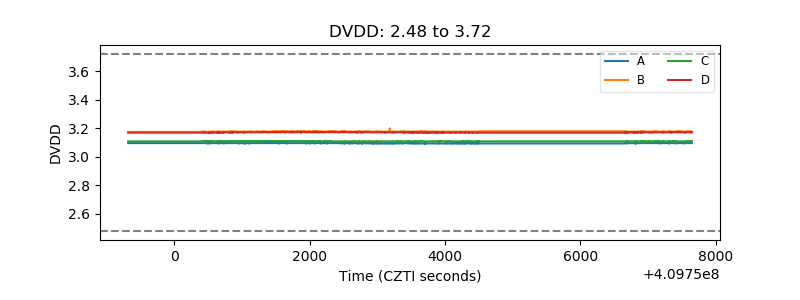 |
| Temperature 1 | 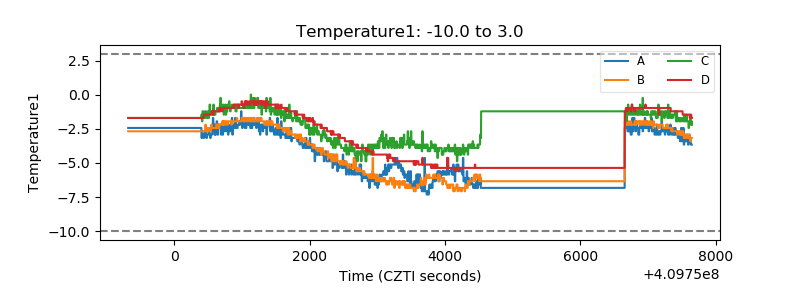 |
| Veto HV Monitor |  |
| Veto LLD | 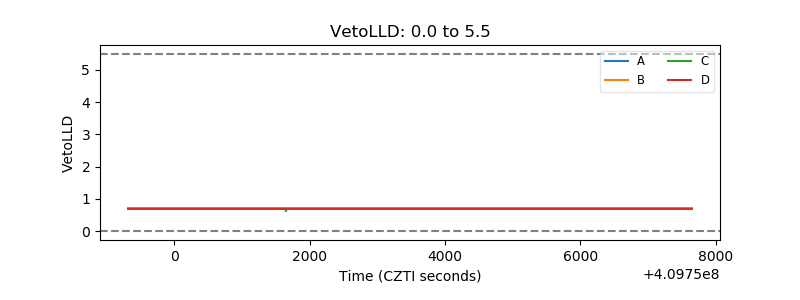 |
| Alpha Counter | 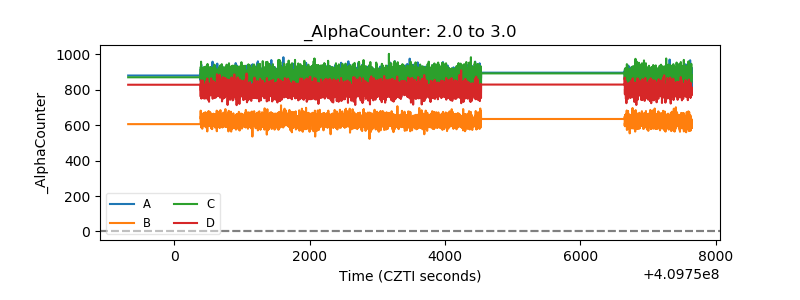 |
| _CPM_Rate | 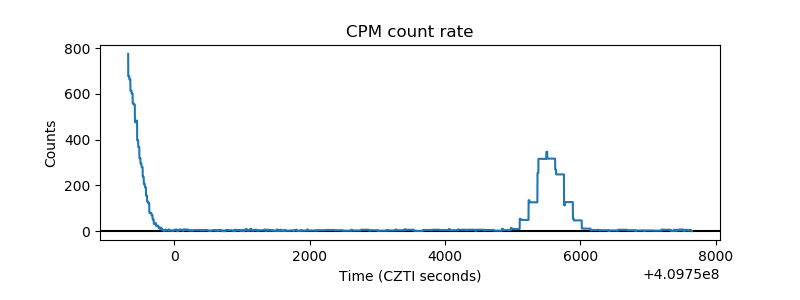 |
| CZT Counter |  |
| +2.5 Volts monitor | 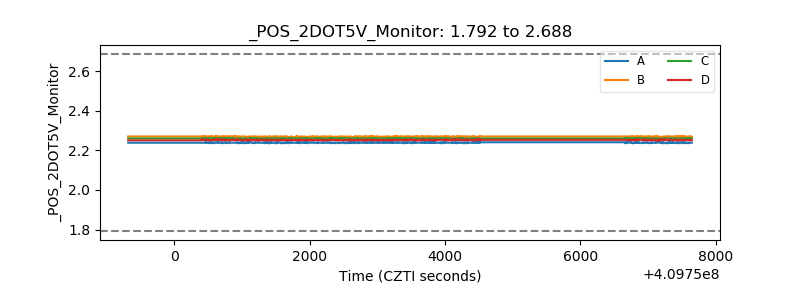 |
| +5 Volts monitor | 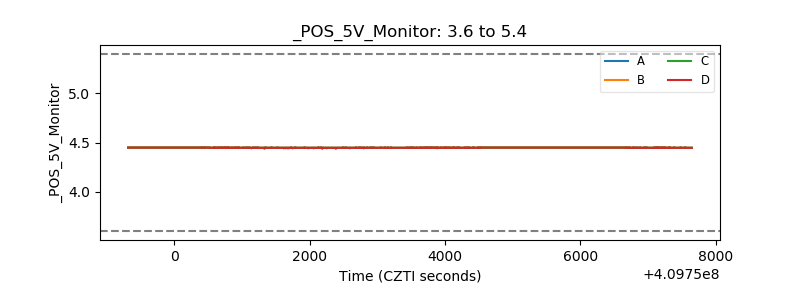 |
| _ROLL_ROT | 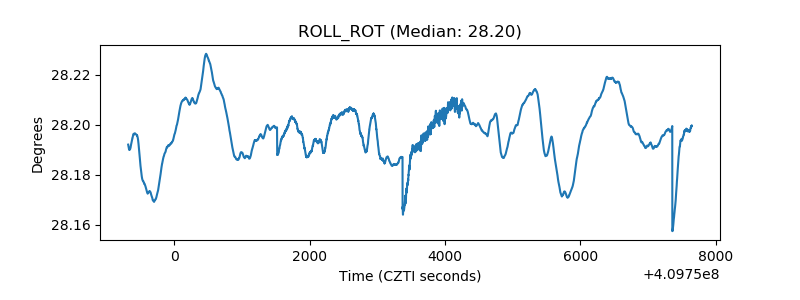 |
| _Roll_DEC |  |
| _Roll_RA | 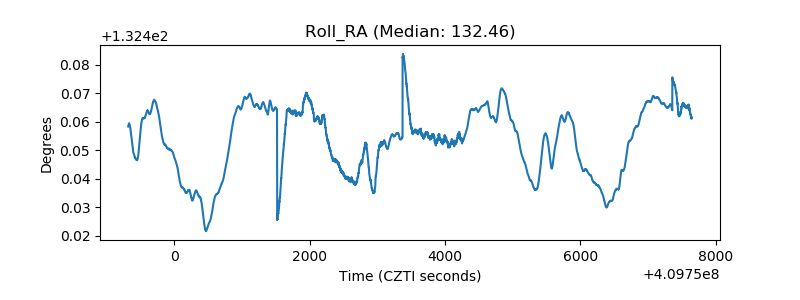 |
| Veto Counter | 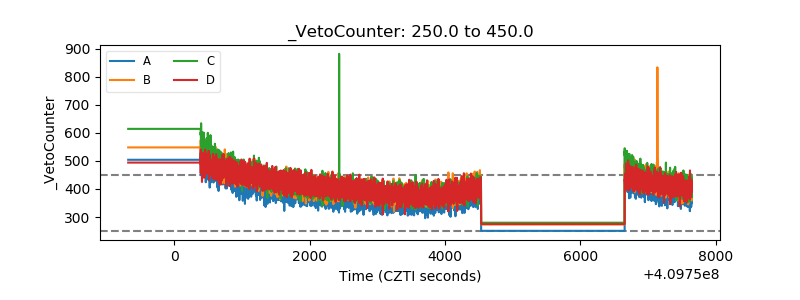 |