| Param | Original file | Final file |
|---|---|---|
| Filename | modeM0/AS1A12_054T02_9000005444_39174cztM0_level2.fits | modeM0/AS1A12_054T02_9000005444_39174cztM0_level2_quad_clean.evt |
| Size (bytes) | 453,548,160 | 82,656,000 |
| Size | 432.5 MB | 78.8 MB |
| Events in quadrant A | 2,807,941 | 611,241 |
| Events in quadrant B | 2,349,044 | 610,503 |
| Events in quadrant C | 2,515,097 | 571,110 |
| Events in quadrant D | 8,720,439 | 353,067 |
| Mode M9 | |||
|---|---|---|---|
| Quadrant | BADHDUFLAG | Total packets | Discarded packets |
| A | 0 | 31 | 0 |
| B | 0 | 31 | 0 |
| C | 0 | 31 | 0 |
| D | 0 | 32 | 0 |
| Mode M0 | |||
|---|---|---|---|
| Quadrant | BADHDUFLAG | Total packets | Discarded packets |
| A | 0 | 11632 | 3 |
| B | 0 | 10421 | 2 |
| C | 0 | 10636 | 2 |
| D | 0 | 29429 | 2 |
| Mode SS | |||
|---|---|---|---|
| Quadrant | BADHDUFLAG | Total packets | Discarded packets |
| A | 0 | 104 | 0 |
| B | 0 | 104 | 0 |
| C | 0 | 104 | 0 |
| D | 0 | 104 | 0 |
| Quadrant | Total seconds | Saturated seconds | Saturation percentage |
|---|---|---|---|
| A | 5089 | 26 | 0.510906% |
| B | 5089 | 9 | 0.176852% |
| C | 5089 | 14 | 0.275103% |
| D | 5089 | 2128 | 41.815681% |
Noise dominated data is calculated using 1-second bins in cleaned event files. If a bin has >2000 counts, and if more than 50% of those come from <1% of pixels, then it is considered to be noise-dominated and hence unusable.
| Quadrant | # 1 sec bins | Bins with >0 counts | Bins with >2000 counts | High rate bins dominated by noise | Noise dominated (total time) | Noise dominated (detector-on time) | Marked lightcurve |
|---|---|---|---|---|---|---|---|
| A | 7063 | 5090 | 10 | 10 | 0.14% | 0.20% | 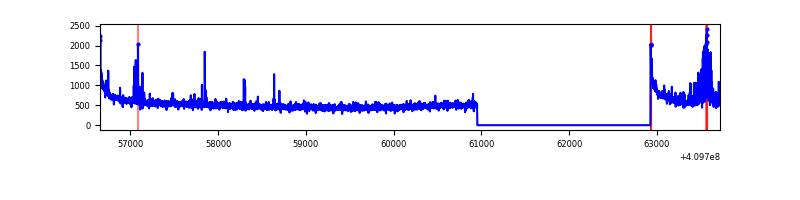 |
| B | 7063 | 5090 | 2 | 2 | 0.03% | 0.04% | 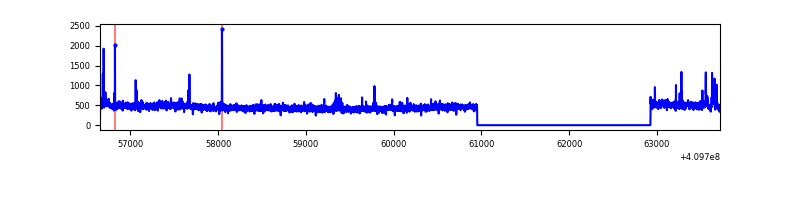 |
| C | 7063 | 5090 | 13 | 13 | 0.18% | 0.26% | 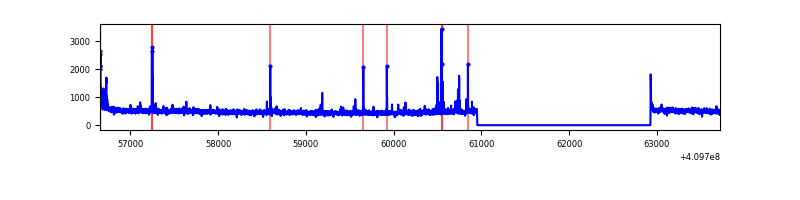 |
| D | 7063 | 5090 | 1896 | 1896 | 26.84% | 37.25% | 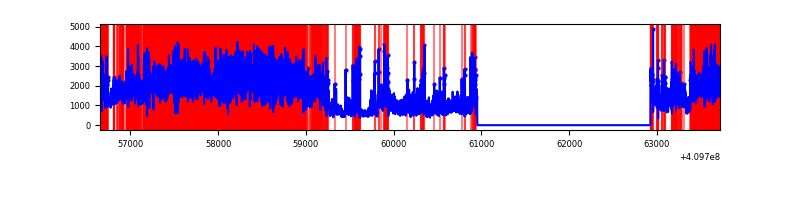 |
Top three noisy pixels from each quadrant. If the there are fewer than three noisy pixels in the level2.evt file, extra rows are filled as -1
| Pixel properties | Quadrant properties | ||||||
|---|---|---|---|---|---|---|---|
| Quadrant | DetID | PixID | Counts | Sigma | Mean | Median | Sigma |
| A | 10 | 83 | 428615 | 3699.02 | 571 | 560 | 115.7 |
| A | 13 | 248 | 126457 | 1087.94 | 571 | 560 | 115.7 |
| A | 2 | 79 | 23377 | 197.17 | 571 | 560 | 115.7 |
| B | 5 | 172 | 61863 | 572.51 | 563 | 550 | 107.1 |
| B | 0 | 213 | 55204 | 510.33 | 563 | 550 | 107.1 |
| B | 12 | 111 | 13265 | 118.73 | 563 | 550 | 107.1 |
| C | 15 | 214 | 213742 | 1644.07 | 553 | 556 | 129.7 |
| C | 9 | 187 | 125938 | 966.93 | 553 | 556 | 129.7 |
| C | 0 | 10 | 10072 | 73.39 | 553 | 556 | 129.7 |
| D | 12 | 235 | 5951618 | 49621.45 | 486 | 474 | 119.9 |
| D | 12 | 227 | 287364 | 2392.13 | 486 | 474 | 119.9 |
| D | 2 | 249 | 262858 | 2187.79 | 486 | 474 | 119.9 |
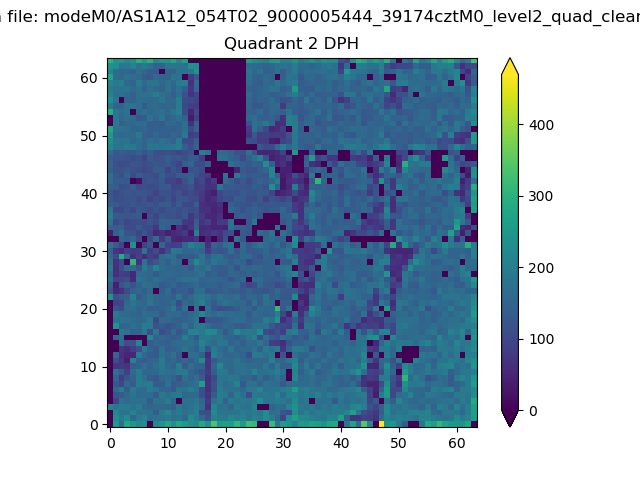
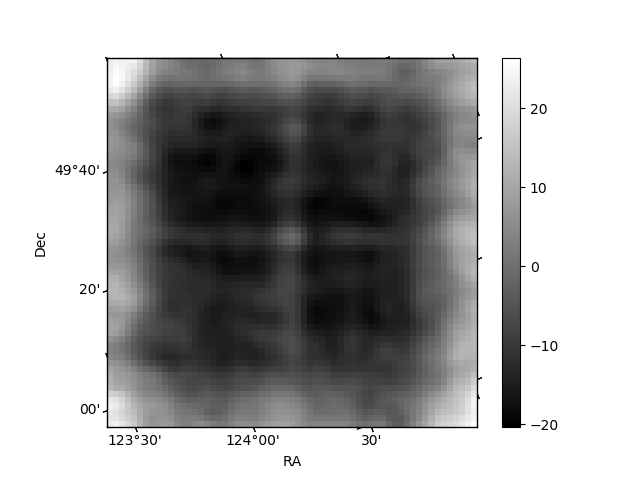
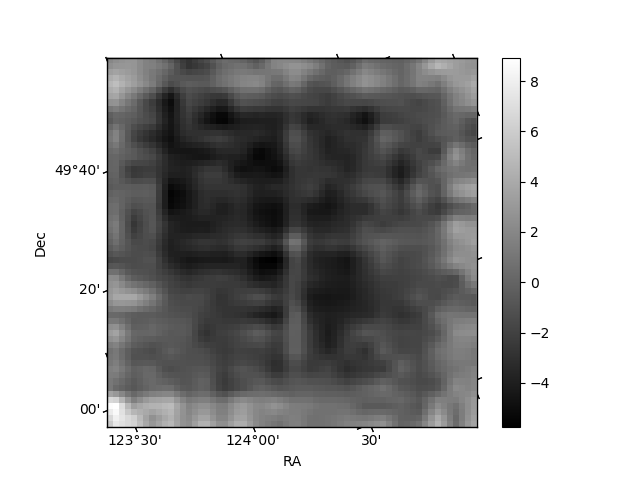
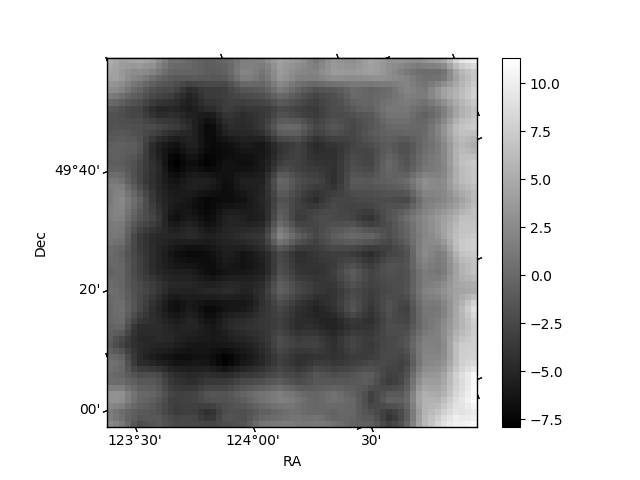
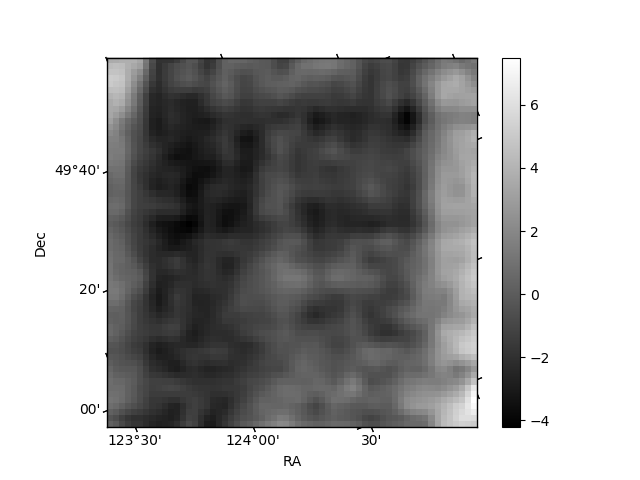
Histogram calculated using DETX and DETY for each event in the final _common_clean file
| Quadrant A | 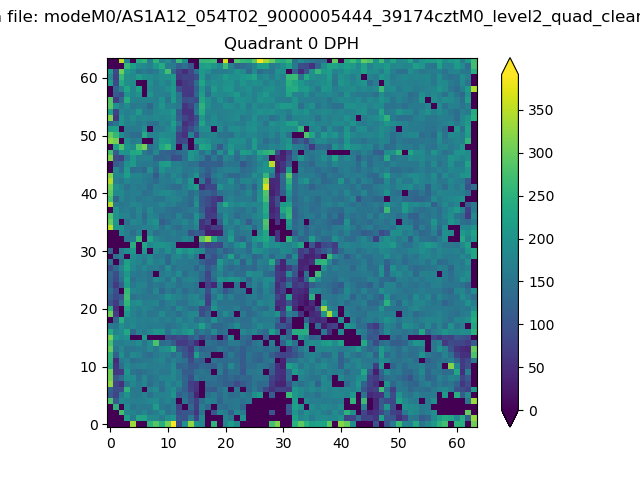 |
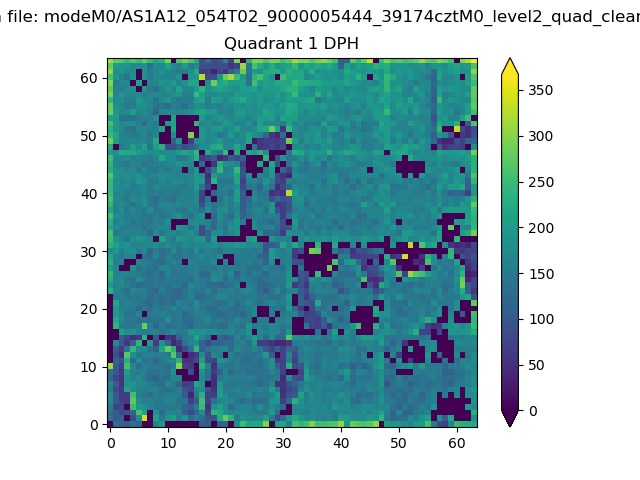 |
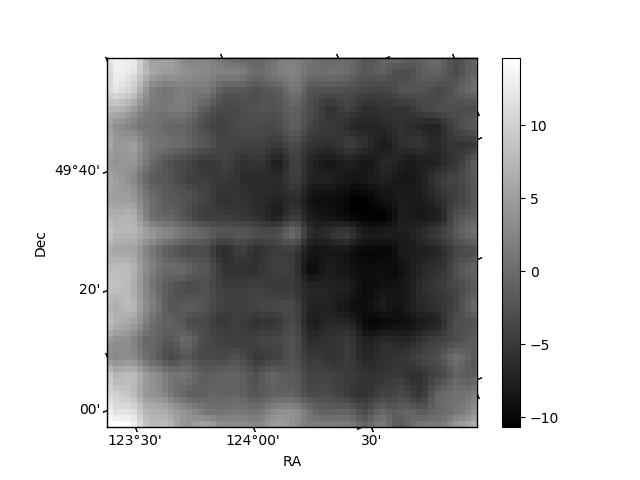
Quadrant B |
|---|---|---|---|
| Quadrant D | 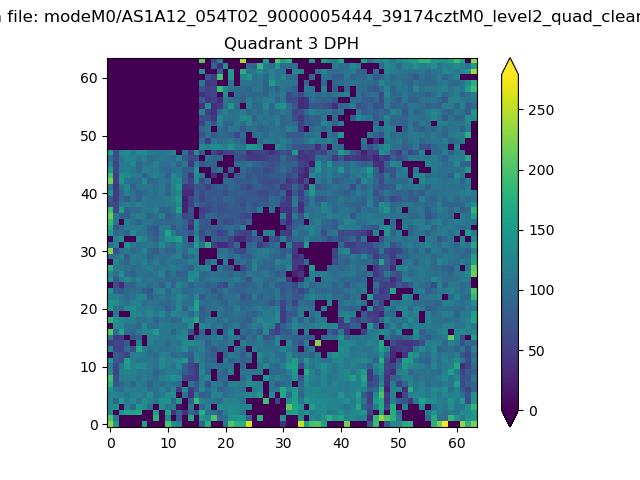 |
 |
Quadrant C |
| Plot type | Count rate plots | Images |
|---|---|---|
| Comparison with Poisson distribution Blue bars denote a histogram of data divided into 1 sec bins. Red curve is a Poisson curve with rate = median count rate of data. |
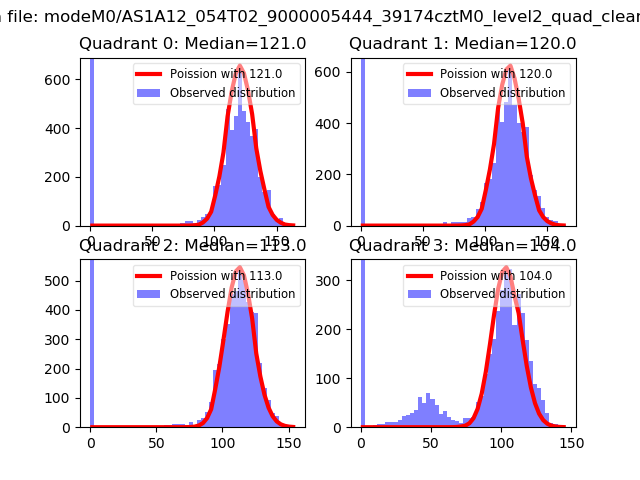 |
 |
| Quadrant-wise count rates Data is divided into 100 sec bins |
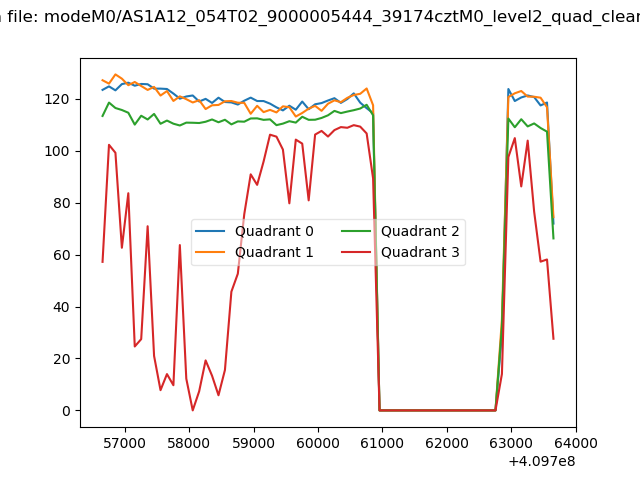 |
|
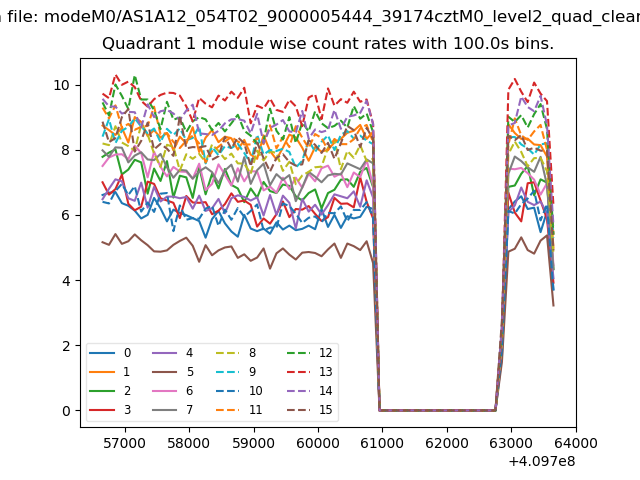
| Module-wise count rates for Quadrant A Data is divided into 100 sec bins |
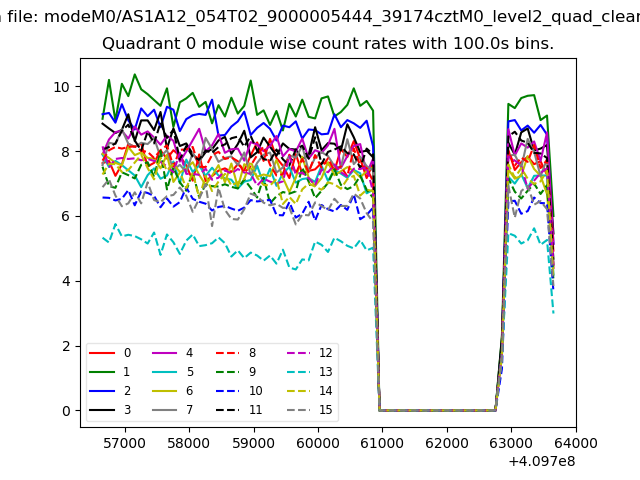 |
 |
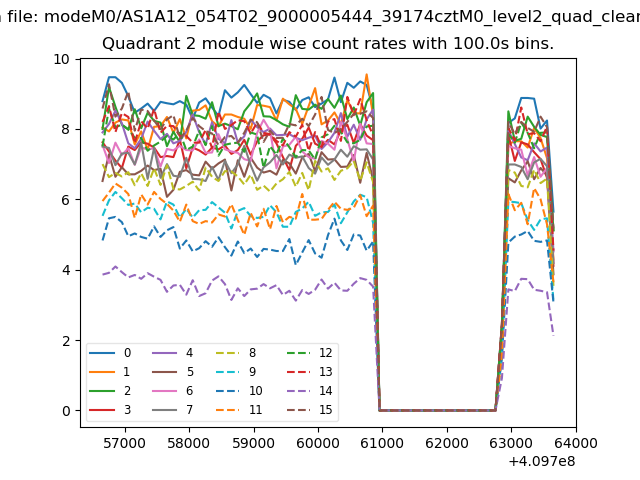
| Module-wise count rates for Quadrant B Data is divided into 100 sec bins |
 |
 |
| Module-wise count rates for Quadrant C Data is divided into 100 sec bins |
 |
 |
| Module-wise count rates for Quadrant D Data is divided into 100 sec bins |
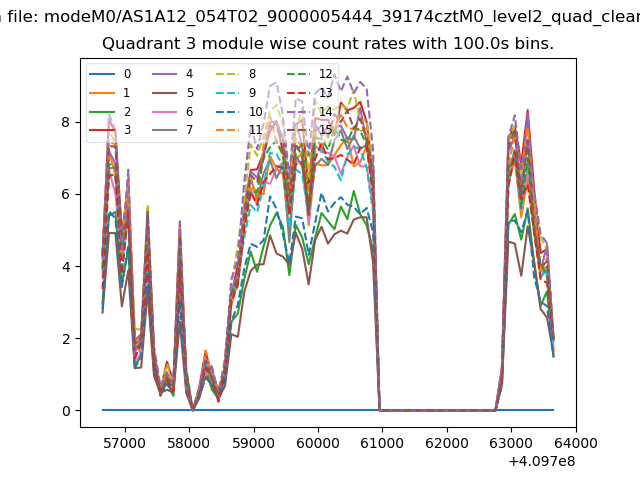 |
 |
| Parameter | Plot |
|---|---|
| CZT HV Monitor | 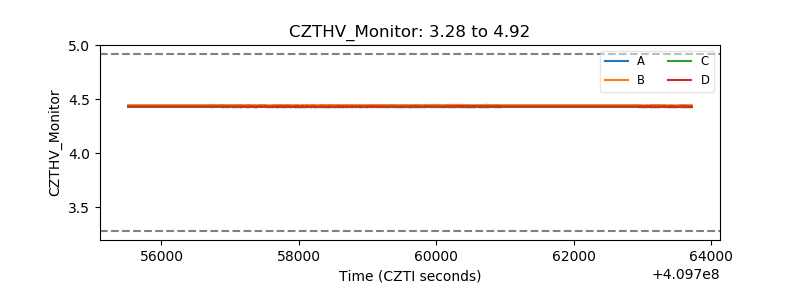 |
| D_VDD | 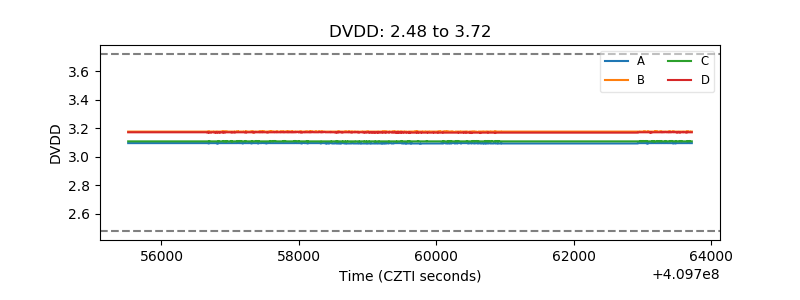 |
| Temperature 1 | 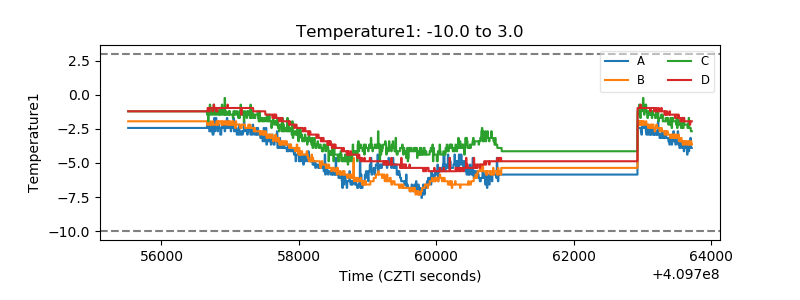 |
| Veto HV Monitor | 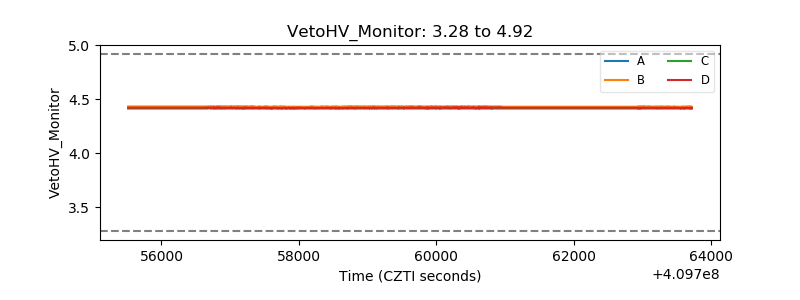 |
| Veto LLD | 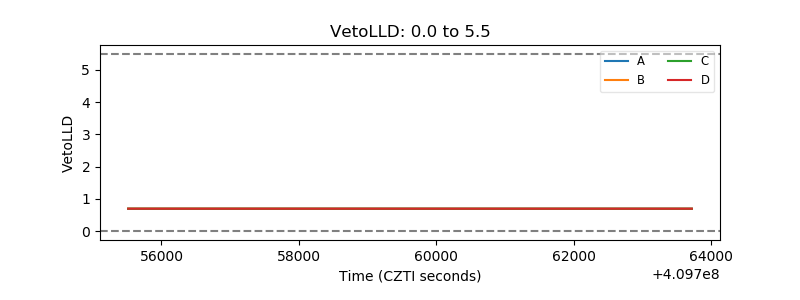 |
| Alpha Counter | 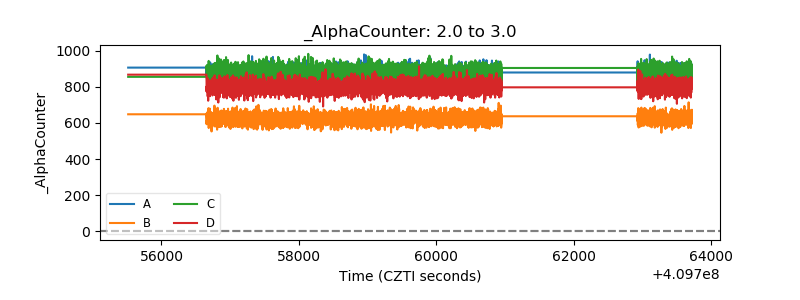 |
| _CPM_Rate | 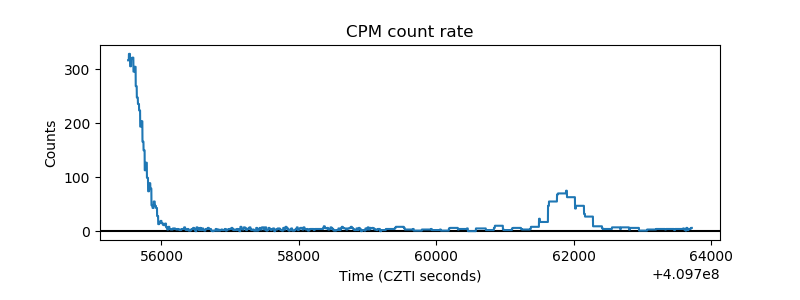 |
| CZT Counter | 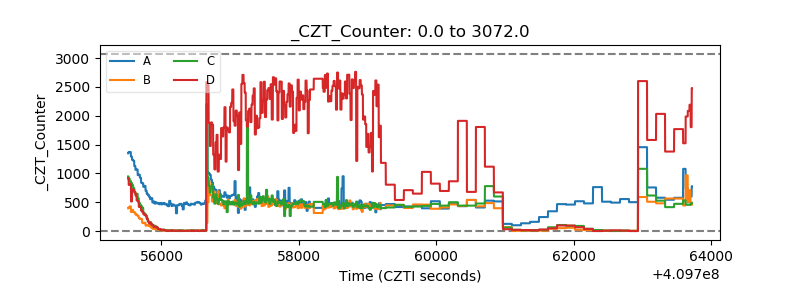 |
| +2.5 Volts monitor |  |
| +5 Volts monitor | 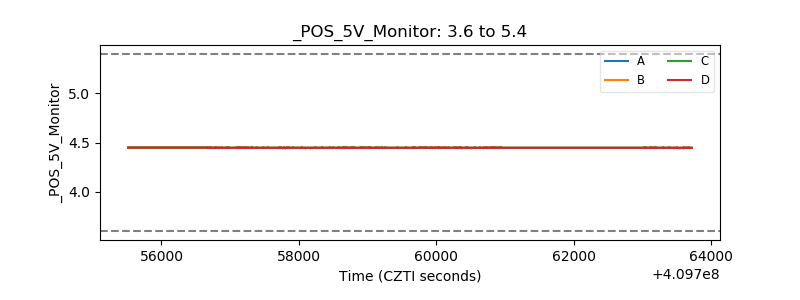 |
| _ROLL_ROT | 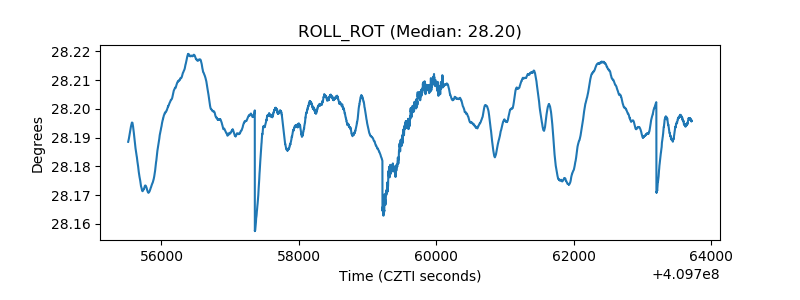 |
| _Roll_DEC | 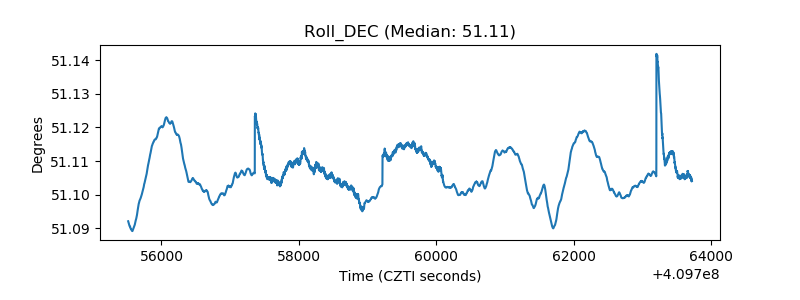 |
| _Roll_RA | 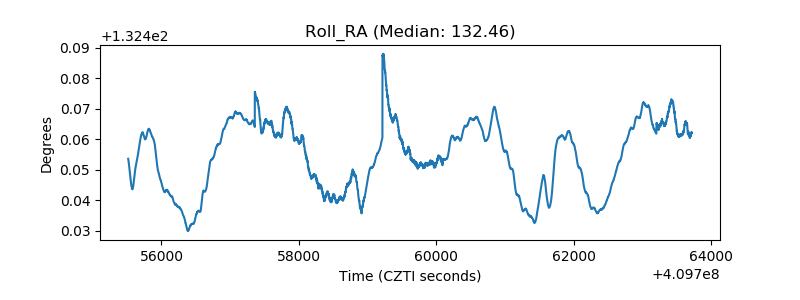 |
| Veto Counter | 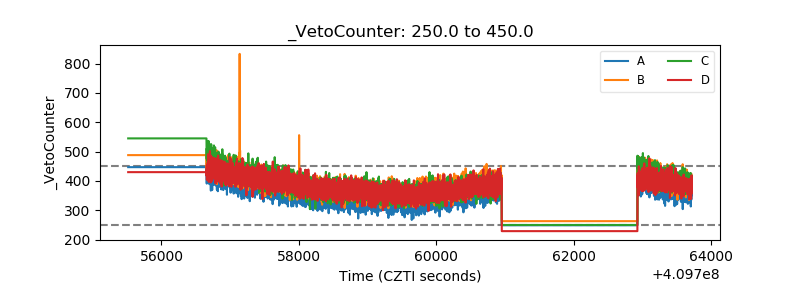 |