| Param | Original file | Final file |
|---|---|---|
| Filename | modeM0/AS1A12_054T02_9000005444_39176cztM0_level2.fits | modeM0/AS1A12_054T02_9000005444_39176cztM0_level2_quad_clean.evt |
| Size (bytes) | 451,664,640 | 92,160,000 |
| Size | 430.7 MB | 87.9 MB |
| Events in quadrant A | 3,056,711 | 646,828 |
| Events in quadrant B | 2,676,907 | 653,002 |
| Events in quadrant C | 2,732,663 | 619,819 |
| Events in quadrant D | 7,807,286 | 470,106 |
| Mode M9 | |||
|---|---|---|---|
| Quadrant | BADHDUFLAG | Total packets | Discarded packets |
| A | 0 | 30 | 0 |
| B | 0 | 30 | 0 |
| C | 0 | 30 | 0 |
| D | 0 | 30 | 0 |
| Mode M0 | |||
|---|---|---|---|
| Quadrant | BADHDUFLAG | Total packets | Discarded packets |
| A | 0 | 12747 | 3 |
| B | 0 | 12024 | 2 |
| C | 0 | 11840 | 2 |
| D | 0 | 27242 | 2 |
| Mode SS | |||
|---|---|---|---|
| Quadrant | BADHDUFLAG | Total packets | Discarded packets |
| A | 0 | 118 | 0 |
| B | 0 | 118 | 0 |
| C | 0 | 118 | 0 |
| D | 0 | 118 | 0 |
| Quadrant | Total seconds | Saturated seconds | Saturation percentage |
|---|---|---|---|
| A | 5732 | 39 | 0.680391% |
| B | 5732 | 19 | 0.331472% |
| C | 5732 | 14 | 0.244243% |
| D | 5732 | 1324 | 23.098395% |
Noise dominated data is calculated using 1-second bins in cleaned event files. If a bin has >2000 counts, and if more than 50% of those come from <1% of pixels, then it is considered to be noise-dominated and hence unusable.
| Quadrant | # 1 sec bins | Bins with >0 counts | Bins with >2000 counts | High rate bins dominated by noise | Noise dominated (total time) | Noise dominated (detector-on time) | Marked lightcurve |
|---|---|---|---|---|---|---|---|
| A | 8749 | 5734 | 22 | 22 | 0.25% | 0.38% | 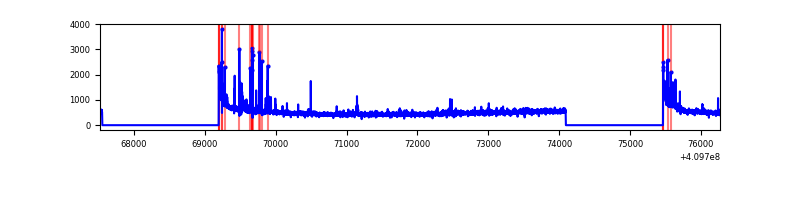 |
| B | 8749 | 5734 | 8 | 8 | 0.09% | 0.14% | 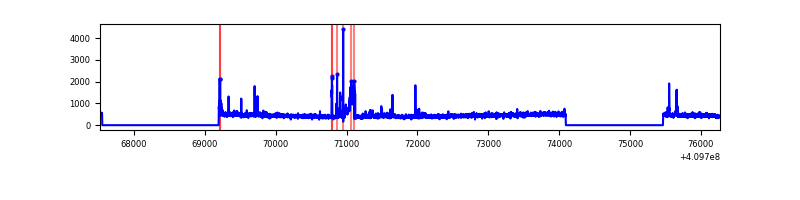 |
| C | 8749 | 5734 | 5 | 5 | 0.06% | 0.09% | 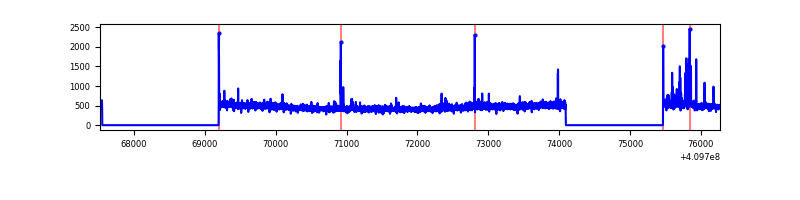 |
| D | 8749 | 5734 | 1139 | 1139 | 13.02% | 19.86% | 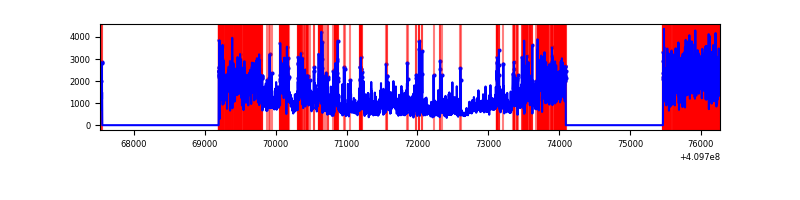 |
Top three noisy pixels from each quadrant. If the there are fewer than three noisy pixels in the level2.evt file, extra rows are filled as -1
| Pixel properties | Quadrant properties | ||||||
|---|---|---|---|---|---|---|---|
| Quadrant | DetID | PixID | Counts | Sigma | Mean | Median | Sigma |
| A | 10 | 83 | 453823 | 3582.88 | 626 | 615 | 126.5 |
| A | 9 | 143 | 110451 | 868.32 | 626 | 615 | 126.5 |
| A | 2 | 79 | 31877 | 247.14 | 626 | 615 | 126.5 |
| B | 5 | 184 | 165468 | 1355.78 | 621 | 604 | 121.6 |
| B | 5 | 172 | 34072 | 275.23 | 621 | 604 | 121.6 |
| B | 0 | 190 | 26690 | 214.52 | 621 | 604 | 121.6 |
| C | 15 | 214 | 238249 | 1670.11 | 609 | 611 | 142.3 |
| C | 9 | 187 | 92167 | 643.45 | 609 | 611 | 142.3 |
| C | 0 | 10 | 14915 | 100.53 | 609 | 611 | 142.3 |
| D | 12 | 235 | 4803125 | 33932.24 | 569 | 551 | 141.5 |
| D | 2 | 249 | 351821 | 2481.87 | 569 | 551 | 141.5 |
| D | 12 | 233 | 205950 | 1451.23 | 569 | 551 | 141.5 |
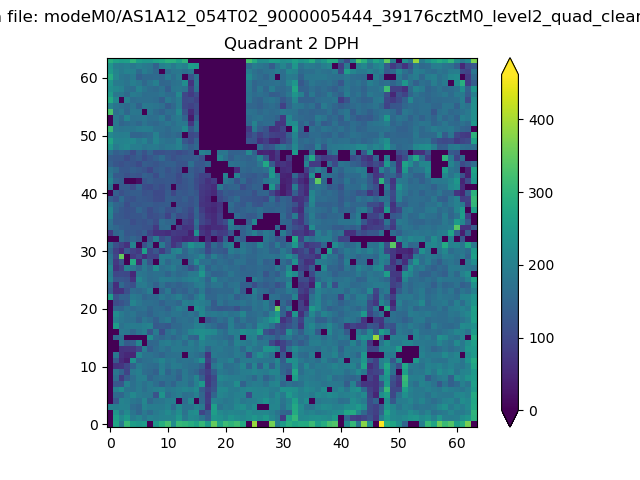
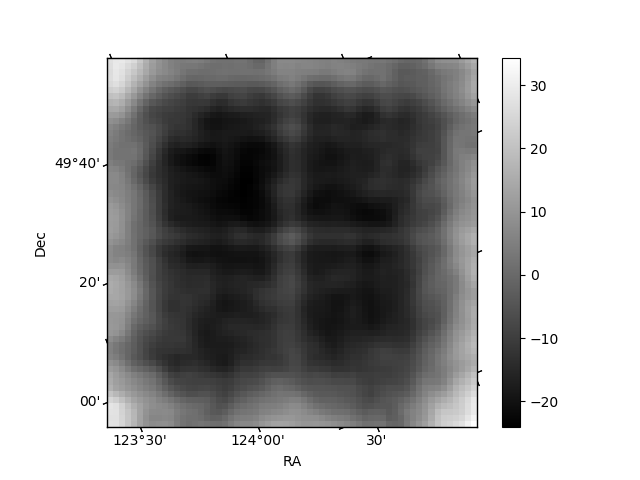
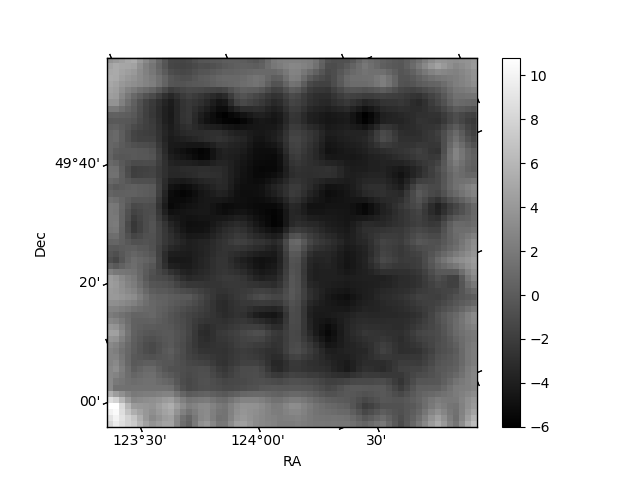
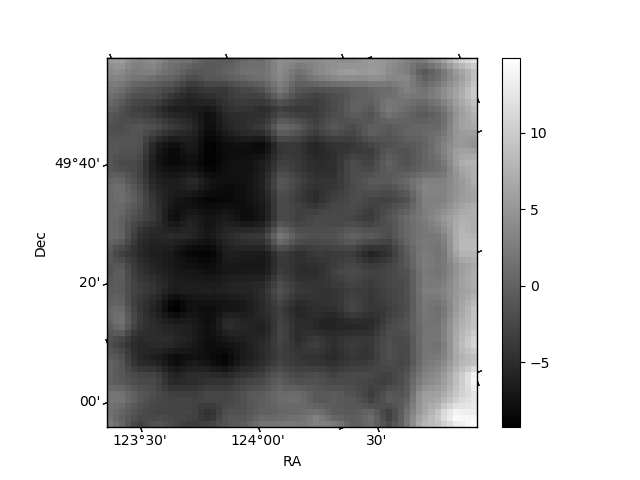
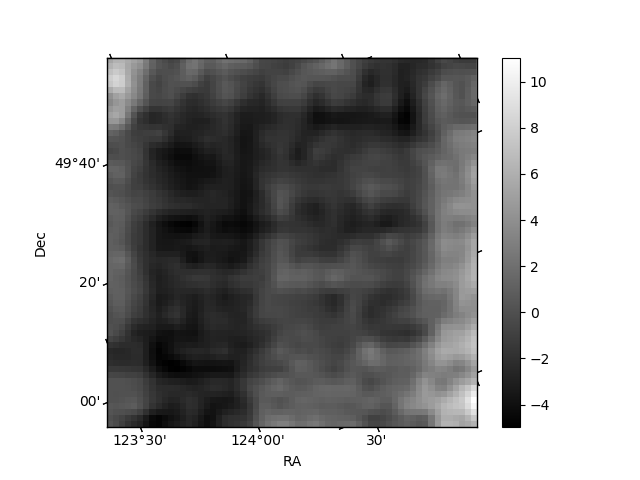
Histogram calculated using DETX and DETY for each event in the final _common_clean file
| Quadrant A | 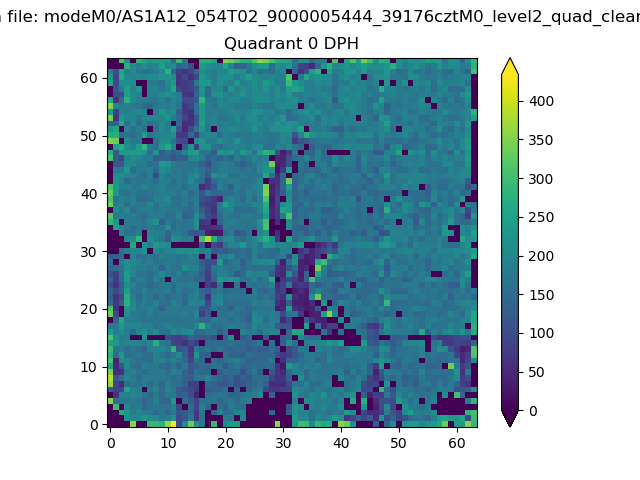 |
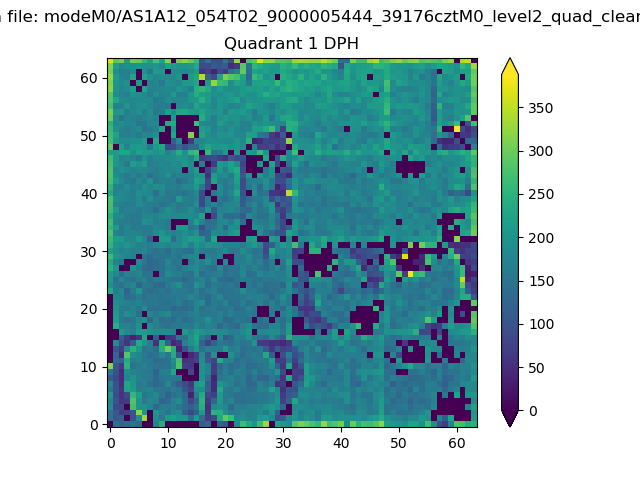 |
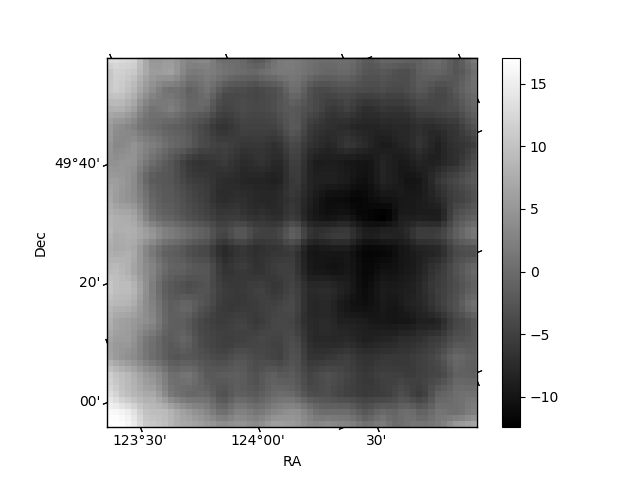
Quadrant B |
|---|---|---|---|
| Quadrant D | 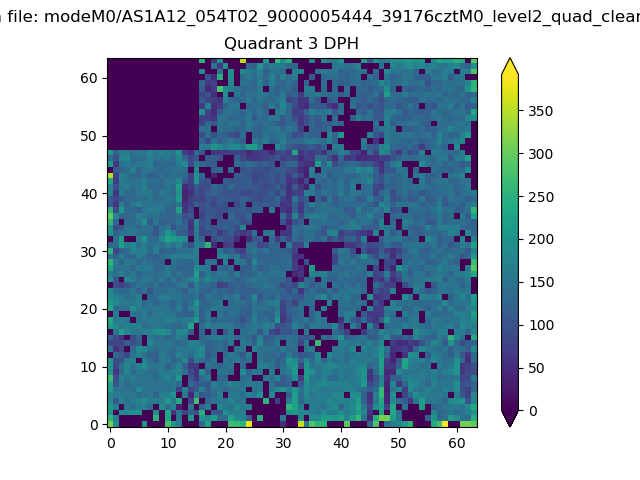 |
 |
Quadrant C |
| Plot type | Count rate plots | Images |
|---|---|---|
| Comparison with Poisson distribution Blue bars denote a histogram of data divided into 1 sec bins. Red curve is a Poisson curve with rate = median count rate of data. |
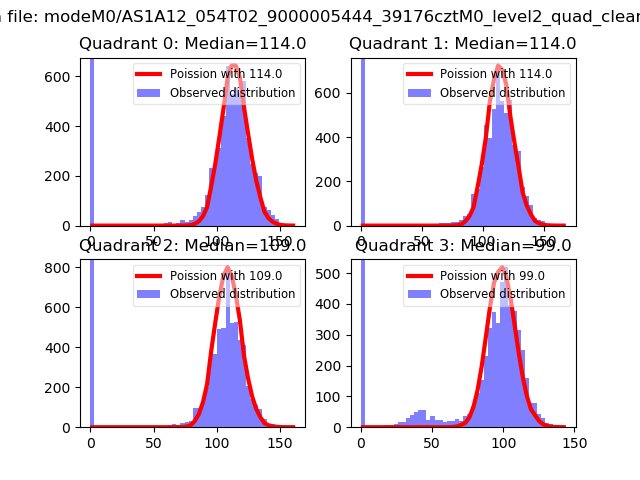 |
 |
| Quadrant-wise count rates Data is divided into 100 sec bins |
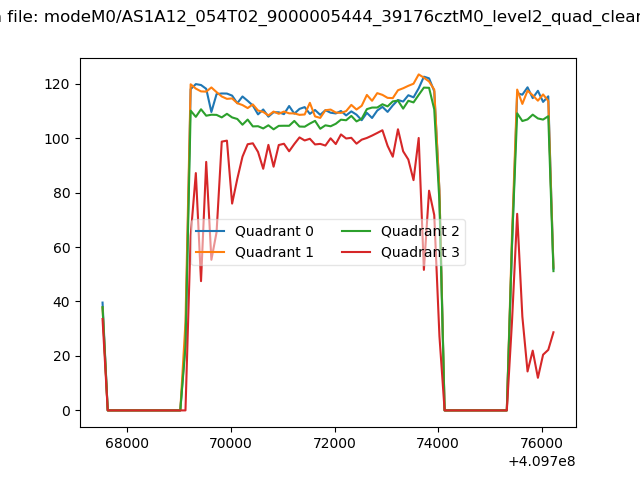 |
|
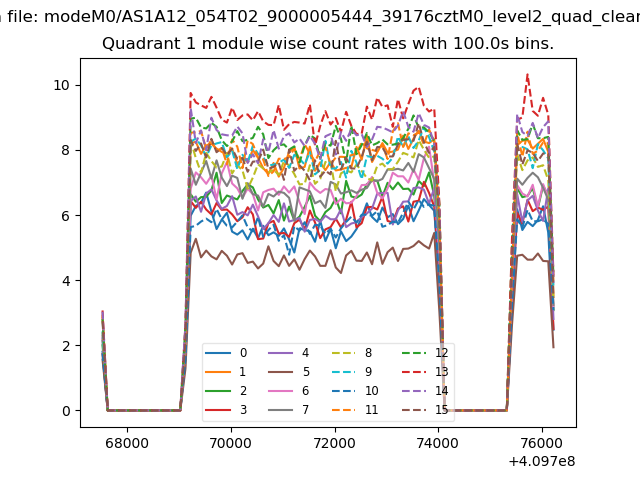
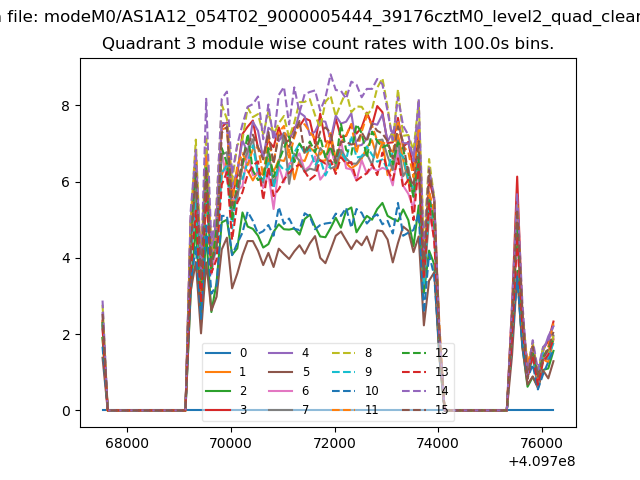
| Module-wise count rates for Quadrant A Data is divided into 100 sec bins |
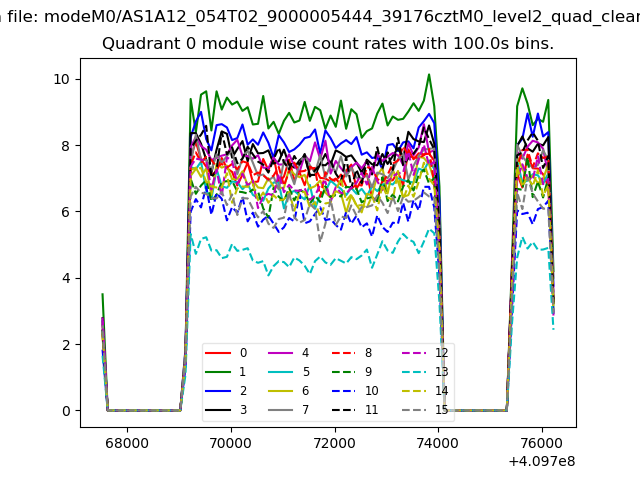 |
 |
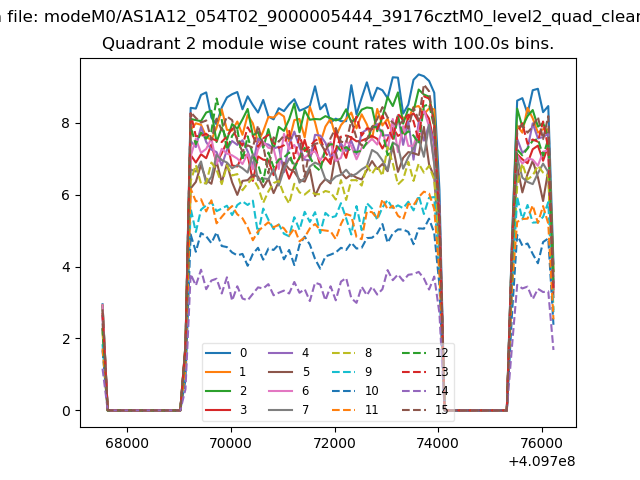
| Module-wise count rates for Quadrant B Data is divided into 100 sec bins |
 |
 |
| Module-wise count rates for Quadrant C Data is divided into 100 sec bins |
 |
 |
| Module-wise count rates for Quadrant D Data is divided into 100 sec bins |
 |
 |
| Parameter | Plot |
|---|---|
| CZT HV Monitor | 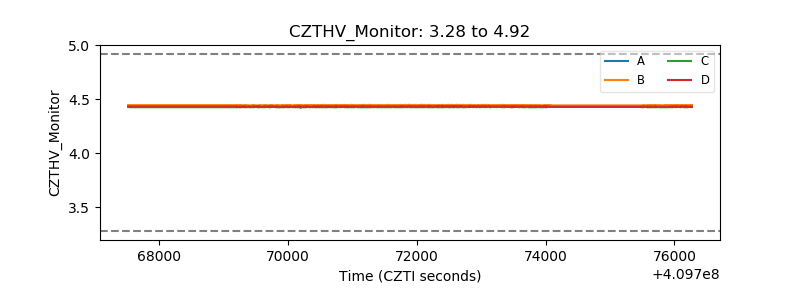 |
| D_VDD | 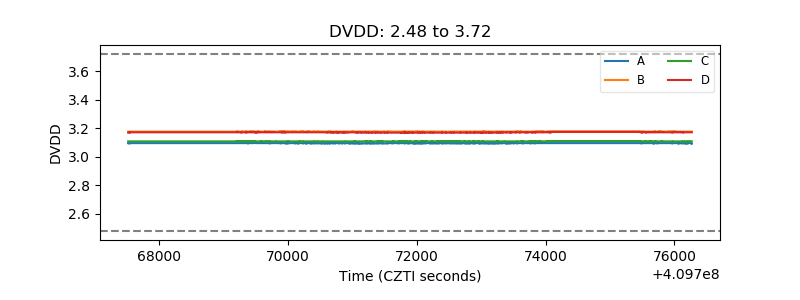 |
| Temperature 1 | 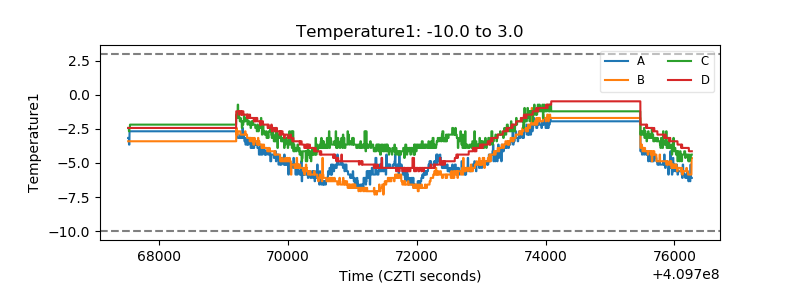 |
| Veto HV Monitor |  |
| Veto LLD | 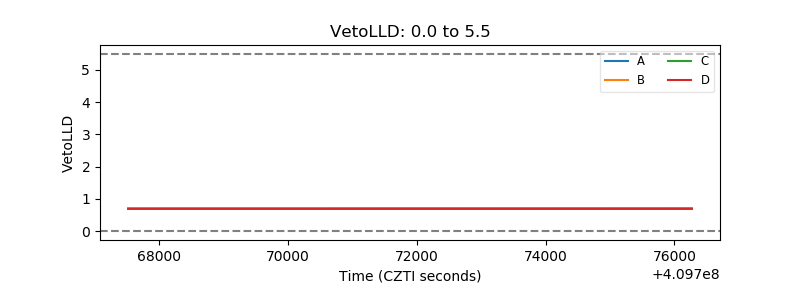 |
| Alpha Counter | 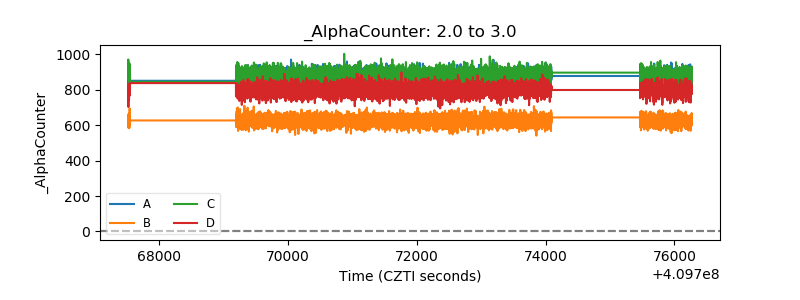 |
| _CPM_Rate | 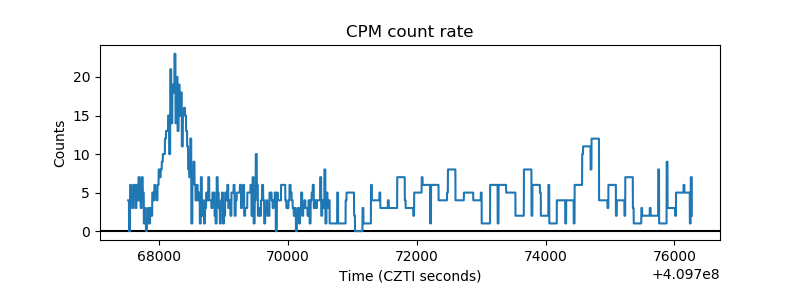 |
| CZT Counter | 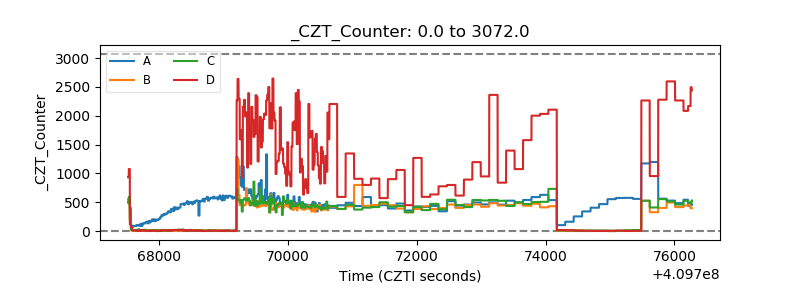 |
| +2.5 Volts monitor | 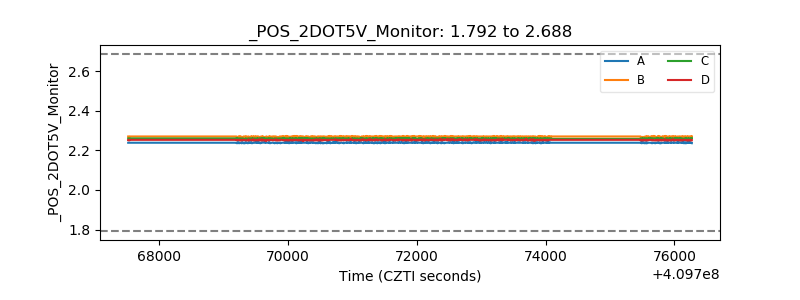 |
| +5 Volts monitor | 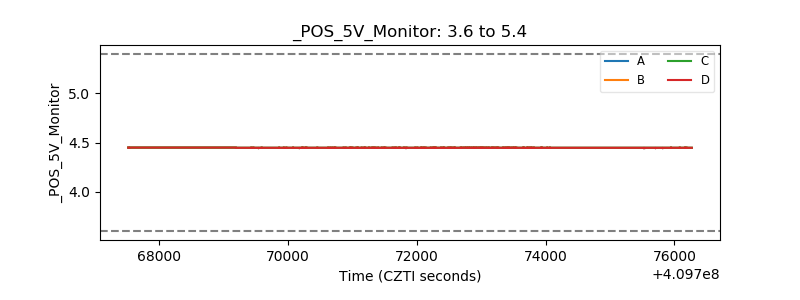 |
| _ROLL_ROT | 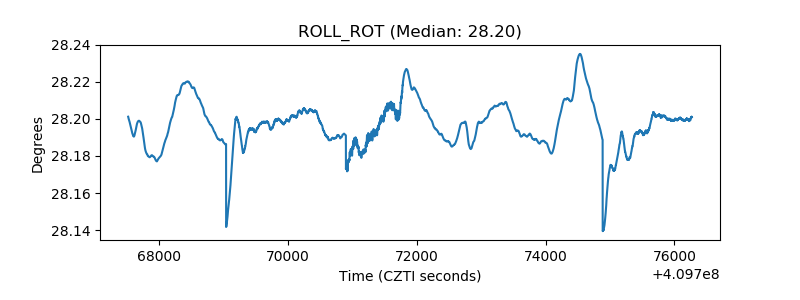 |
| _Roll_DEC | 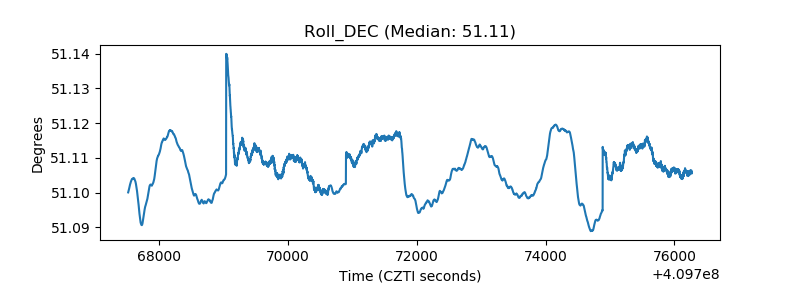 |
| _Roll_RA | 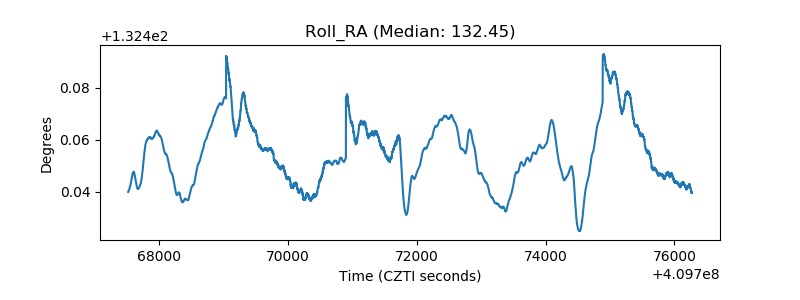 |
| Veto Counter | 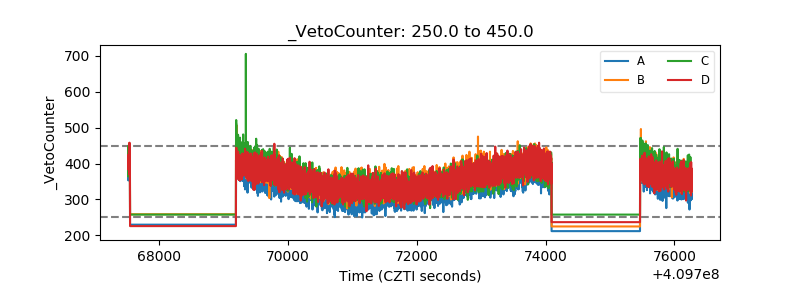 |