| Param | Original file | Final file |
|---|---|---|
| Filename | modeM0/AS1A12_054T02_9000005444_39180cztM0_level2.fits | modeM0/AS1A12_054T02_9000005444_39180cztM0_level2_quad_clean.evt |
| Size (bytes) | 1,163,957,760 | 224,023,680 |
| Size | 1.1 GB | 213.6 MB |
| Events in quadrant A | 7,207,593 | 1,578,906 |
| Events in quadrant B | 6,444,104 | 1,605,609 |
| Events in quadrant C | 6,849,162 | 1,523,436 |
| Events in quadrant D | 21,452,373 | 1,063,332 |
| Mode M9 | |||
|---|---|---|---|
| Quadrant | BADHDUFLAG | Total packets | Discarded packets |
| A | 0 | 54 | 0 |
| B | 0 | 53 | 0 |
| C | 0 | 53 | 0 |
| D | 0 | 53 | 0 |
| Mode M0 | |||
|---|---|---|---|
| Quadrant | BADHDUFLAG | Total packets | Discarded packets |
| A | 0 | 30963 | 3 |
| B | 0 | 29908 | 3 |
| C | 0 | 30167 | 3 |
| D | 0 | 73912 | 3 |
| Mode SS | |||
|---|---|---|---|
| Quadrant | BADHDUFLAG | Total packets | Discarded packets |
| A | 0 | 304 | 0 |
| B | 0 | 304 | 0 |
| C | 0 | 304 | 0 |
| D | 0 | 304 | 0 |
| Quadrant | Total seconds | Saturated seconds | Saturation percentage |
|---|---|---|---|
| A | 14637 | 38 | 0.259616% |
| B | 14637 | 38 | 0.259616% |
| C | 14637 | 47 | 0.321104% |
| D | 14637 | 4136 | 28.257157% |
Noise dominated data is calculated using 1-second bins in cleaned event files. If a bin has >2000 counts, and if more than 50% of those come from <1% of pixels, then it is considered to be noise-dominated and hence unusable.
| Quadrant | # 1 sec bins | Bins with >0 counts | Bins with >2000 counts | High rate bins dominated by noise | Noise dominated (total time) | Noise dominated (detector-on time) | Marked lightcurve |
|---|---|---|---|---|---|---|---|
| A | 18726 | 14640 | 11 | 11 | 0.06% | 0.08% | 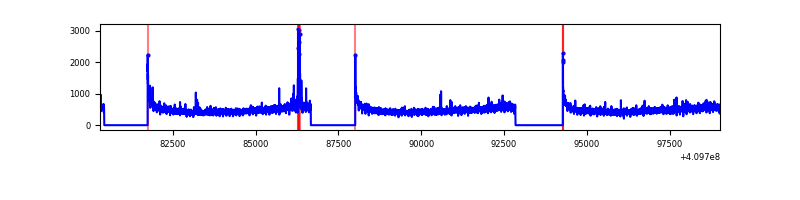 |
| B | 18726 | 14640 | 15 | 15 | 0.08% | 0.10% | 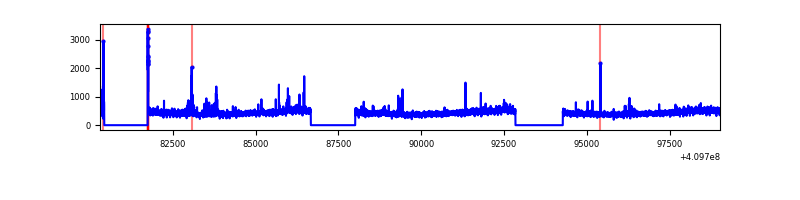 |
| C | 18726 | 14640 | 31 | 31 | 0.17% | 0.21% | 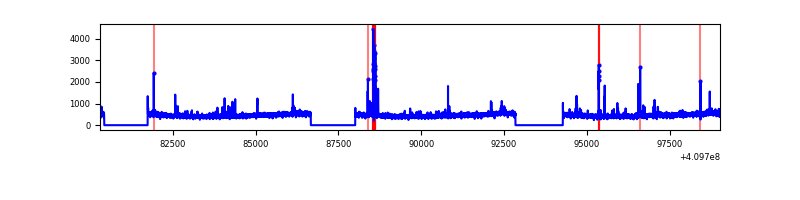 |
| D | 18726 | 14640 | 3446 | 3446 | 18.40% | 23.54% | 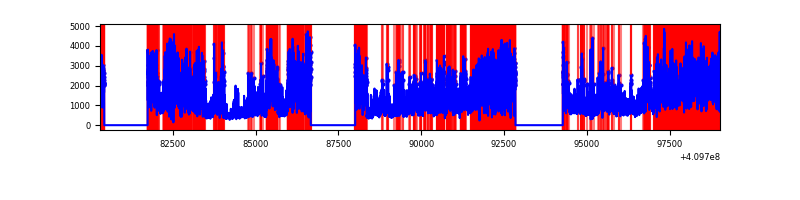 |
Top three noisy pixels from each quadrant. If the there are fewer than three noisy pixels in the level2.evt file, extra rows are filled as -1
| Pixel properties | Quadrant properties | ||||||
|---|---|---|---|---|---|---|---|
| Quadrant | DetID | PixID | Counts | Sigma | Mean | Median | Sigma |
| A | 10 | 83 | 954423 | 3005.25 | 1581 | 1550 | 317.1 |
| A | 13 | 248 | 68395 | 210.82 | 1581 | 1550 | 317.1 |
| A | 2 | 79 | 61984 | 190.6 | 1581 | 1550 | 317.1 |
| B | 5 | 184 | 171466 | 565.62 | 1564 | 1519 | 300.5 |
| B | 5 | 172 | 73573 | 239.81 | 1564 | 1519 | 300.5 |
| B | 0 | 213 | 47159 | 151.9 | 1564 | 1519 | 300.5 |
| C | 15 | 214 | 601078 | 1688.27 | 1527 | 1533 | 355.1 |
| C | 9 | 187 | 289230 | 810.13 | 1527 | 1533 | 355.1 |
| C | 13 | 61 | 10385 | 24.93 | 1527 | 1533 | 355.1 |
| D | 12 | 235 | 14755653 | 44065.99 | 1373 | 1333 | 334.8 |
| D | 2 | 249 | 711971 | 2122.43 | 1373 | 1333 | 334.8 |
| D | 12 | 233 | 164780 | 488.16 | 1373 | 1333 | 334.8 |
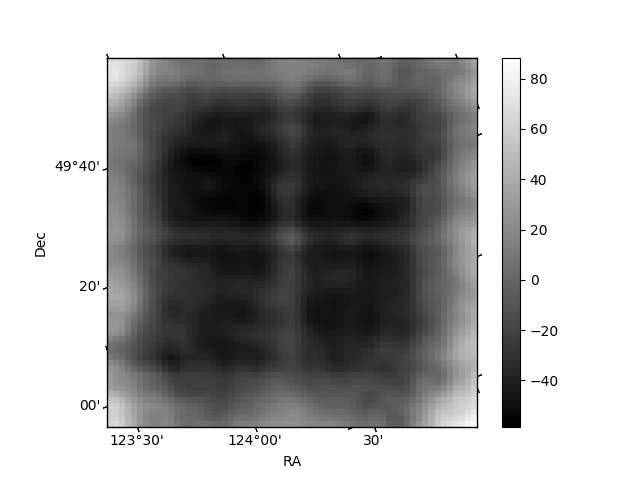
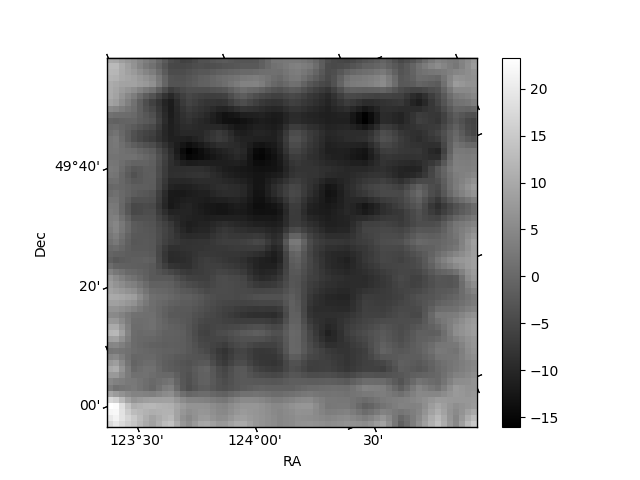
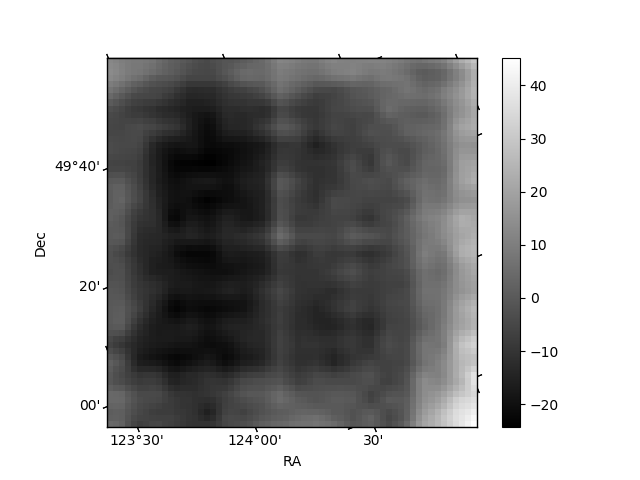
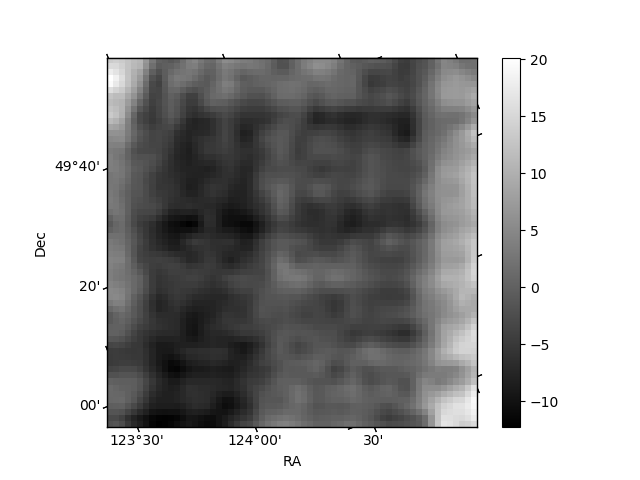
Histogram calculated using DETX and DETY for each event in the final _common_clean file
| Quadrant A | 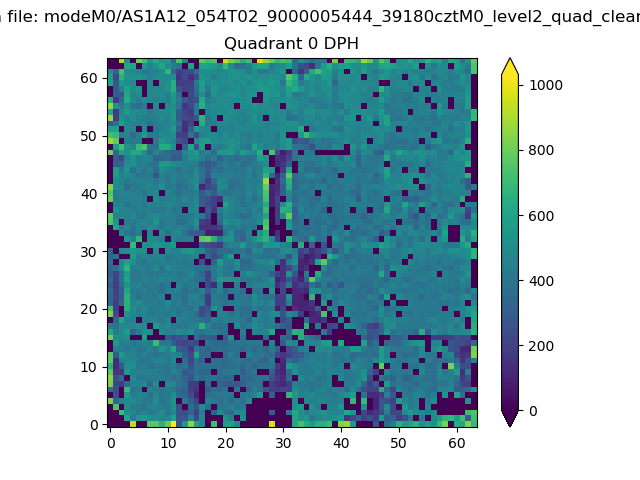 |
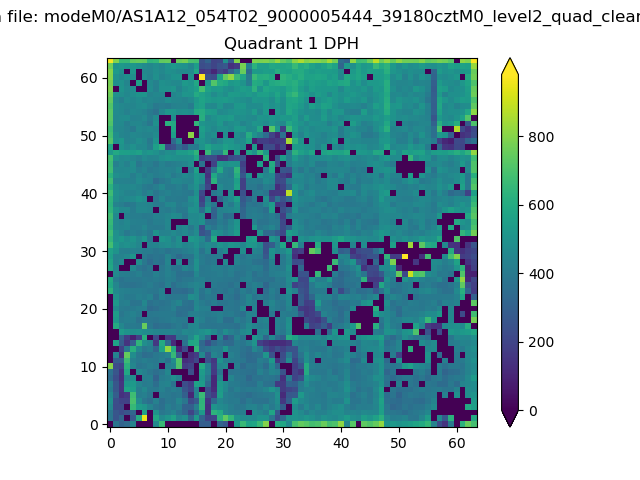 |
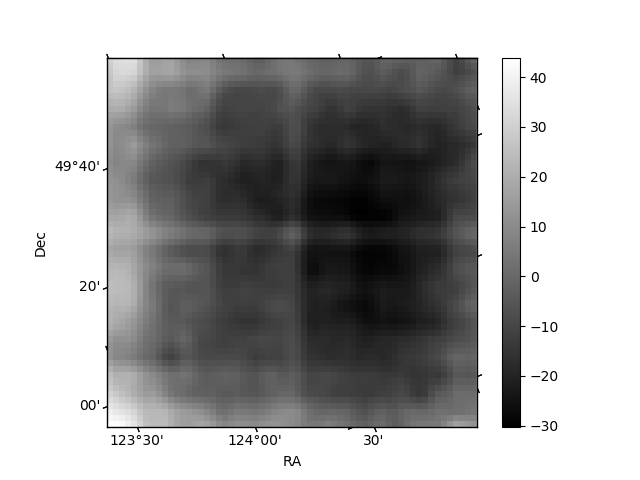
Quadrant B |
|---|---|---|---|
| Quadrant D | 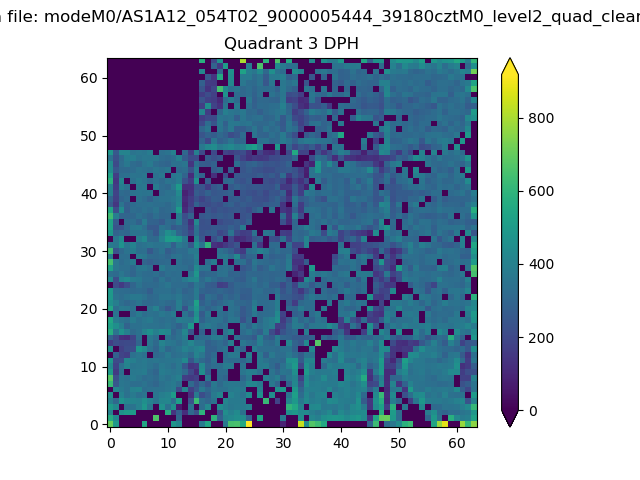 |
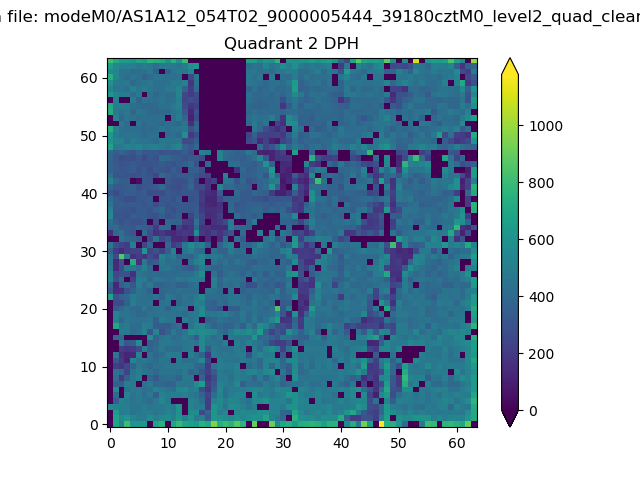 |
Quadrant C |
| Plot type | Count rate plots | Images |
|---|---|---|
| Comparison with Poisson distribution Blue bars denote a histogram of data divided into 1 sec bins. Red curve is a Poisson curve with rate = median count rate of data. |
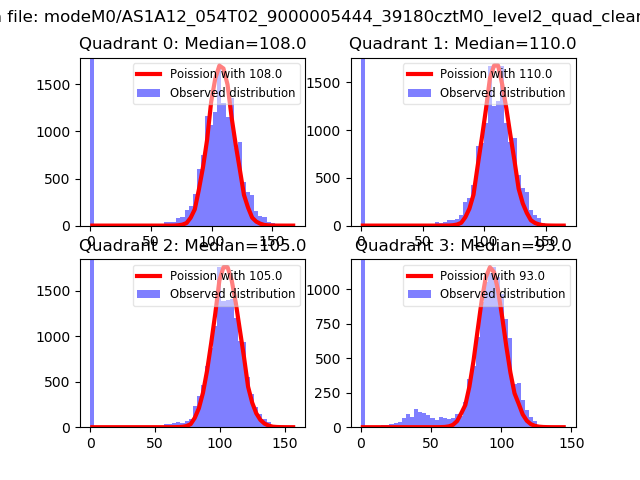 |
 |
| Quadrant-wise count rates Data is divided into 100 sec bins |
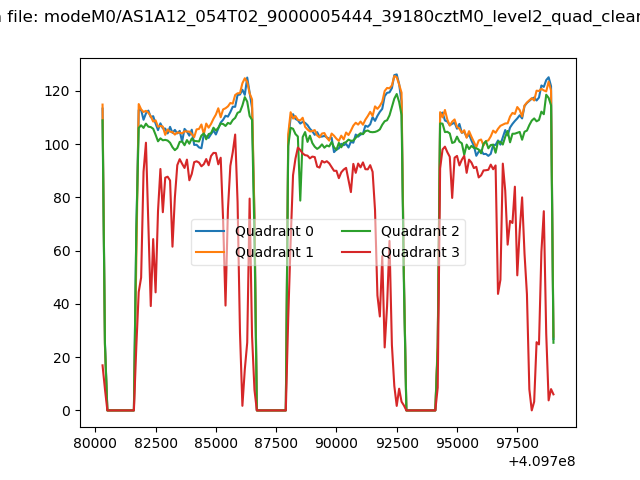 |
|
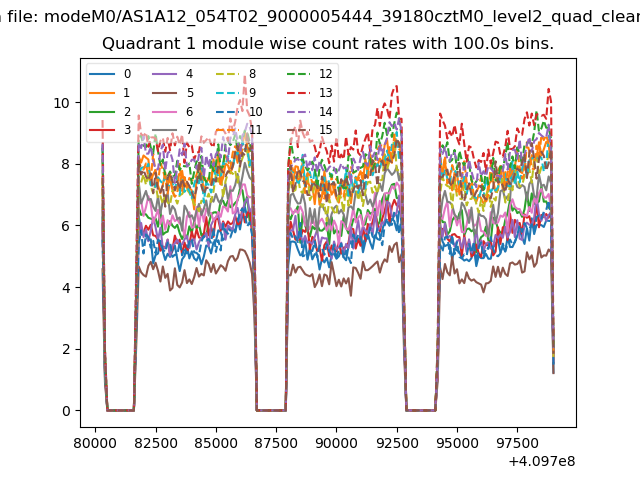
| Module-wise count rates for Quadrant A Data is divided into 100 sec bins |
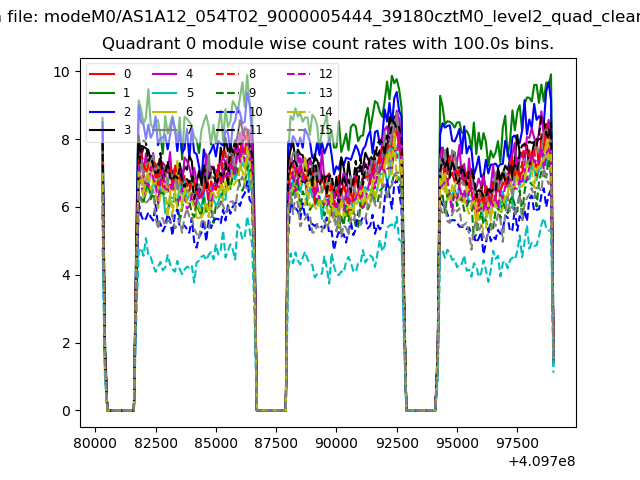 |
 |
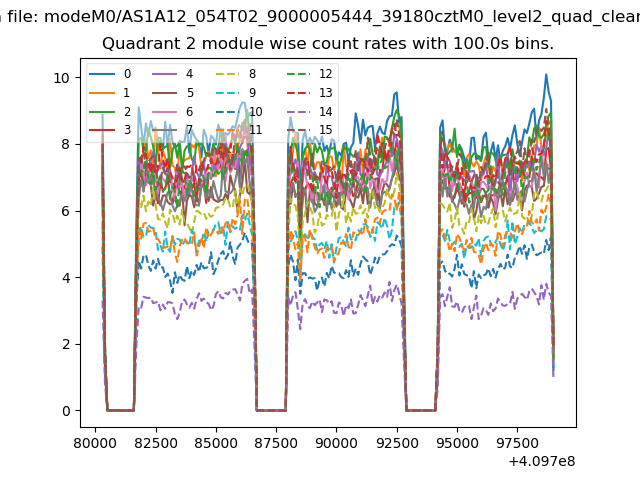
| Module-wise count rates for Quadrant B Data is divided into 100 sec bins |
 |
 |
| Module-wise count rates for Quadrant C Data is divided into 100 sec bins |
 |
 |
| Module-wise count rates for Quadrant D Data is divided into 100 sec bins |
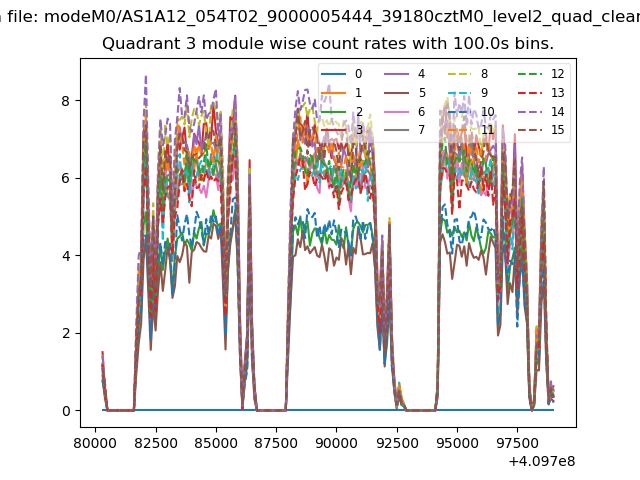 |
 |
| Parameter | Plot |
|---|---|
| CZT HV Monitor | 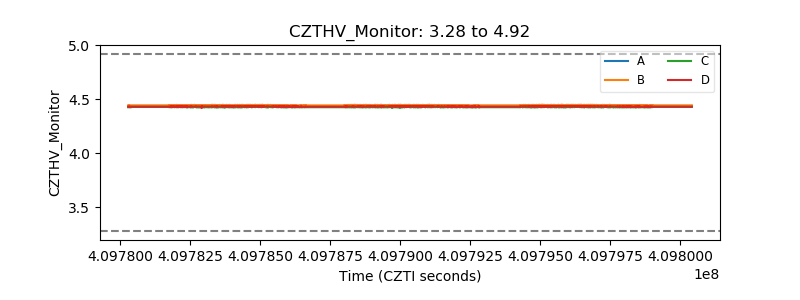 |
| D_VDD | 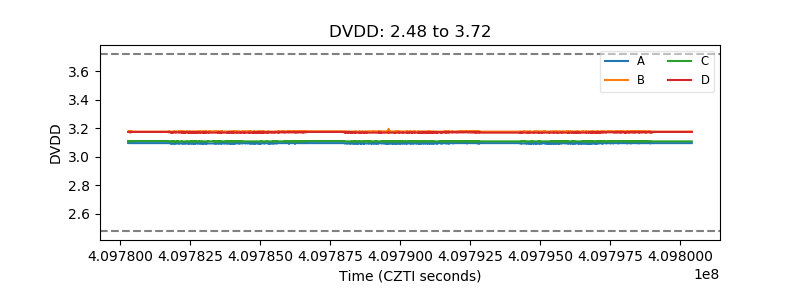 |
| Temperature 1 | 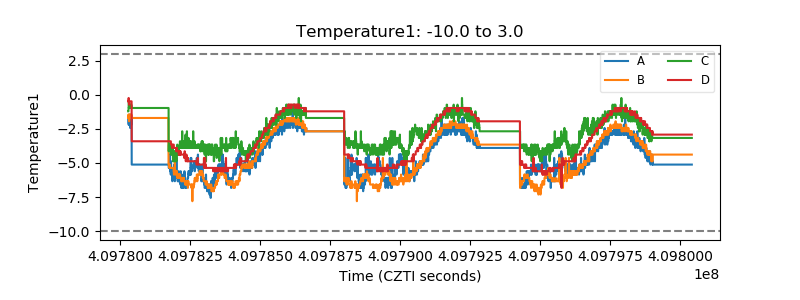 |
| Veto HV Monitor | 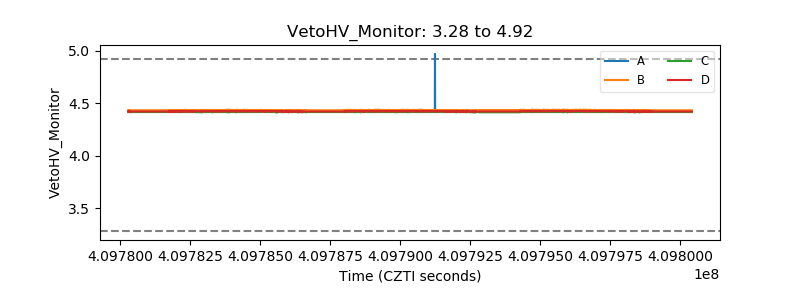 |
| Veto LLD | 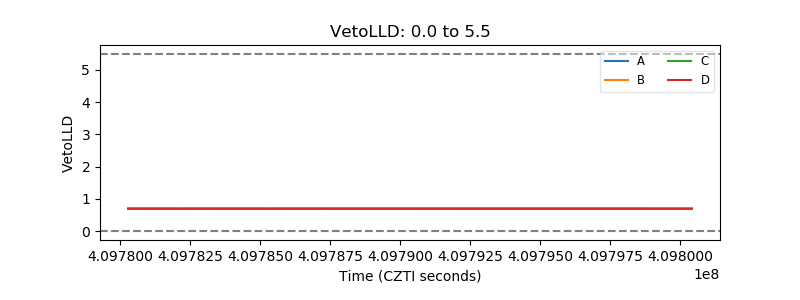 |
| Alpha Counter | 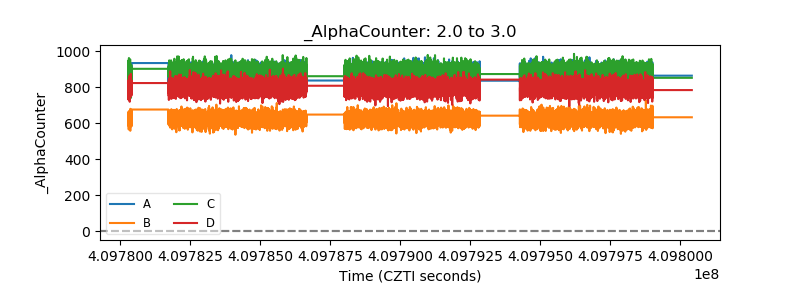 |
| _CPM_Rate | 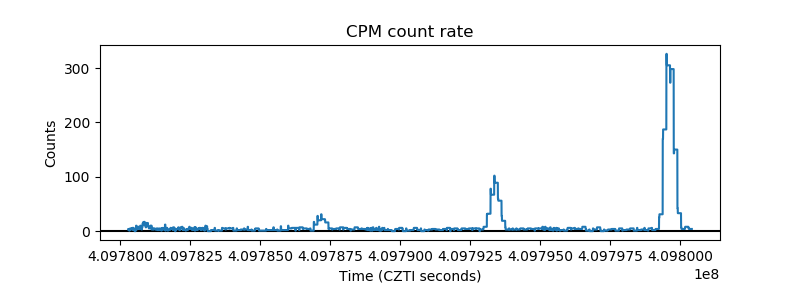 |
| CZT Counter | 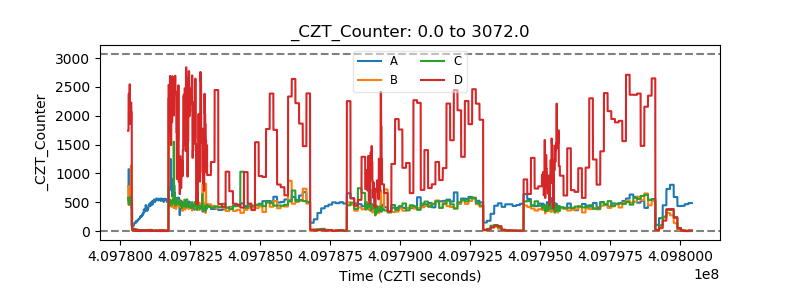 |
| +2.5 Volts monitor | 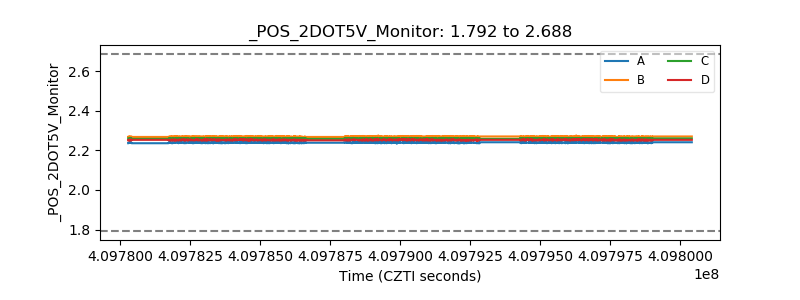 |
| +5 Volts monitor | 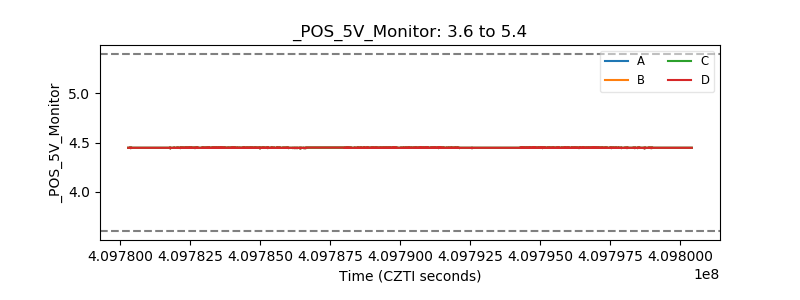 |
| _ROLL_ROT | 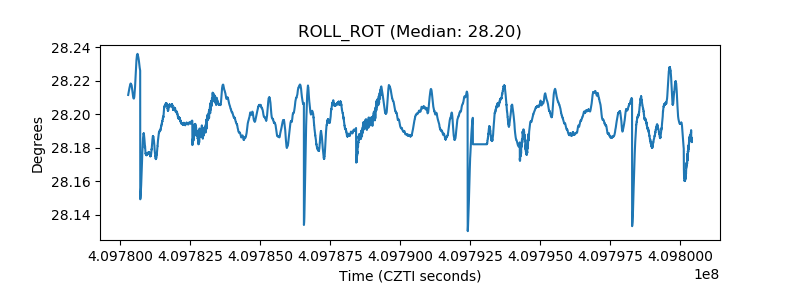 |
| _Roll_DEC | 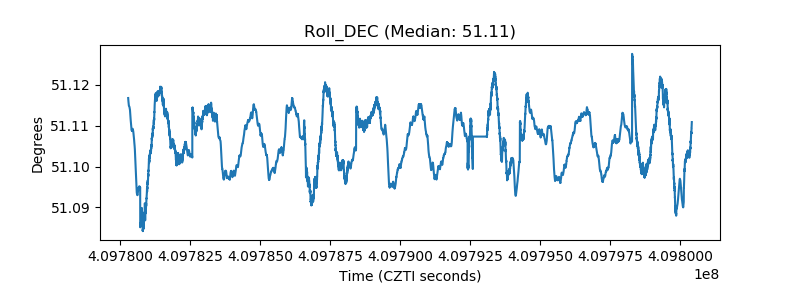 |
| _Roll_RA | 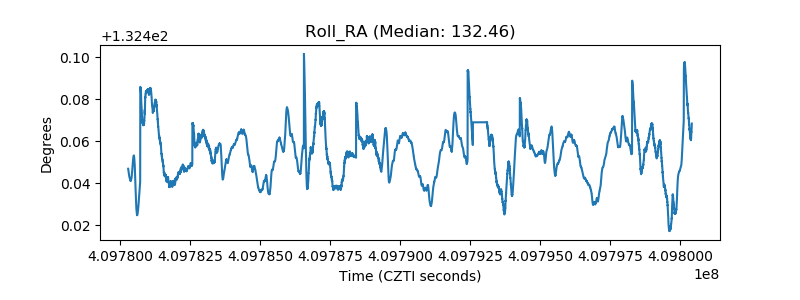 |
| Veto Counter | 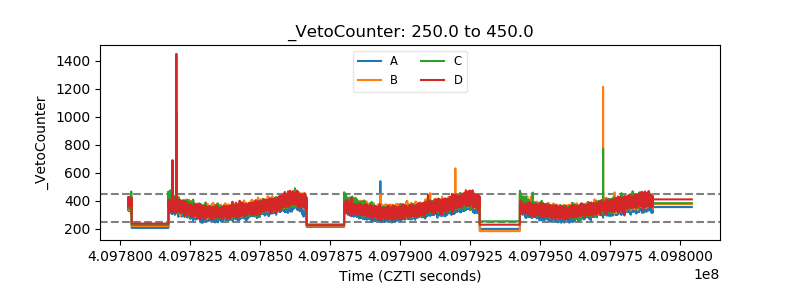 |