| Param | Original file | Final file |
|---|---|---|
| Filename | modeM0/AS1A12_054T02_9000005444_39181cztM0_level2.fits | modeM0/AS1A12_054T02_9000005444_39181cztM0_level2_quad_clean.evt |
| Size (bytes) | 502,387,200 | 91,860,480 |
| Size | 479.1 MB | 87.6 MB |
| Events in quadrant A | 3,015,039 | 669,461 |
| Events in quadrant B | 2,608,433 | 680,594 |
| Events in quadrant C | 2,879,771 | 642,983 |
| Events in quadrant D | 9,630,001 | 372,220 |
| Mode M9 | |||
|---|---|---|---|
| Quadrant | BADHDUFLAG | Total packets | Discarded packets |
| A | 0 | 32 | 0 |
| B | 0 | 32 | 0 |
| C | 0 | 32 | 0 |
| D | 0 | 32 | 0 |
| Mode M0 | |||
|---|---|---|---|
| Quadrant | BADHDUFLAG | Total packets | Discarded packets |
| A | 0 | 12644 | 3 |
| B | 0 | 12071 | 2 |
| C | 0 | 12402 | 2 |
| D | 0 | 32752 | 2 |
| Mode SS | |||
|---|---|---|---|
| Quadrant | BADHDUFLAG | Total packets | Discarded packets |
| A | 0 | 122 | 0 |
| B | 0 | 122 | 0 |
| C | 0 | 122 | 0 |
| D | 0 | 122 | 0 |
| Quadrant | Total seconds | Saturated seconds | Saturation percentage |
|---|---|---|---|
| A | 5958 | 8 | 0.134273% |
| B | 5958 | 15 | 0.251762% |
| C | 5958 | 13 | 0.218194% |
| D | 5958 | 2465 | 41.372944% |
Noise dominated data is calculated using 1-second bins in cleaned event files. If a bin has >2000 counts, and if more than 50% of those come from <1% of pixels, then it is considered to be noise-dominated and hence unusable.
| Quadrant | # 1 sec bins | Bins with >0 counts | Bins with >2000 counts | High rate bins dominated by noise | Noise dominated (total time) | Noise dominated (detector-on time) | Marked lightcurve |
|---|---|---|---|---|---|---|---|
| A | 9153 | 5960 | 6 | 6 | 0.07% | 0.10% | 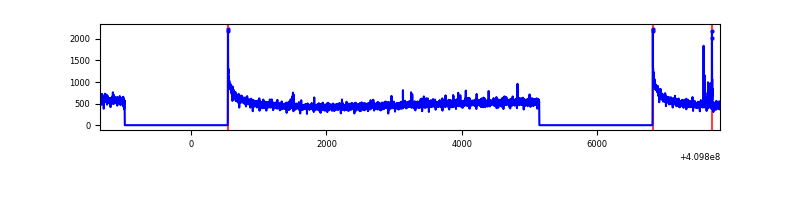 |
| B | 9153 | 5960 | 9 | 9 | 0.10% | 0.15% | 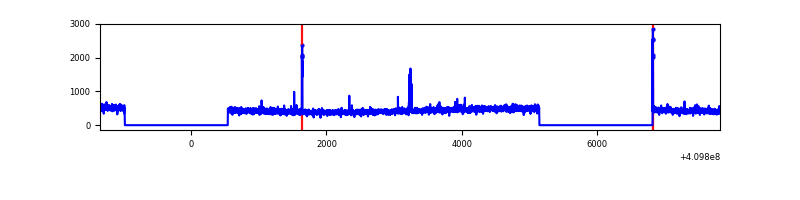 |
| C | 9153 | 5960 | 16 | 16 | 0.17% | 0.27% | 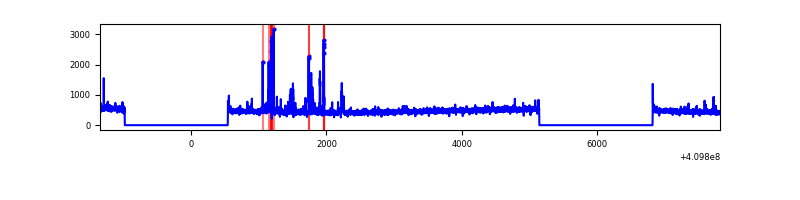 |
| D | 9153 | 5960 | 2056 | 2056 | 22.46% | 34.50% | 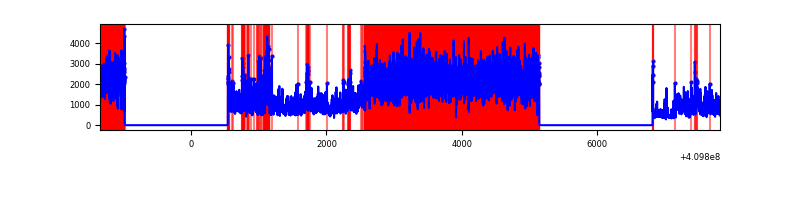 |
Top three noisy pixels from each quadrant. If the there are fewer than three noisy pixels in the level2.evt file, extra rows are filled as -1
| Pixel properties | Quadrant properties | ||||||
|---|---|---|---|---|---|---|---|
| Quadrant | DetID | PixID | Counts | Sigma | Mean | Median | Sigma |
| A | 10 | 83 | 462163 | 3476.71 | 651 | 637 | 132.7 |
| A | 2 | 79 | 28342 | 208.7 | 651 | 637 | 132.7 |
| A | 13 | 254 | 8021 | 55.62 | 651 | 637 | 132.7 |
| B | 5 | 184 | 32160 | 254.25 | 645 | 629 | 124.0 |
| B | 0 | 156 | 18499 | 144.09 | 645 | 629 | 124.0 |
| B | 12 | 111 | 15797 | 122.3 | 645 | 629 | 124.0 |
| C | 15 | 214 | 250376 | 1701.5 | 629 | 631 | 146.8 |
| C | 9 | 187 | 157296 | 1067.35 | 629 | 631 | 146.8 |
| C | 15 | 208 | 15013 | 97.98 | 629 | 631 | 146.8 |
| D | 12 | 235 | 6953515 | 52646.95 | 539 | 523 | 132.1 |
| D | 12 | 233 | 166029 | 1253.19 | 539 | 523 | 132.1 |
| D | 2 | 249 | 142404 | 1074.3 | 539 | 523 | 132.1 |
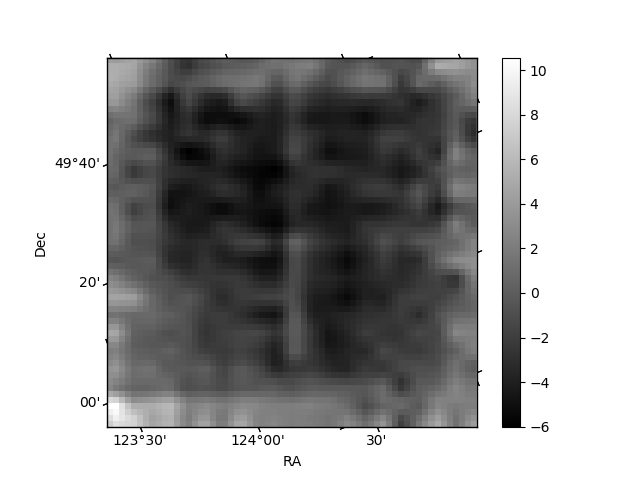
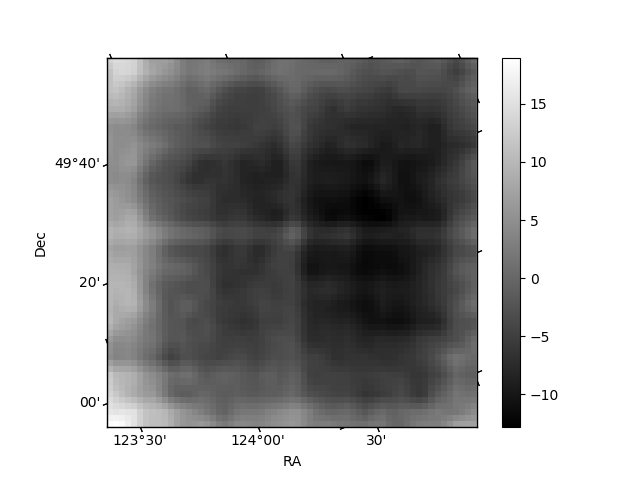
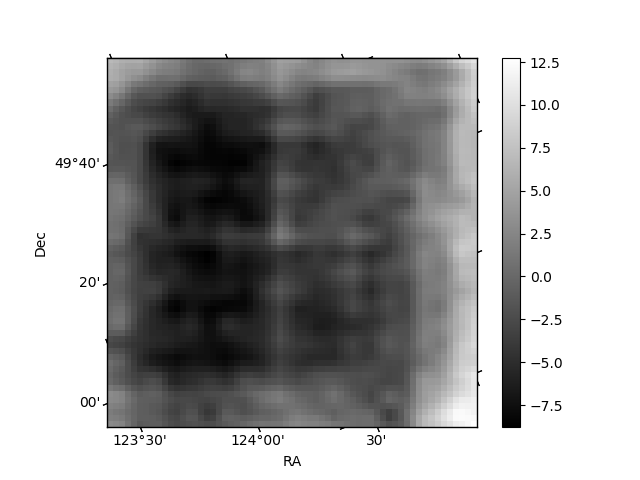
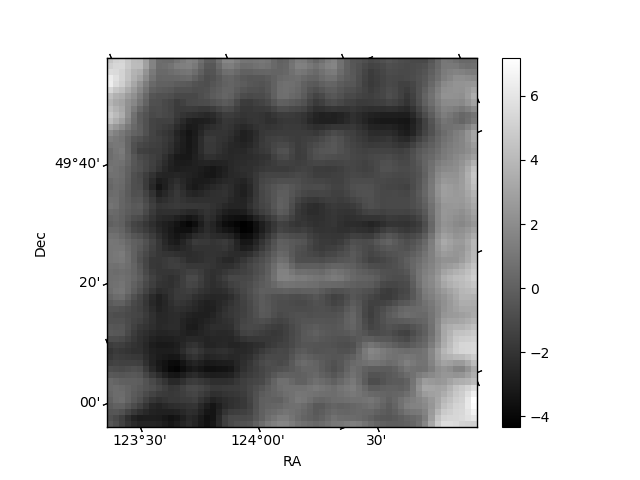
Histogram calculated using DETX and DETY for each event in the final _common_clean file
| Quadrant A | 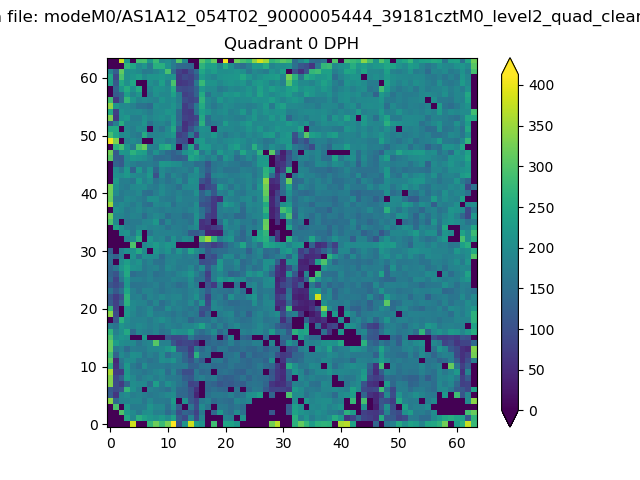 |
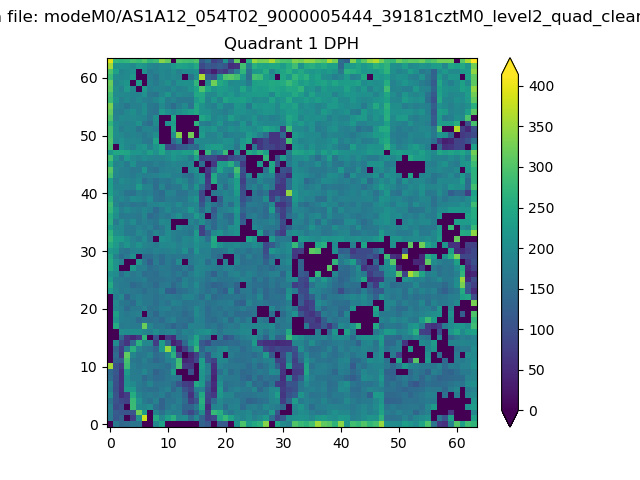 |
Quadrant B |
|---|---|---|---|
| Quadrant D |  |
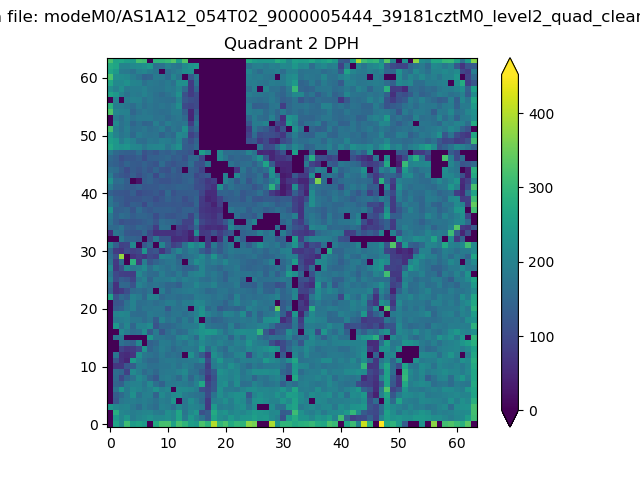 |
Quadrant C |
| Plot type | Count rate plots | Images |
|---|---|---|
| Comparison with Poisson distribution Blue bars denote a histogram of data divided into 1 sec bins. Red curve is a Poisson curve with rate = median count rate of data. |
 |
 |
| Quadrant-wise count rates Data is divided into 100 sec bins |
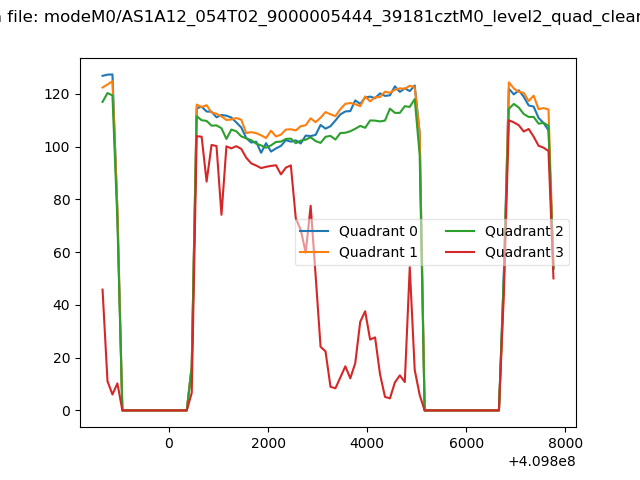 |
|
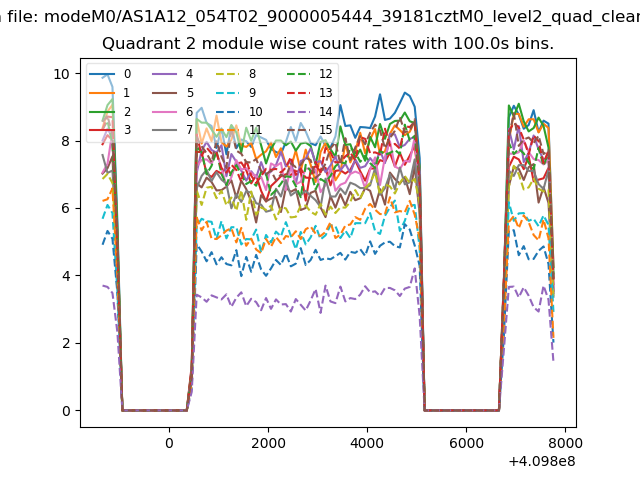
| Module-wise count rates for Quadrant A Data is divided into 100 sec bins |
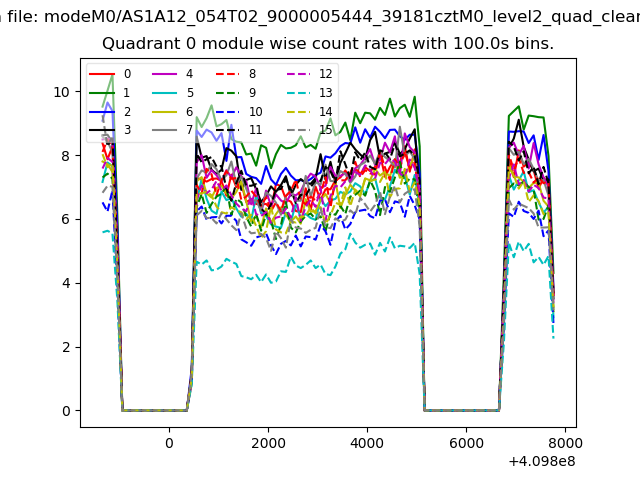 |
 |
| Module-wise count rates for Quadrant B Data is divided into 100 sec bins |
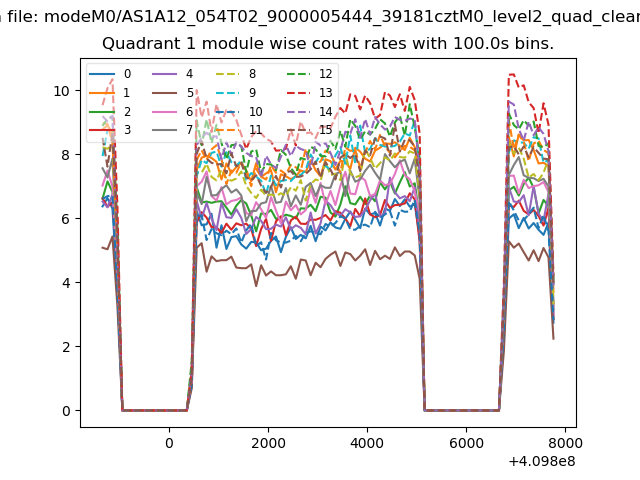 |
 |
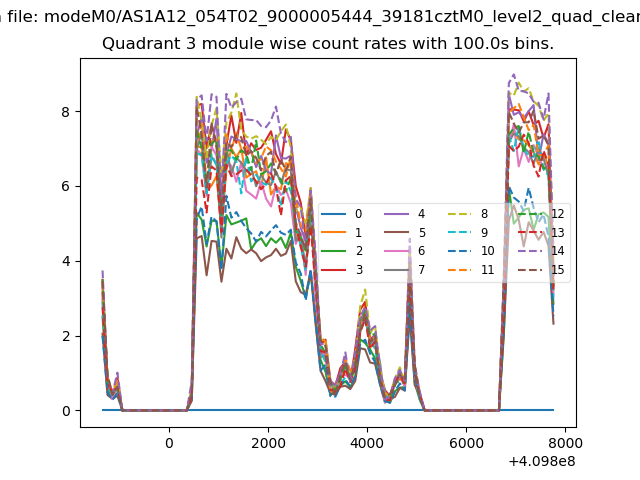
| Module-wise count rates for Quadrant C Data is divided into 100 sec bins |
 |
 |
| Module-wise count rates for Quadrant D Data is divided into 100 sec bins |
 |
 |
| Parameter | Plot |
|---|---|
| CZT HV Monitor | 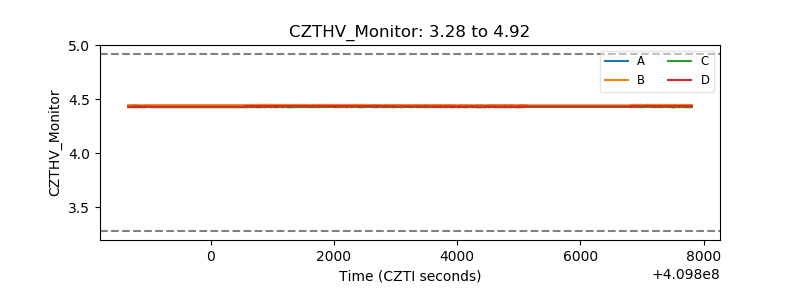 |
| D_VDD | 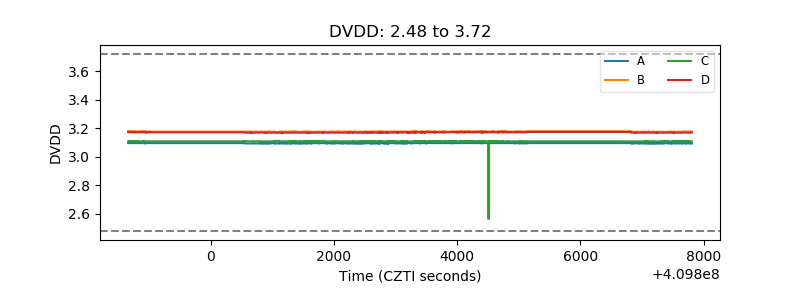 |
| Temperature 1 | 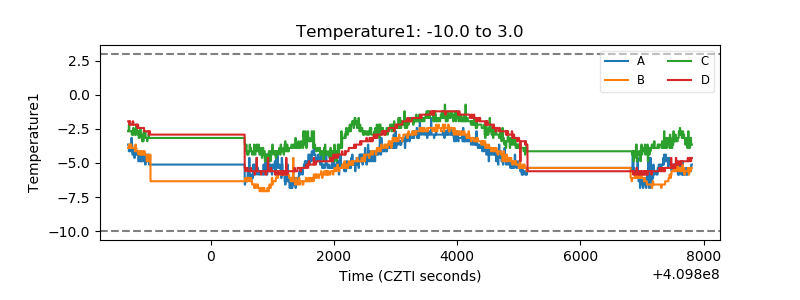 |
| Veto HV Monitor |  |
| Veto LLD | 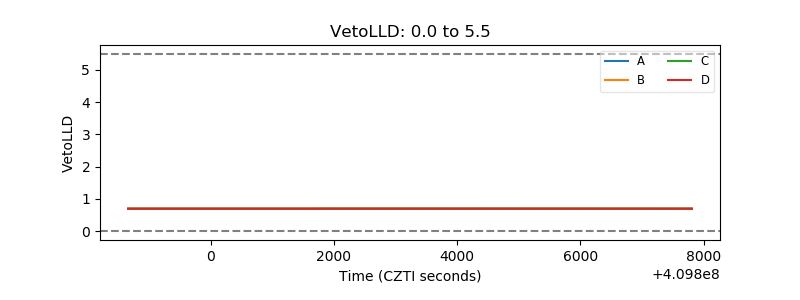 |
| Alpha Counter | 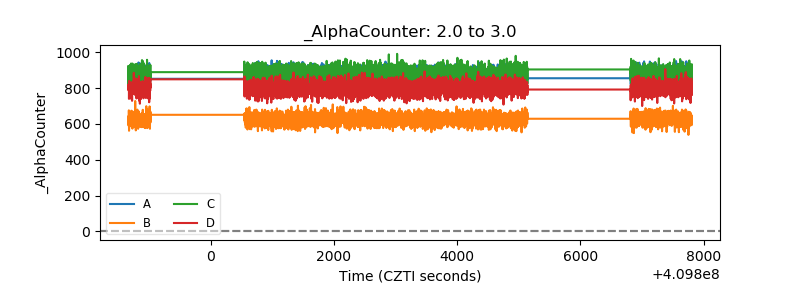 |
| _CPM_Rate | 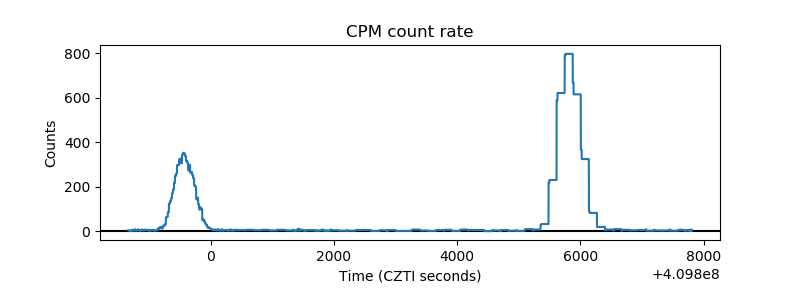 |
| CZT Counter | 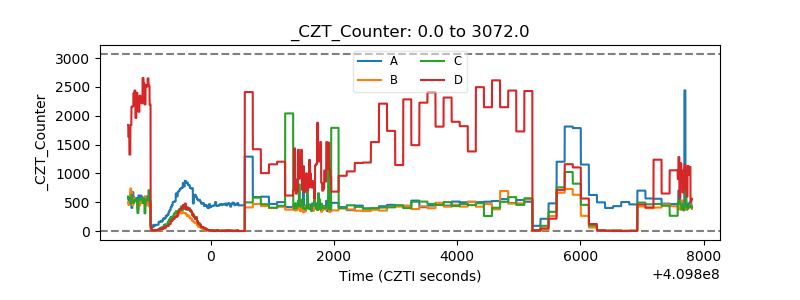 |
| +2.5 Volts monitor | 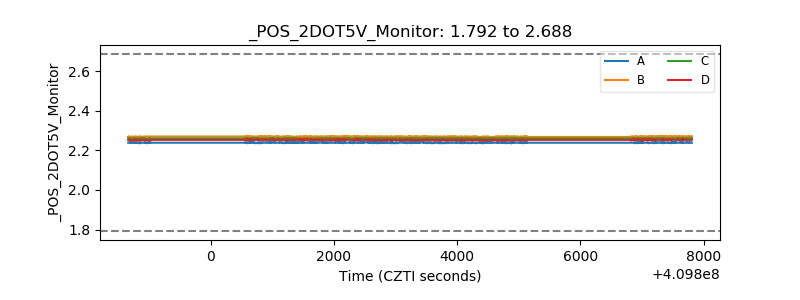 |
| +5 Volts monitor | 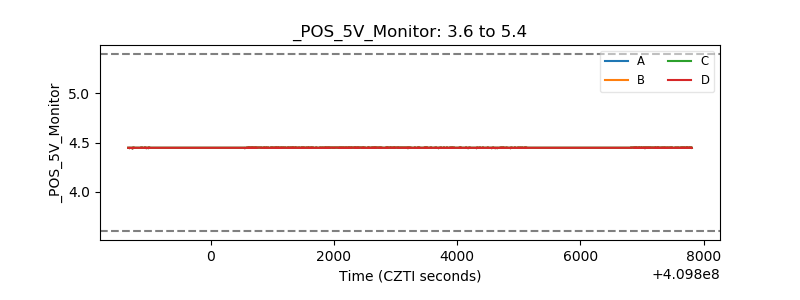 |
| _ROLL_ROT | 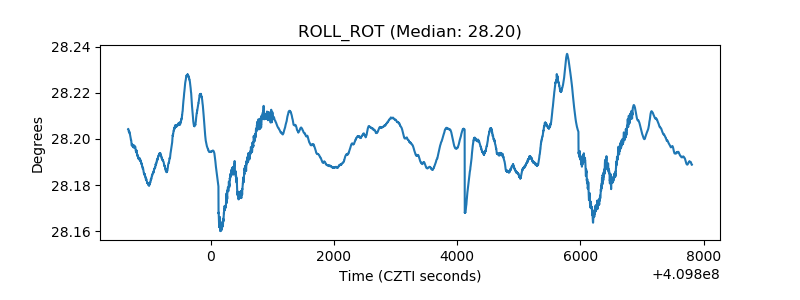 |
| _Roll_DEC | 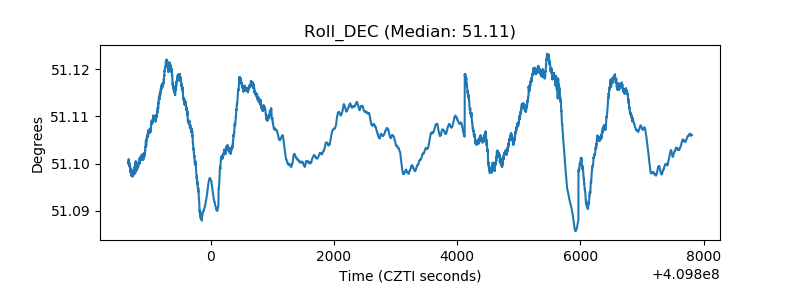 |
| _Roll_RA | 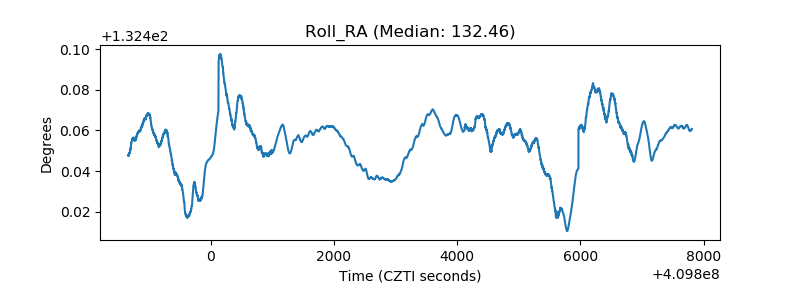 |
| Veto Counter | 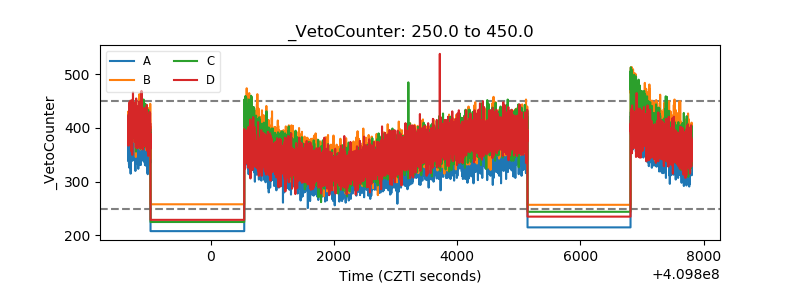 |