| Param | Original file | Final file |
|---|---|---|
| Filename | modeM0/AS1A12_054T02_9000005444_39183cztM0_level2.fits | modeM0/AS1A12_054T02_9000005444_39183cztM0_level2_quad_clean.evt |
| Size (bytes) | 455,371,200 | 82,471,680 |
| Size | 434.3 MB | 78.7 MB |
| Events in quadrant A | 2,723,479 | 610,929 |
| Events in quadrant B | 2,437,729 | 620,563 |
| Events in quadrant C | 2,478,831 | 580,863 |
| Events in quadrant D | 8,807,782 | 317,654 |
| Mode M9 | |||
|---|---|---|---|
| Quadrant | BADHDUFLAG | Total packets | Discarded packets |
| A | 0 | 25 | 0 |
| B | 0 | 25 | 0 |
| C | 0 | 25 | 1 |
| D | 0 | 26 | 0 |
| Mode M0 | |||
|---|---|---|---|
| Quadrant | BADHDUFLAG | Total packets | Discarded packets |
| A | 0 | 11330 | 90 |
| B | 0 | 11035 | 101 |
| C | 0 | 10810 | 98 |
| D | 0 | 30323 | 575 |
| Mode SS | |||
|---|---|---|---|
| Quadrant | BADHDUFLAG | Total packets | Discarded packets |
| A | 0 | 106 | 0 |
| B | 0 | 106 | 0 |
| C | 0 | 106 | 0 |
| D | 0 | 106 | 0 |
| Quadrant | Total seconds | Saturated seconds | Saturation percentage |
|---|---|---|---|
| A | 5263 | 6 | 0.114003% |
| B | 5265 | 25 | 0.474834% |
| C | 5249 | 7 | 0.133359% |
| D | 5203 | 2301 | 44.224486% |
Noise dominated data is calculated using 1-second bins in cleaned event files. If a bin has >2000 counts, and if more than 50% of those come from <1% of pixels, then it is considered to be noise-dominated and hence unusable.
| Quadrant | # 1 sec bins | Bins with >0 counts | Bins with >2000 counts | High rate bins dominated by noise | Noise dominated (total time) | Noise dominated (detector-on time) | Marked lightcurve |
|---|---|---|---|---|---|---|---|
| A | 7082 | 5304 | 6 | 6 | 0.08% | 0.11% | 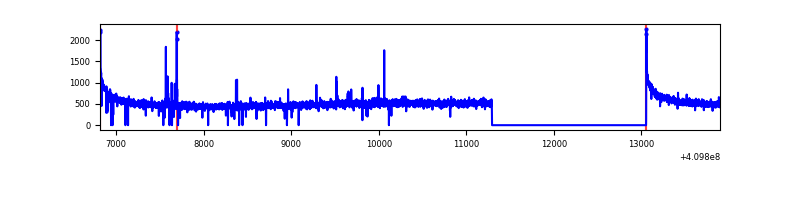 |
| B | 7082 | 5302 | 19 | 19 | 0.27% | 0.36% | 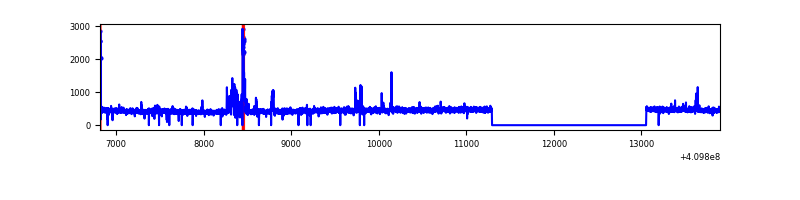 |
| C | 7082 | 5295 | 4 | 4 | 0.06% | 0.08% | 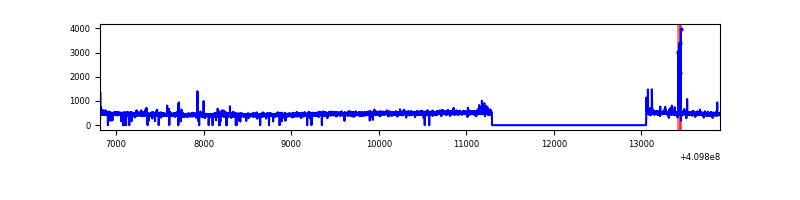 |
| D | 7082 | 5291 | 1928 | 1928 | 27.22% | 36.44% | 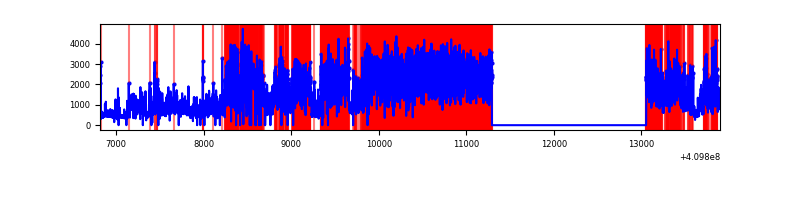 |
Top three noisy pixels from each quadrant. If the there are fewer than three noisy pixels in the level2.evt file, extra rows are filled as -1
| Pixel properties | Quadrant properties | ||||||
|---|---|---|---|---|---|---|---|
| Quadrant | DetID | PixID | Counts | Sigma | Mean | Median | Sigma |
| A | 10 | 83 | 420449 | 3519.99 | 587 | 574 | 119.3 |
| A | 2 | 79 | 34173 | 281.67 | 587 | 574 | 119.3 |
| A | 13 | 254 | 7189 | 55.46 | 587 | 574 | 119.3 |
| B | 5 | 184 | 135325 | 1209.75 | 578 | 562 | 111.4 |
| B | 12 | 111 | 13961 | 120.28 | 578 | 562 | 111.4 |
| B | 11 | 111 | 12797 | 109.83 | 578 | 562 | 111.4 |
| C | 15 | 214 | 220375 | 1680.0 | 560 | 564 | 130.8 |
| C | 9 | 187 | 67802 | 513.9 | 560 | 564 | 130.8 |
| C | 0 | 10 | 4801 | 32.38 | 560 | 564 | 130.8 |
| D | 12 | 235 | 6143329 | 56155.27 | 453 | 440 | 109.4 |
| D | 2 | 249 | 802770 | 7334.51 | 453 | 440 | 109.4 |
| D | 5 | 222 | 32907 | 296.8 | 453 | 440 | 109.4 |
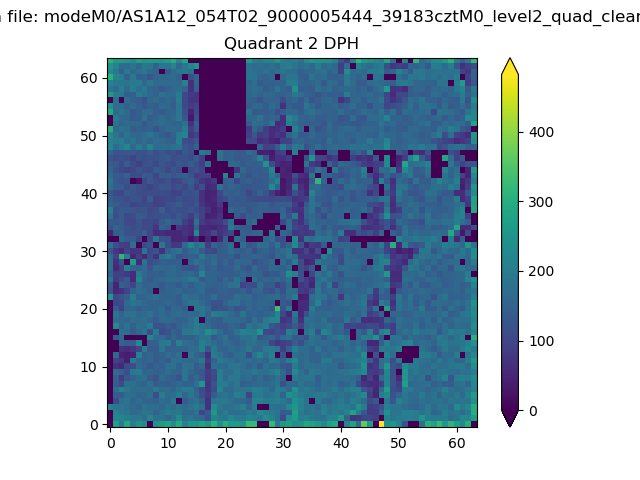
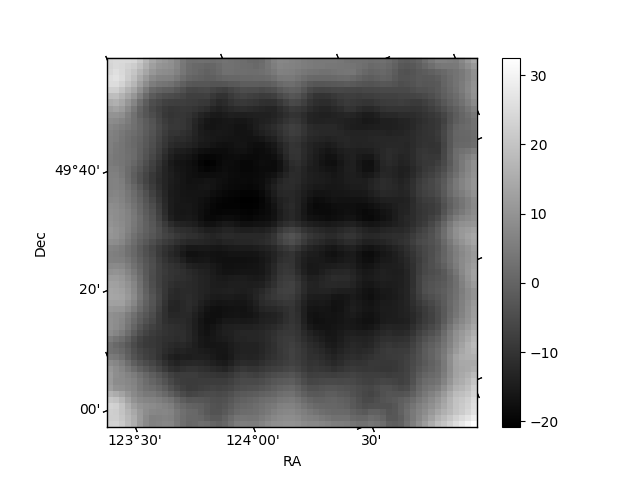
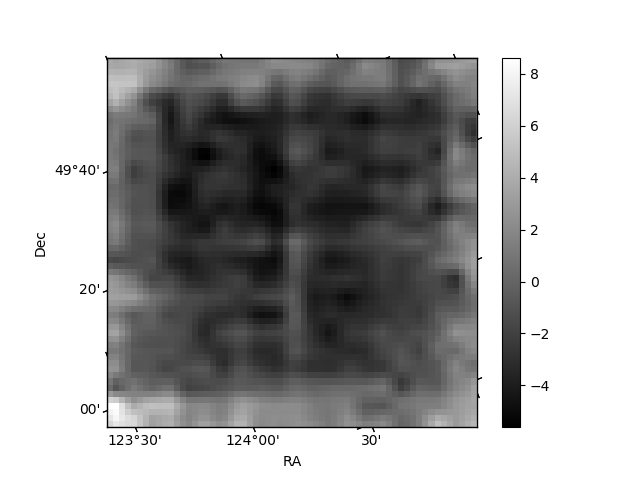
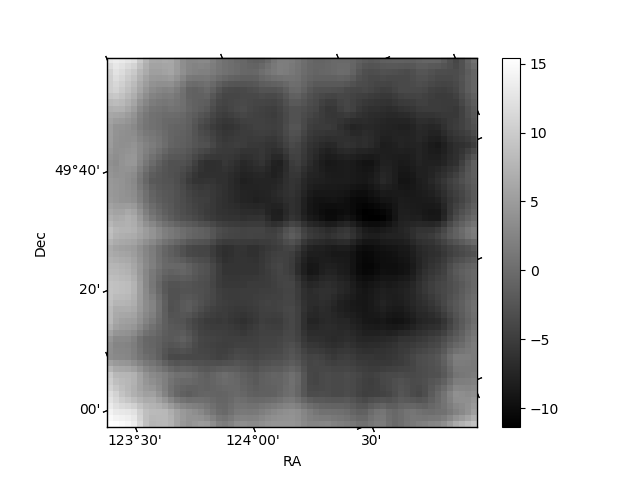
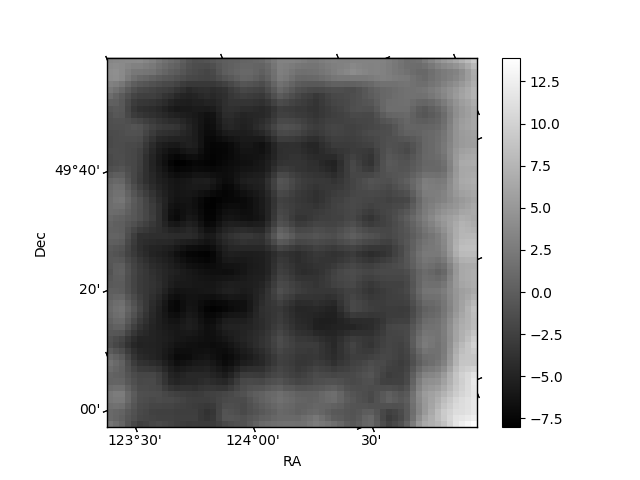
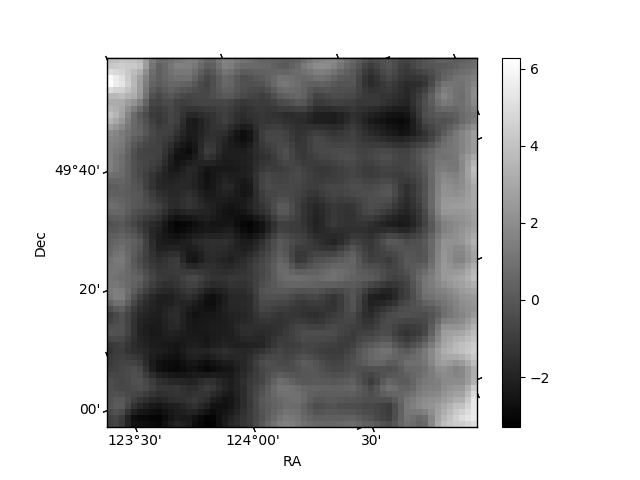
Histogram calculated using DETX and DETY for each event in the final _common_clean file
| Quadrant A | 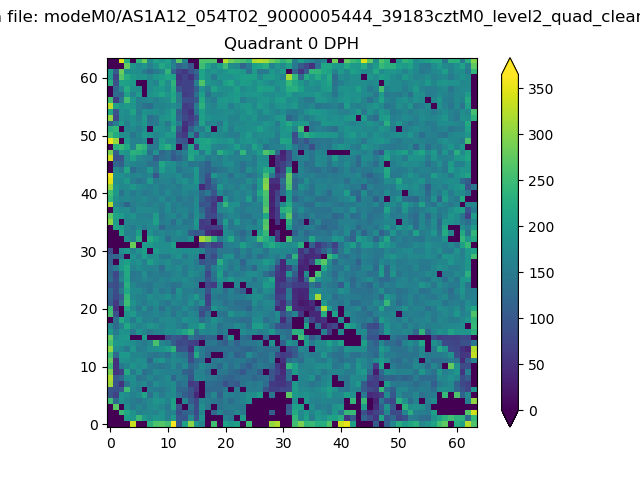 |
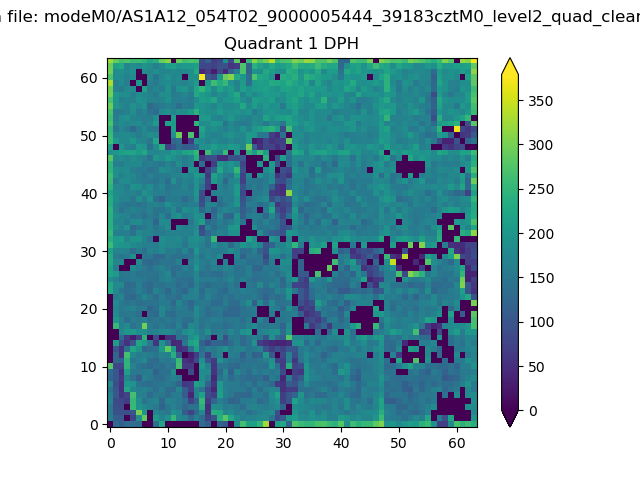 |
Quadrant B |
|---|---|---|---|
| Quadrant D | 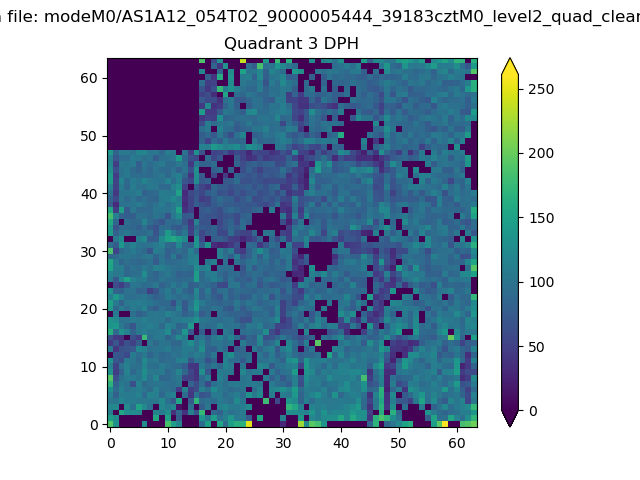 |
 |
Quadrant C |
| Plot type | Count rate plots | Images |
|---|---|---|
| Comparison with Poisson distribution Blue bars denote a histogram of data divided into 1 sec bins. Red curve is a Poisson curve with rate = median count rate of data. |
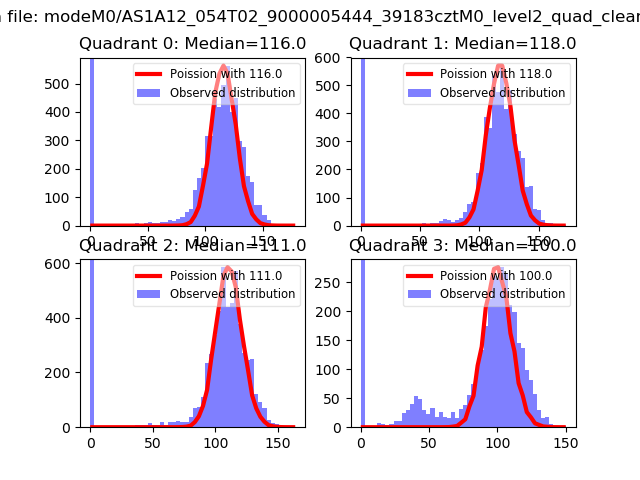 |
 |
| Quadrant-wise count rates Data is divided into 100 sec bins |
 |
|
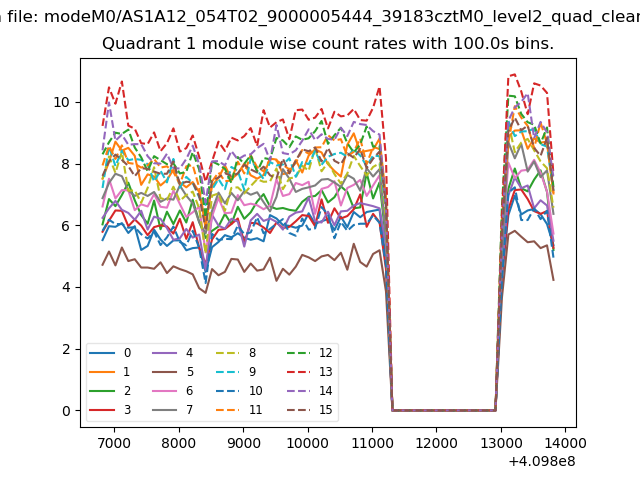
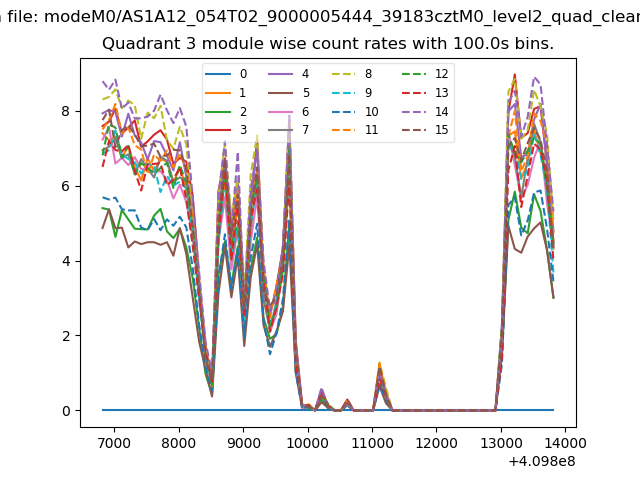
| Module-wise count rates for Quadrant A Data is divided into 100 sec bins |
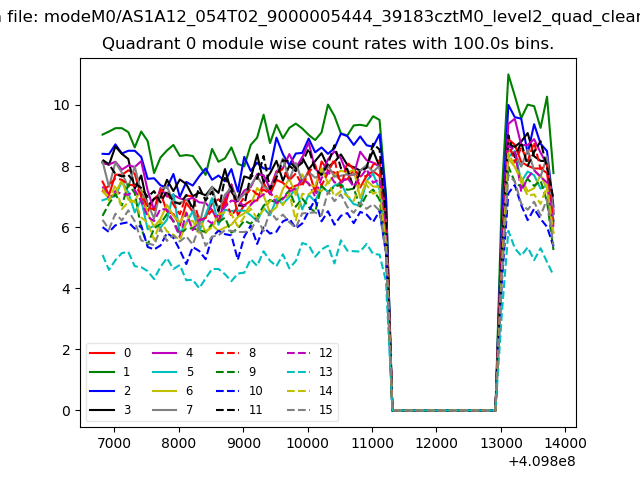 |
 |
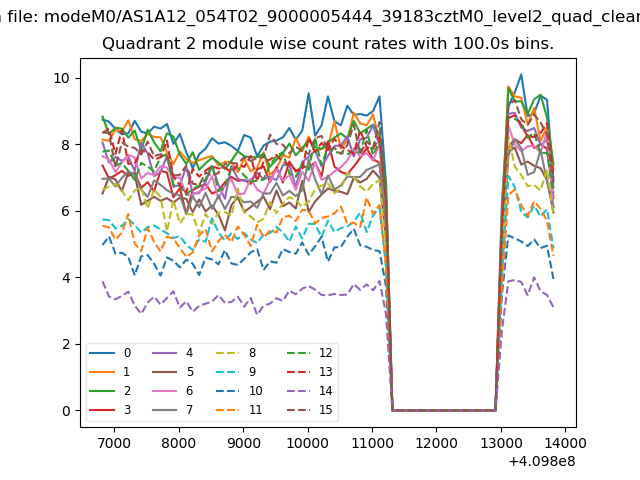
| Module-wise count rates for Quadrant B Data is divided into 100 sec bins |
 |
 |
| Module-wise count rates for Quadrant C Data is divided into 100 sec bins |
 |
 |
| Module-wise count rates for Quadrant D Data is divided into 100 sec bins |
 |
 |
| Parameter | Plot |
|---|---|
| CZT HV Monitor | 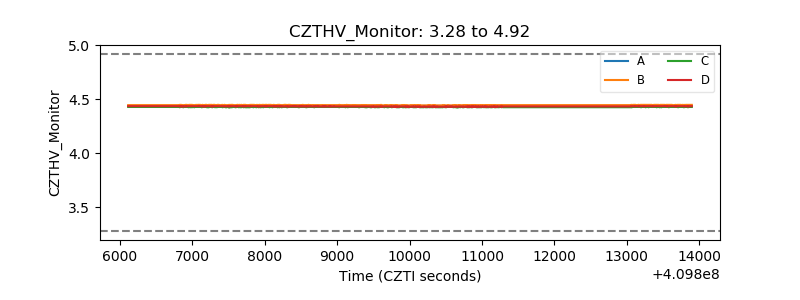 |
| D_VDD | 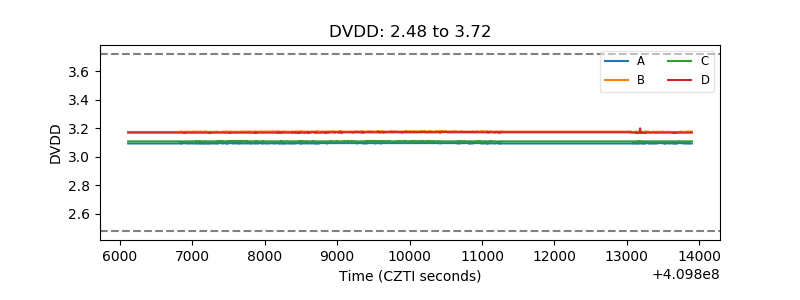 |
| Temperature 1 | 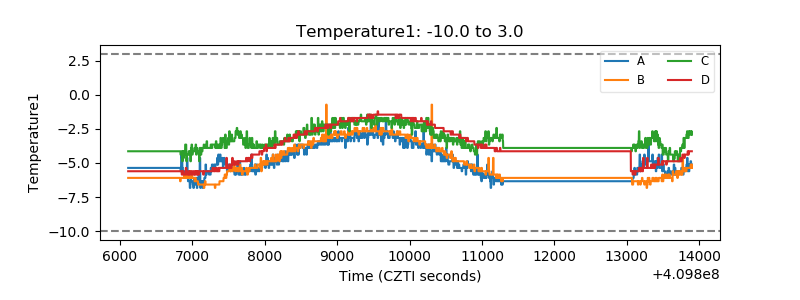 |
| Veto HV Monitor | 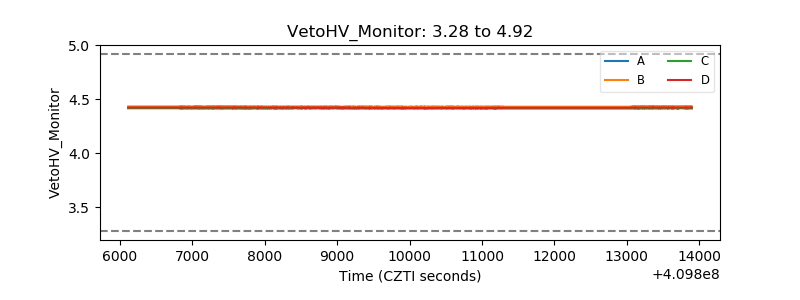 |
| Veto LLD | 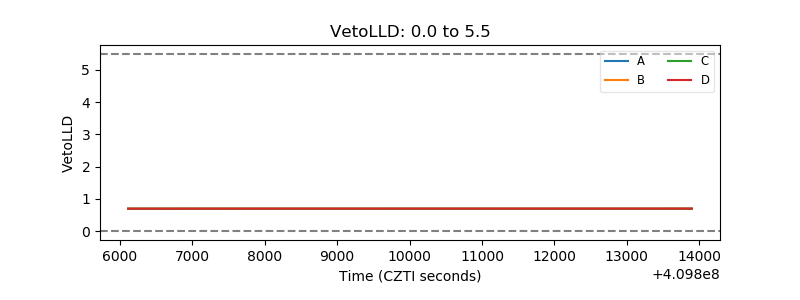 |
| Alpha Counter | 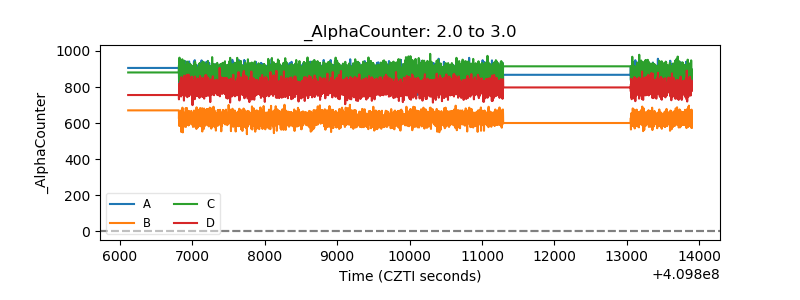 |
| _CPM_Rate | 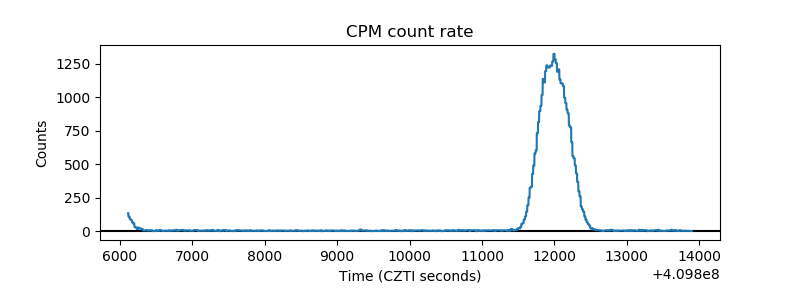 |
| CZT Counter | 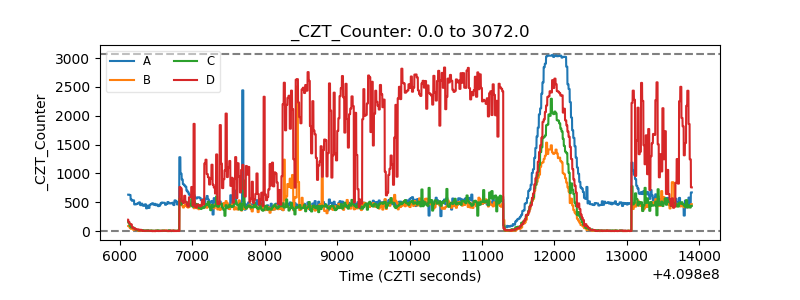 |
| +2.5 Volts monitor |  |
| +5 Volts monitor | 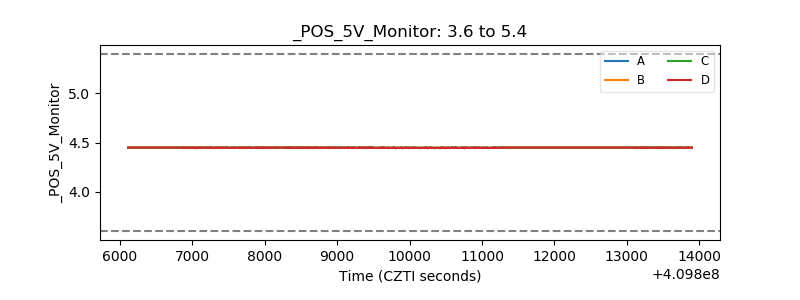 |
| _ROLL_ROT | 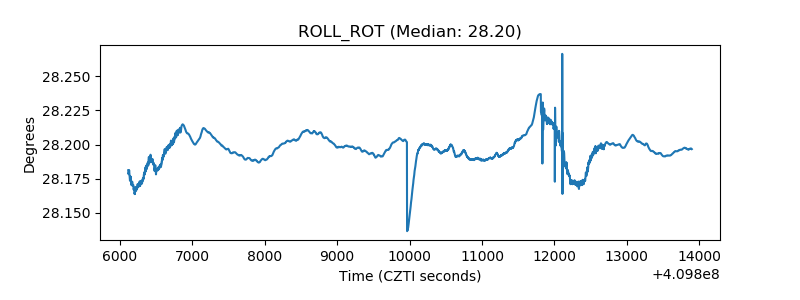 |
| _Roll_DEC | 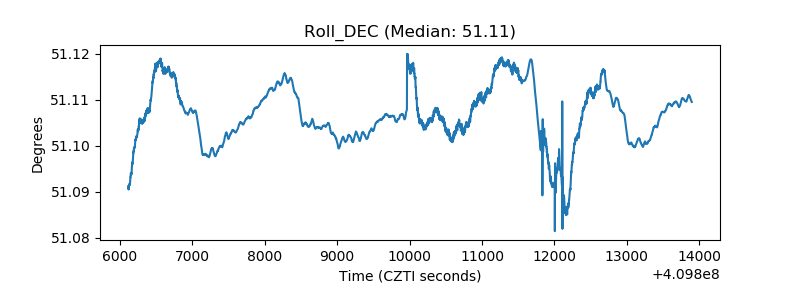 |
| _Roll_RA | 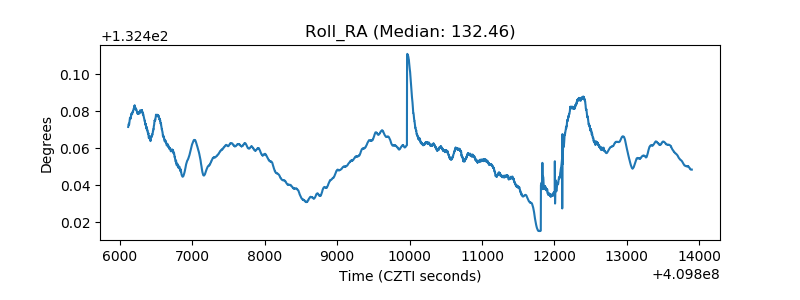 |
| Veto Counter | 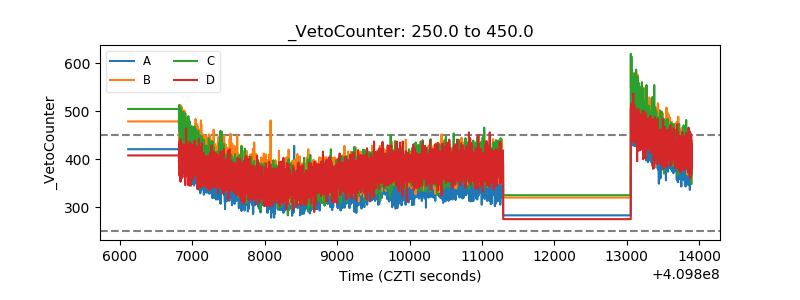 |