| Param | Original file | Final file |
|---|---|---|
| Filename | modeM0/AS1A12_054T02_9000005444_39184cztM0_level2.fits | modeM0/AS1A12_054T02_9000005444_39184cztM0_level2_quad_clean.evt |
| Size (bytes) | 503,101,440 | 84,934,080 |
| Size | 479.8 MB | 81.0 MB |
| Events in quadrant A | 2,805,372 | 646,007 |
| Events in quadrant B | 2,393,502 | 652,812 |
| Events in quadrant C | 2,582,666 | 604,621 |
| Events in quadrant D | 10,434,080 | 302,254 |
| Mode M9 | |||
|---|---|---|---|
| Quadrant | BADHDUFLAG | Total packets | Discarded packets |
| A | 0 | 31 | 0 |
| B | 0 | 31 | 0 |
| C | 0 | 31 | 0 |
| D | 0 | 32 | 0 |
| Mode M0 | |||
|---|---|---|---|
| Quadrant | BADHDUFLAG | Total packets | Discarded packets |
| A | 0 | 11361 | 3 |
| B | 0 | 10605 | 2 |
| C | 0 | 10849 | 2 |
| D | 0 | 34597 | 2 |
| Mode SS | |||
|---|---|---|---|
| Quadrant | BADHDUFLAG | Total packets | Discarded packets |
| A | 0 | 104 | 0 |
| B | 0 | 104 | 0 |
| C | 0 | 104 | 0 |
| D | 0 | 104 | 0 |
| Quadrant | Total seconds | Saturated seconds | Saturation percentage |
|---|---|---|---|
| A | 5235 | 8 | 0.152818% |
| B | 5235 | 4 | 0.076409% |
| C | 5235 | 9 | 0.171920% |
| D | 5235 | 2878 | 54.976122% |
Noise dominated data is calculated using 1-second bins in cleaned event files. If a bin has >2000 counts, and if more than 50% of those come from <1% of pixels, then it is considered to be noise-dominated and hence unusable.
| Quadrant | # 1 sec bins | Bins with >0 counts | Bins with >2000 counts | High rate bins dominated by noise | Noise dominated (total time) | Noise dominated (detector-on time) | Marked lightcurve |
|---|---|---|---|---|---|---|---|
| A | 7148 | 5236 | 4 | 4 | 0.06% | 0.08% | 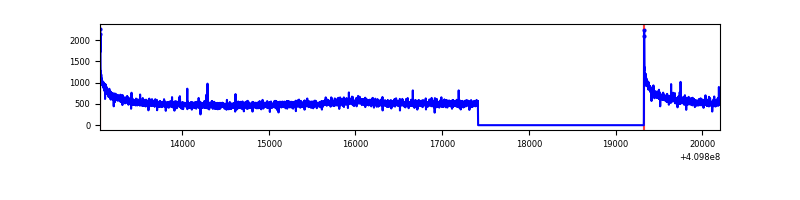 |
| B | 7148 | 5236 | 1 | 1 | 0.01% | 0.02% | 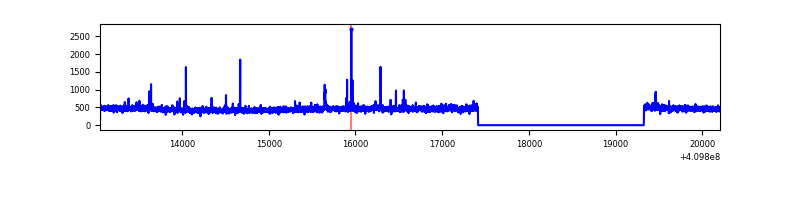 |
| C | 7148 | 5236 | 6 | 6 | 0.08% | 0.11% | 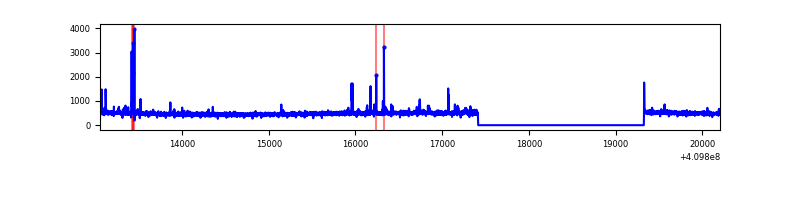 |
| D | 7148 | 5236 | 2481 | 2481 | 34.71% | 47.38% | 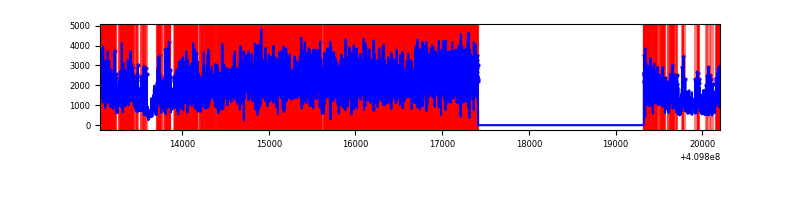 |
Top three noisy pixels from each quadrant. If the there are fewer than three noisy pixels in the level2.evt file, extra rows are filled as -1
| Pixel properties | Quadrant properties | ||||||
|---|---|---|---|---|---|---|---|
| Quadrant | DetID | PixID | Counts | Sigma | Mean | Median | Sigma |
| A | 10 | 83 | 419511 | 3418.27 | 607 | 597 | 122.6 |
| A | 13 | 6 | 24305 | 193.45 | 607 | 597 | 122.6 |
| A | 2 | 79 | 16120 | 126.67 | 607 | 597 | 122.6 |
| B | 15 | 85 | 19659 | 168.01 | 595 | 580 | 113.6 |
| B | 12 | 111 | 14171 | 119.68 | 595 | 580 | 113.6 |
| B | 5 | 184 | 12965 | 109.06 | 595 | 580 | 113.6 |
| C | 15 | 214 | 223503 | 1671.04 | 576 | 580 | 133.4 |
| C | 9 | 187 | 101788 | 758.66 | 576 | 580 | 133.4 |
| C | 0 | 10 | 7890 | 54.8 | 576 | 580 | 133.4 |
| D | 12 | 235 | 7986849 | 69473.02 | 471 | 458 | 115.0 |
| D | 2 | 249 | 329913 | 2865.9 | 471 | 458 | 115.0 |
| D | 12 | 227 | 161755 | 1403.11 | 471 | 458 | 115.0 |
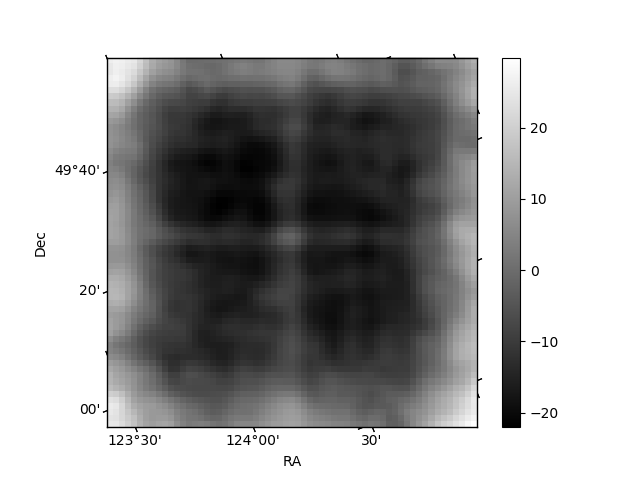
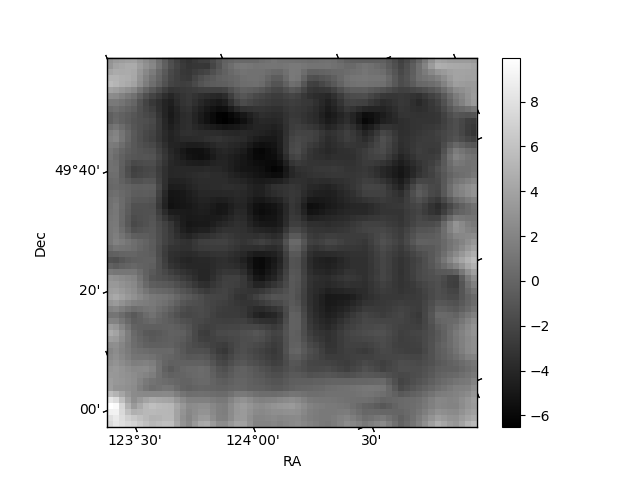
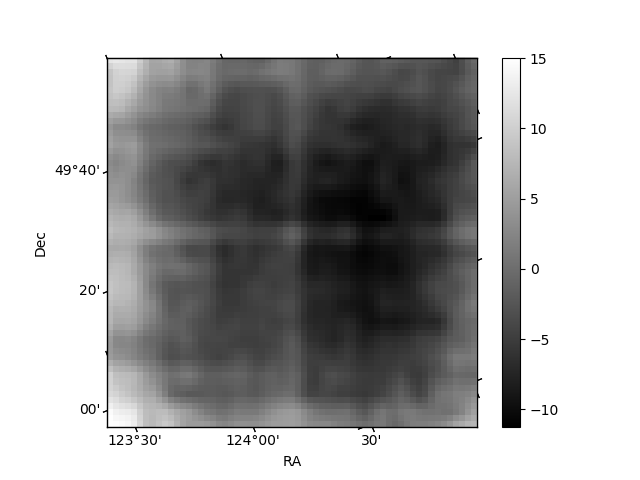
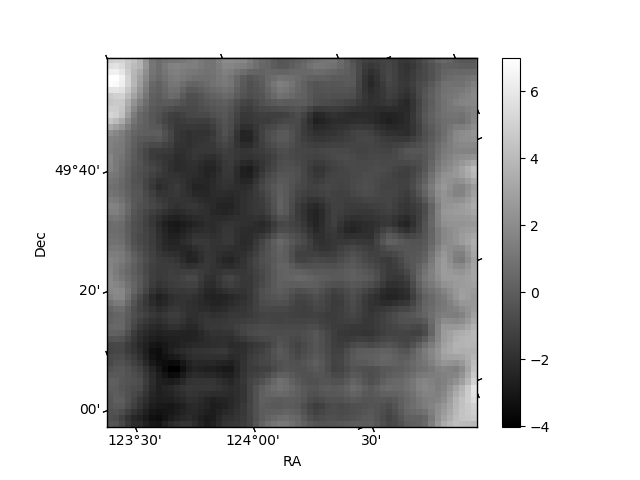
Histogram calculated using DETX and DETY for each event in the final _common_clean file
| Quadrant A | 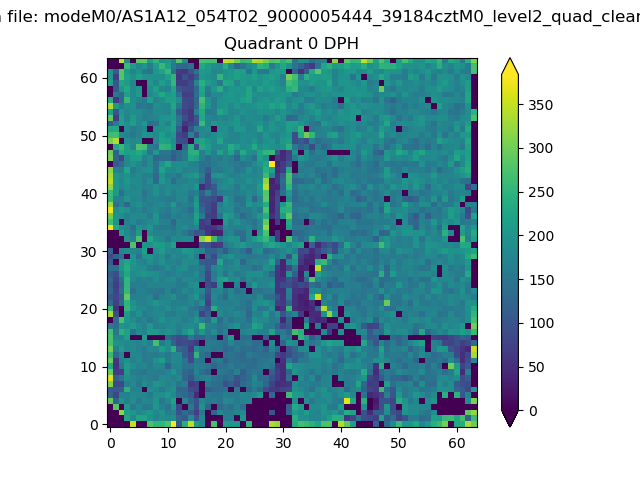 |
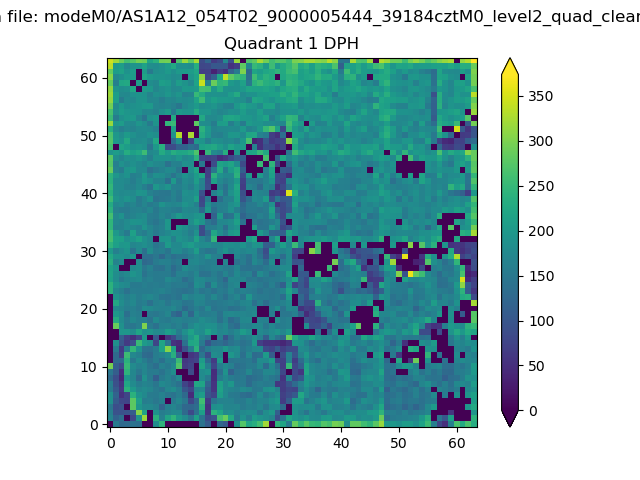 |
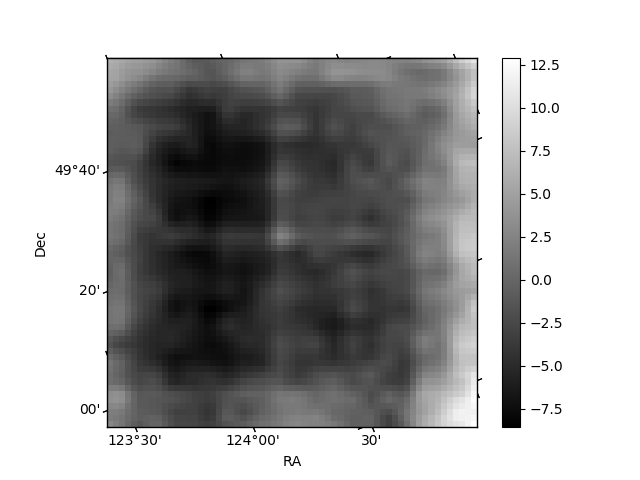
Quadrant B |
|---|---|---|---|
| Quadrant D |  |
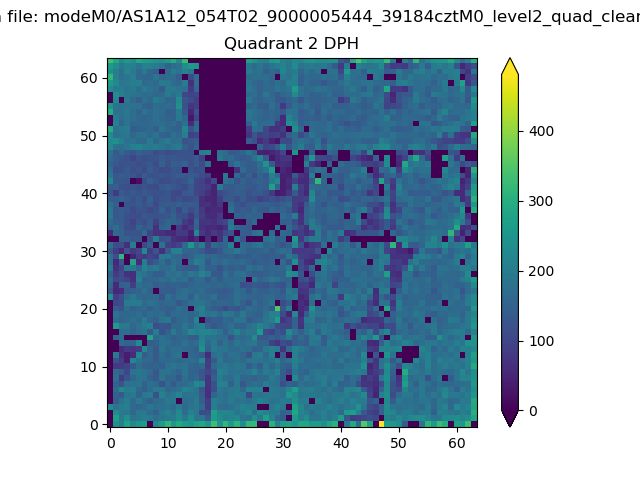 |
Quadrant C |
| Plot type | Count rate plots | Images |
|---|---|---|
| Comparison with Poisson distribution Blue bars denote a histogram of data divided into 1 sec bins. Red curve is a Poisson curve with rate = median count rate of data. |
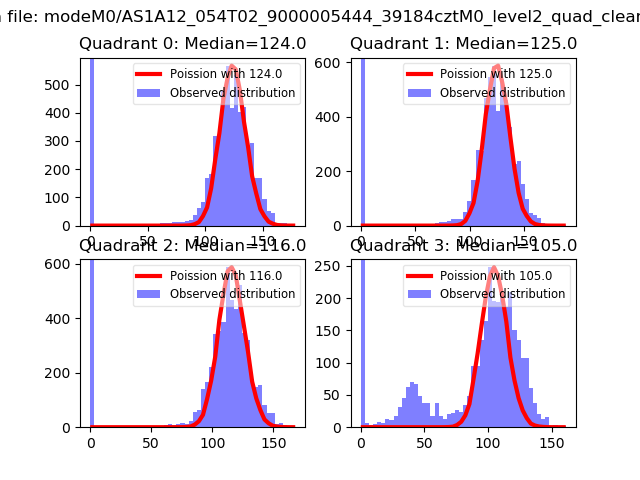 |
 |
| Quadrant-wise count rates Data is divided into 100 sec bins |
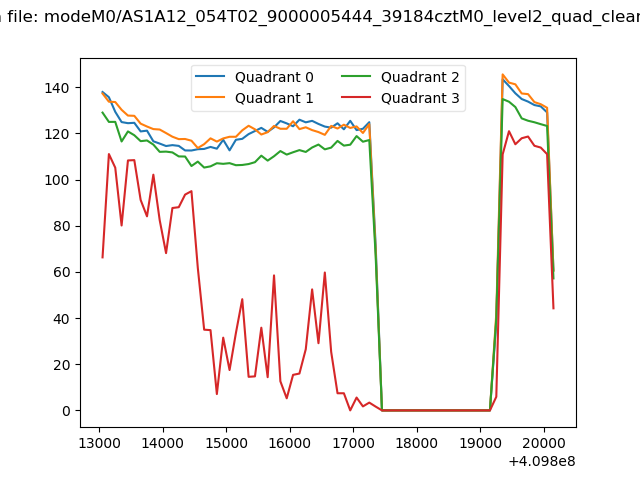 |
|
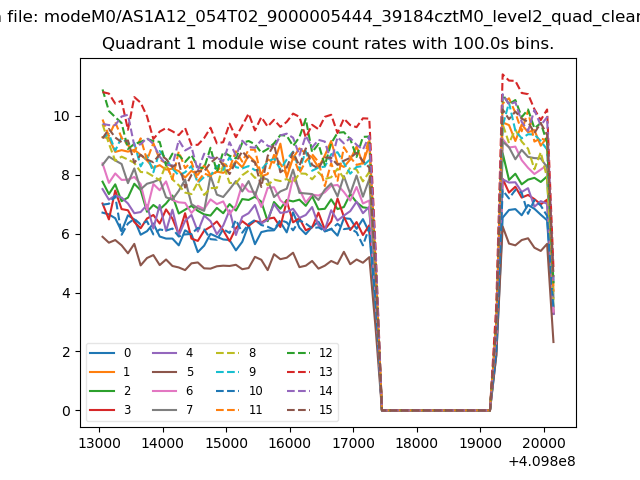
| Module-wise count rates for Quadrant A Data is divided into 100 sec bins |
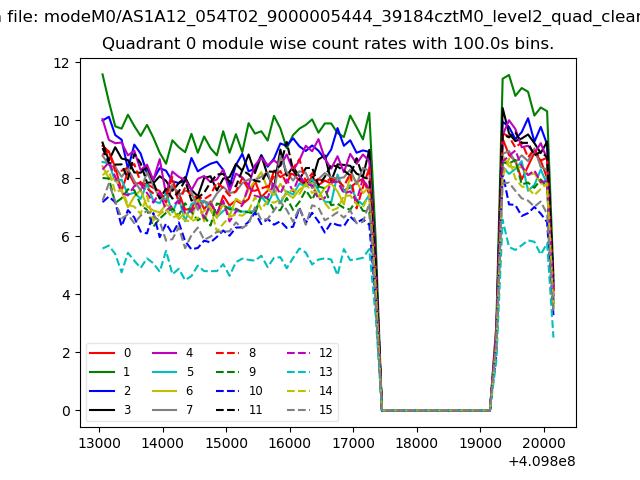 |
 |
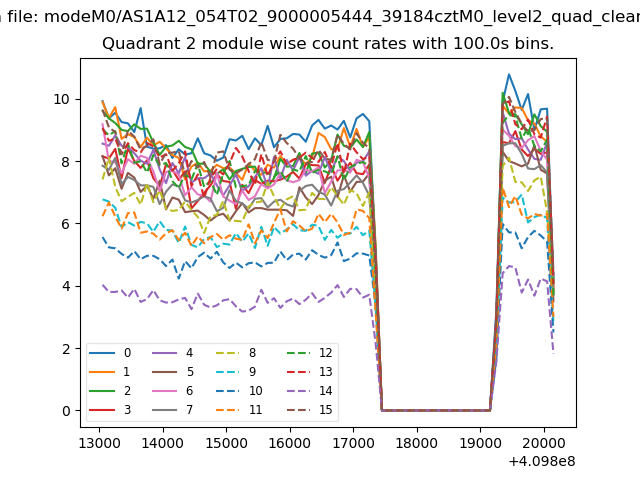
| Module-wise count rates for Quadrant B Data is divided into 100 sec bins |
 |
 |
| Module-wise count rates for Quadrant C Data is divided into 100 sec bins |
 |
 |
| Module-wise count rates for Quadrant D Data is divided into 100 sec bins |
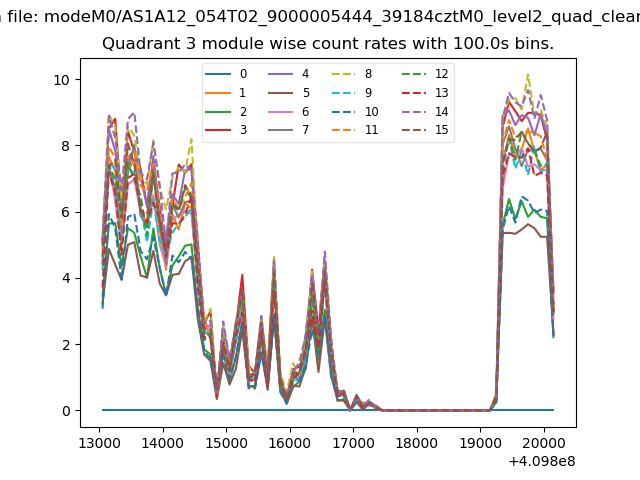 |
 |
| Parameter | Plot |
|---|---|
| CZT HV Monitor | 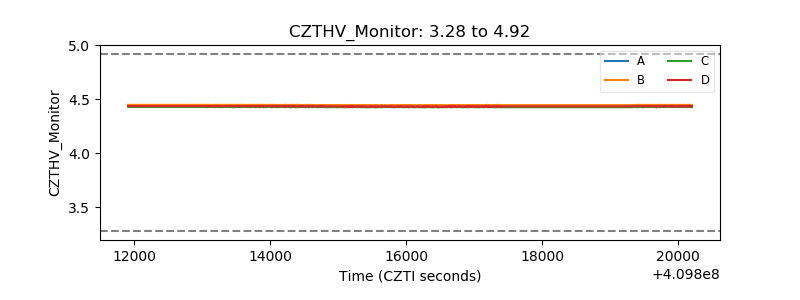 |
| D_VDD | 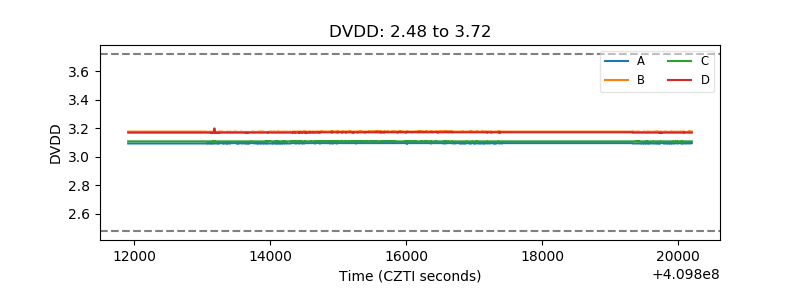 |
| Temperature 1 | 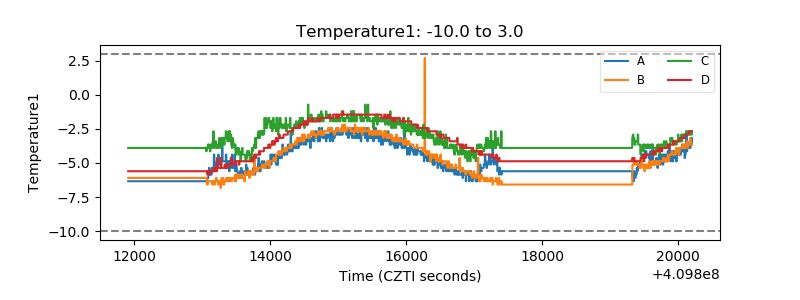 |
| Veto HV Monitor | 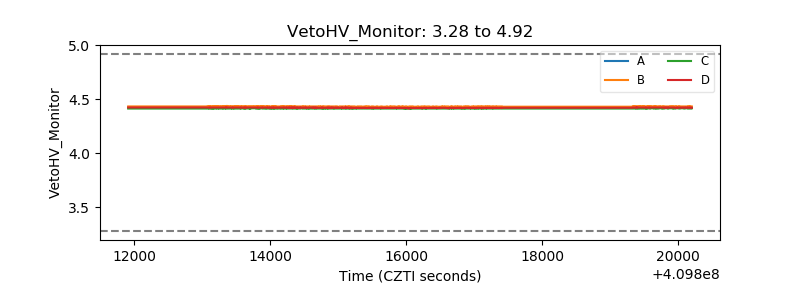 |
| Veto LLD | 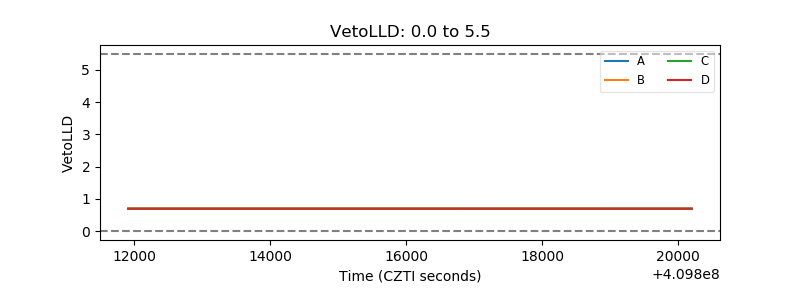 |
| Alpha Counter | 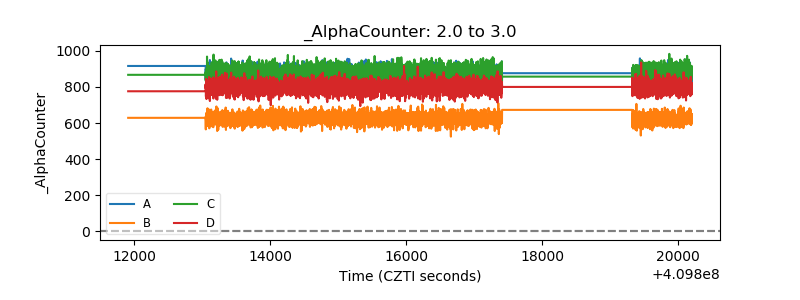 |
| _CPM_Rate | 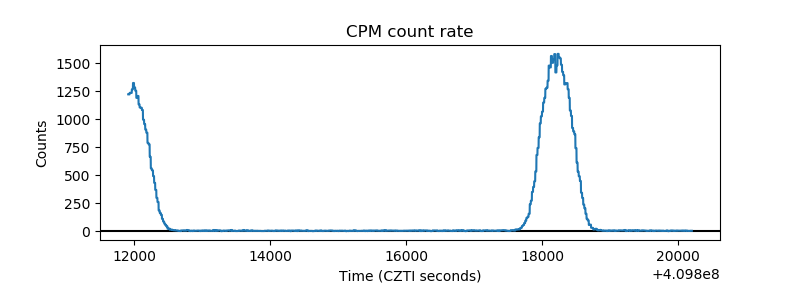 |
| CZT Counter | 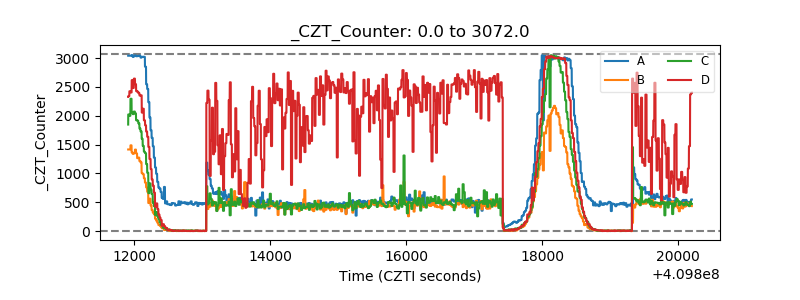 |
| +2.5 Volts monitor | 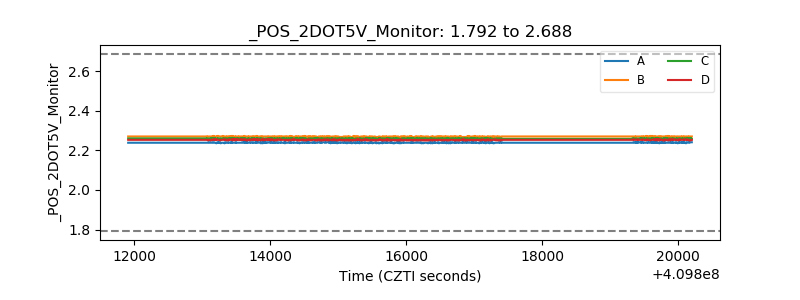 |
| +5 Volts monitor | 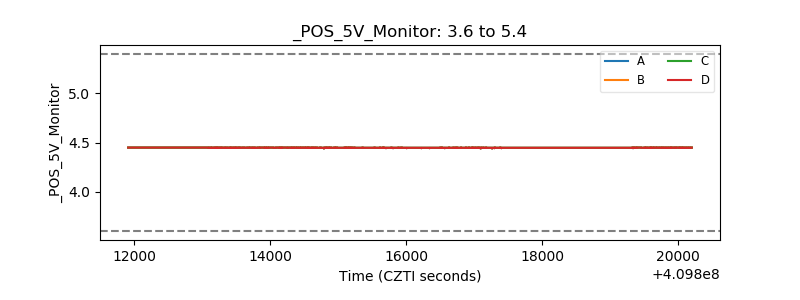 |
| _ROLL_ROT | 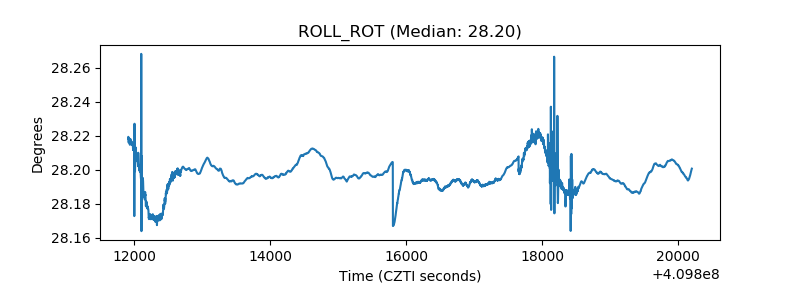 |
| _Roll_DEC | 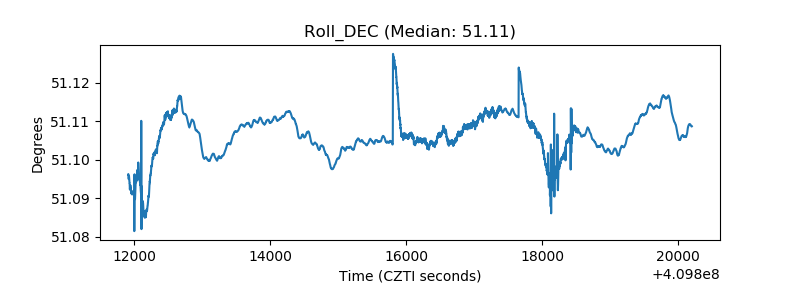 |
| _Roll_RA | 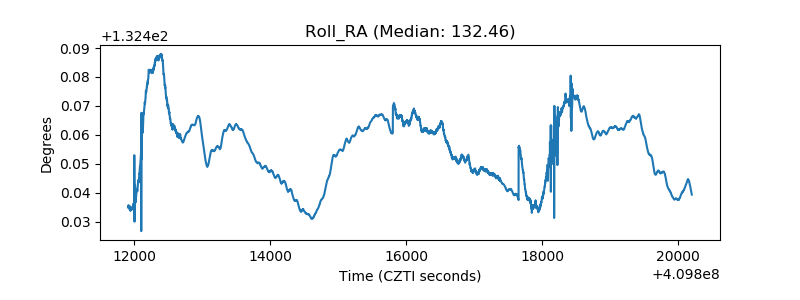 |
| Veto Counter | 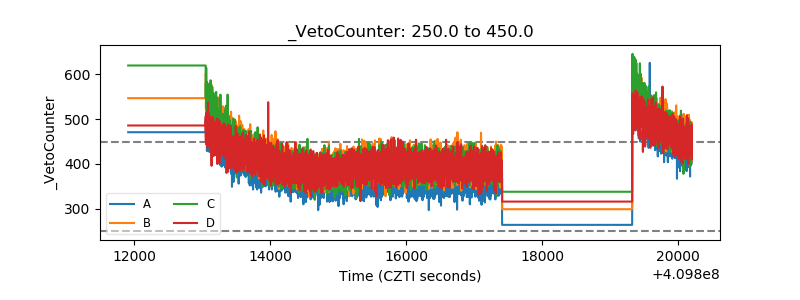 |