| Param | Original file | Final file |
|---|---|---|
| Filename | modeM0/AS1A12_054T02_9000005444_39185cztM0_level2.fits | modeM0/AS1A12_054T02_9000005444_39185cztM0_level2_quad_clean.evt |
| Size (bytes) | 1,262,638,080 | 209,232,000 |
| Size | 1.2 GB | 199.5 MB |
| Events in quadrant A | 7,017,216 | 1,595,234 |
| Events in quadrant B | 6,376,778 | 1,608,435 |
| Events in quadrant C | 6,528,005 | 1,499,609 |
| Events in quadrant D | 25,798,082 | 723,438 |
| Mode M9 | |||
|---|---|---|---|
| Quadrant | BADHDUFLAG | Total packets | Discarded packets |
| A | 0 | 58 | 0 |
| B | 0 | 58 | 0 |
| C | 0 | 58 | 0 |
| D | 0 | 58 | 0 |
| Mode M0 | |||
|---|---|---|---|
| Quadrant | BADHDUFLAG | Total packets | Discarded packets |
| A | 0 | 28423 | 4 |
| B | 0 | 27751 | 3 |
| C | 0 | 27434 | 3 |
| D | 0 | 85675 | 3 |
| Mode SS | |||
|---|---|---|---|
| Quadrant | BADHDUFLAG | Total packets | Discarded packets |
| A | 0 | 266 | 0 |
| B | 0 | 266 | 0 |
| C | 0 | 266 | 0 |
| D | 0 | 266 | 0 |
| Quadrant | Total seconds | Saturated seconds | Saturation percentage |
|---|---|---|---|
| A | 13159 | 37 | 0.281176% |
| B | 13159 | 107 | 0.813132% |
| C | 13159 | 60 | 0.455962% |
| D | 13159 | 7283 | 55.346151% |
Noise dominated data is calculated using 1-second bins in cleaned event files. If a bin has >2000 counts, and if more than 50% of those come from <1% of pixels, then it is considered to be noise-dominated and hence unusable.
| Quadrant | # 1 sec bins | Bins with >0 counts | Bins with >2000 counts | High rate bins dominated by noise | Noise dominated (total time) | Noise dominated (detector-on time) | Marked lightcurve |
|---|---|---|---|---|---|---|---|
| A | 18836 | 13162 | 25 | 25 | 0.13% | 0.19% | 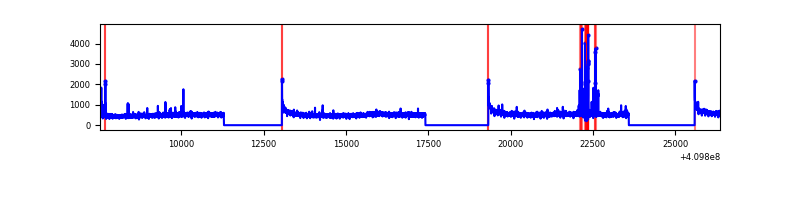 |
| B | 18836 | 13162 | 79 | 79 | 0.42% | 0.60% | 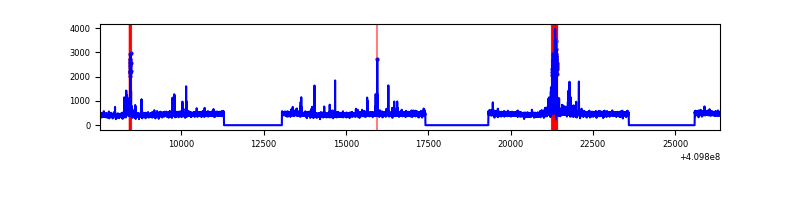 |
| C | 18836 | 13162 | 36 | 36 | 0.19% | 0.27% | 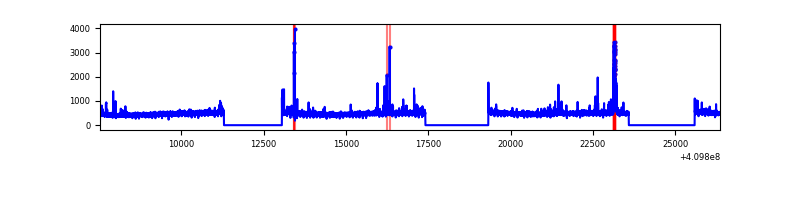 |
| D | 18836 | 13162 | 6184 | 6184 | 32.83% | 46.98% | 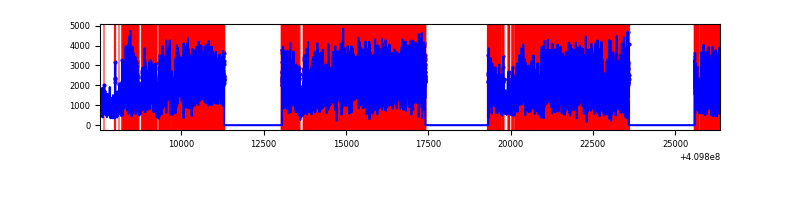 |
Top three noisy pixels from each quadrant. If the there are fewer than three noisy pixels in the level2.evt file, extra rows are filled as -1
| Pixel properties | Quadrant properties | ||||||
|---|---|---|---|---|---|---|---|
| Quadrant | DetID | PixID | Counts | Sigma | Mean | Median | Sigma |
| A | 10 | 83 | 894050 | 2951.34 | 1520 | 1495 | 302.4 |
| A | 2 | 79 | 196372 | 644.38 | 1520 | 1495 | 302.4 |
| A | 13 | 6 | 42340 | 135.06 | 1520 | 1495 | 302.4 |
| B | 5 | 184 | 395027 | 1408.58 | 1487 | 1448 | 279.4 |
| B | 0 | 245 | 45097 | 156.22 | 1487 | 1448 | 279.4 |
| B | 15 | 85 | 39338 | 135.6 | 1487 | 1448 | 279.4 |
| C | 15 | 214 | 544408 | 1632.55 | 1447 | 1456 | 332.6 |
| C | 9 | 187 | 326622 | 977.71 | 1447 | 1456 | 332.6 |
| C | 0 | 10 | 10813 | 28.13 | 1447 | 1456 | 332.6 |
| D | 12 | 235 | 19401729 | 67454.53 | 1177 | 1144 | 287.6 |
| D | 2 | 249 | 1189317 | 4131.2 | 1177 | 1144 | 287.6 |
| D | 12 | 227 | 271836 | 941.18 | 1177 | 1144 | 287.6 |
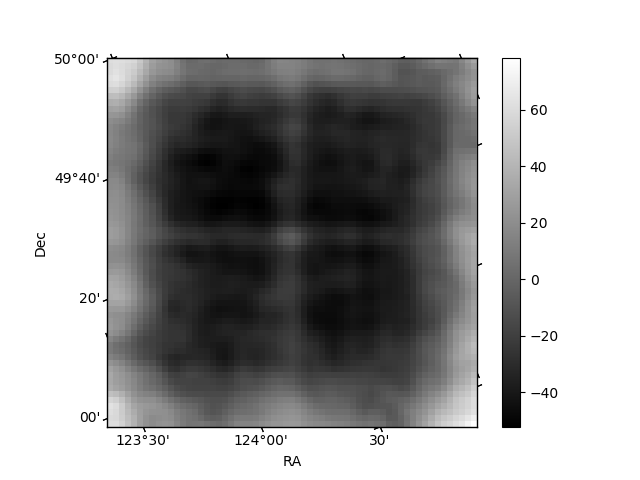
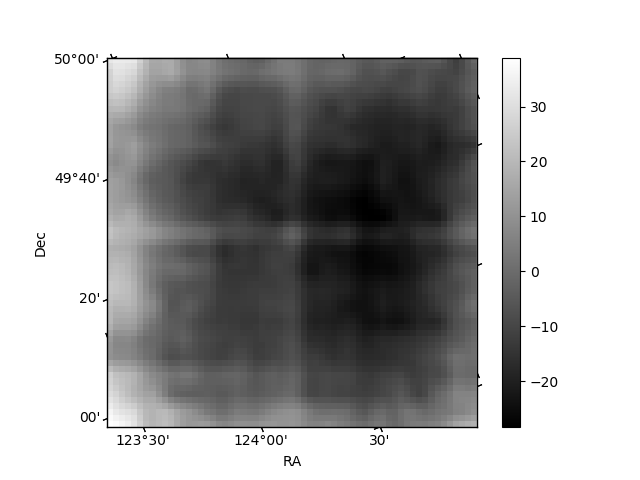
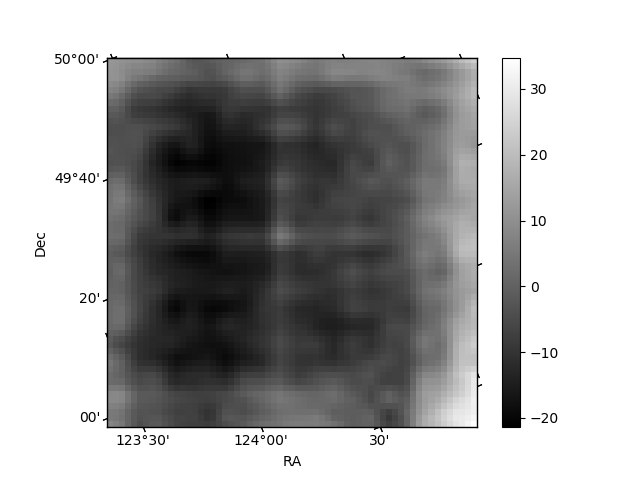
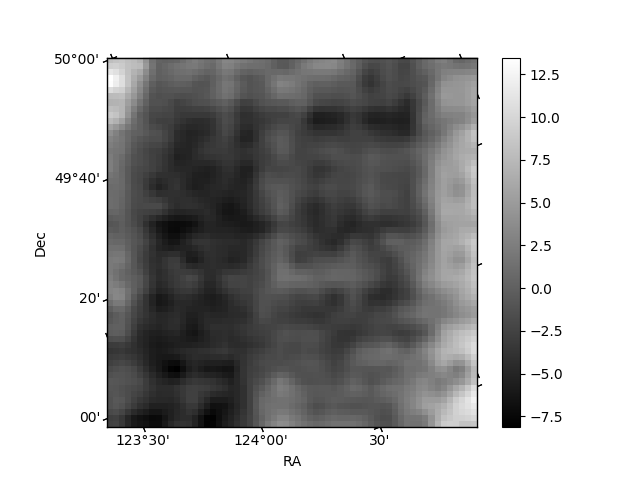
Histogram calculated using DETX and DETY for each event in the final _common_clean file
| Quadrant A | 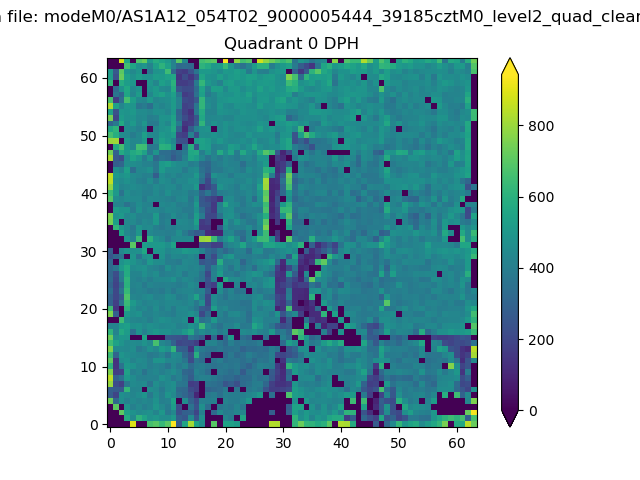 |
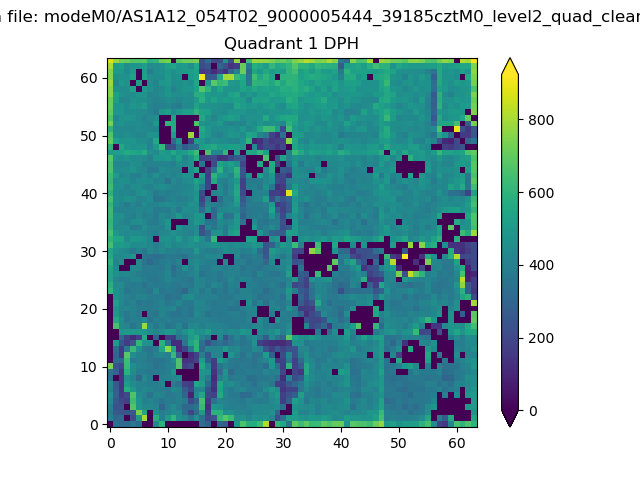 |
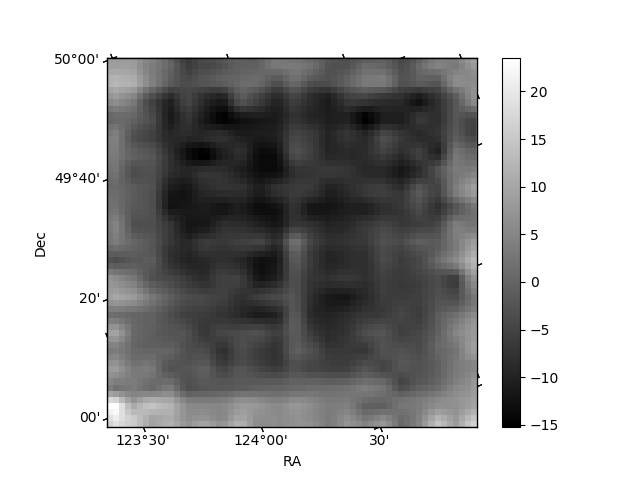
Quadrant B |
|---|---|---|---|
| Quadrant D |  |
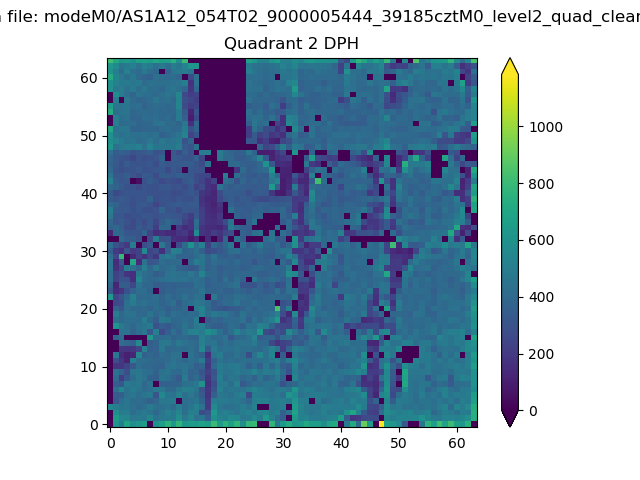 |
Quadrant C |
| Plot type | Count rate plots | Images |
|---|---|---|
| Comparison with Poisson distribution Blue bars denote a histogram of data divided into 1 sec bins. Red curve is a Poisson curve with rate = median count rate of data. |
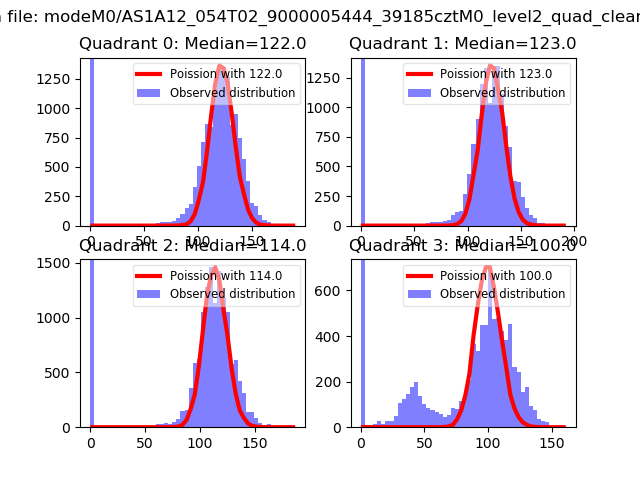 |
 |
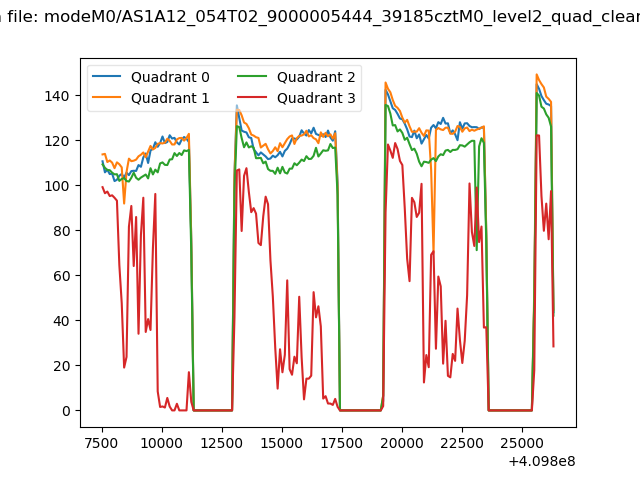
| Quadrant-wise count rates Data is divided into 100 sec bins |
 |
|
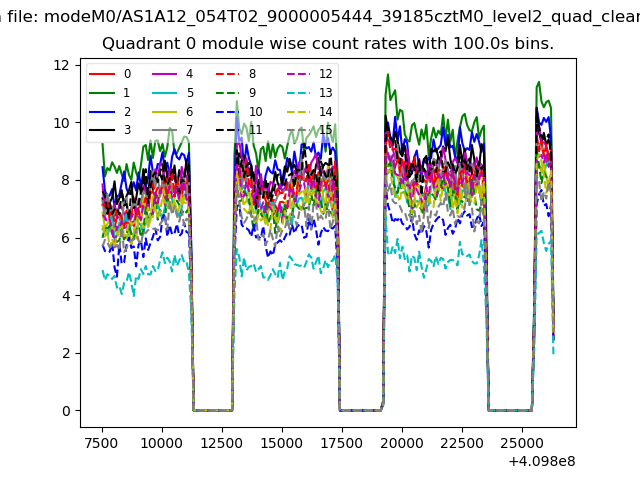
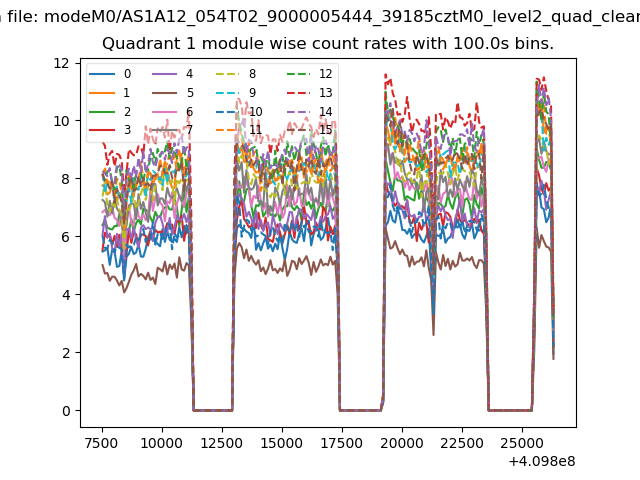
| Module-wise count rates for Quadrant A Data is divided into 100 sec bins |
 |
 |
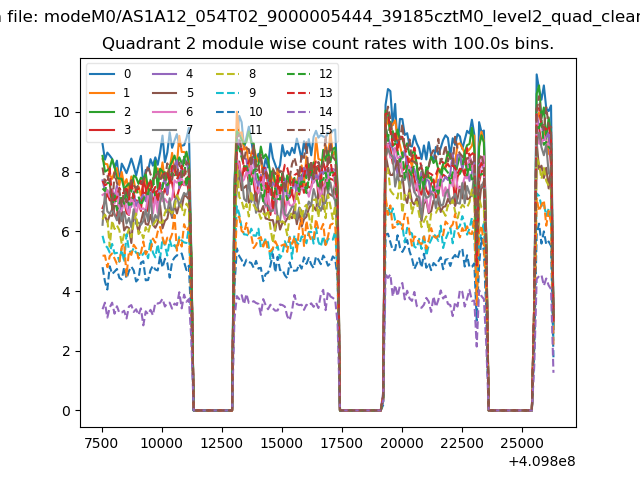
| Module-wise count rates for Quadrant B Data is divided into 100 sec bins |
 |
 |
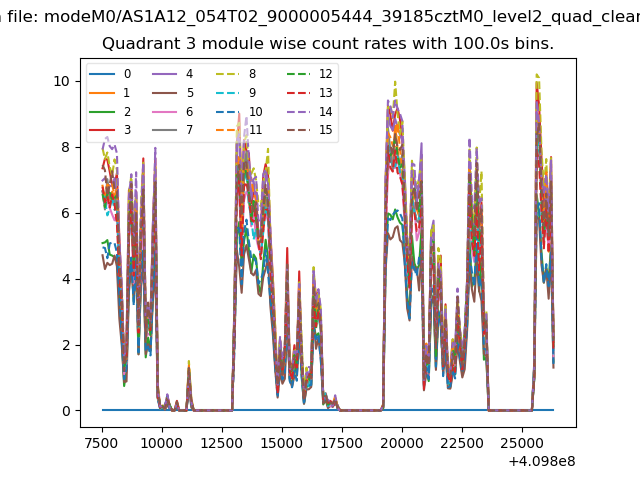
| Module-wise count rates for Quadrant C Data is divided into 100 sec bins |
 |
 |
| Module-wise count rates for Quadrant D Data is divided into 100 sec bins |
 |
 |
| Parameter | Plot |
|---|---|
| CZT HV Monitor | 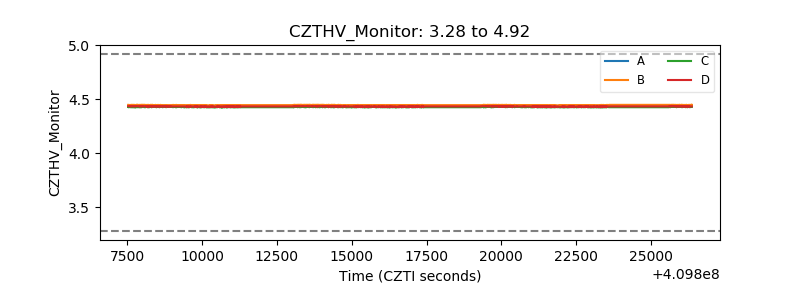 |
| D_VDD | 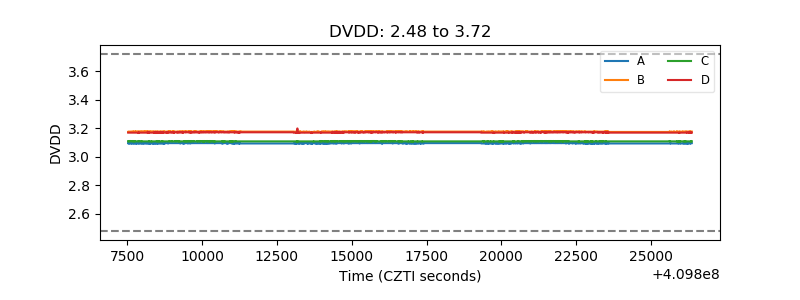 |
| Temperature 1 | 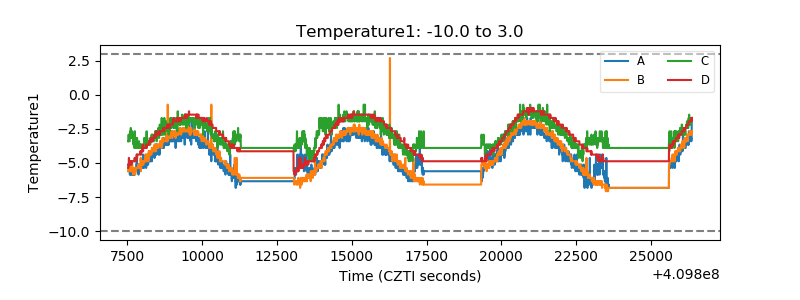 |
| Veto HV Monitor | 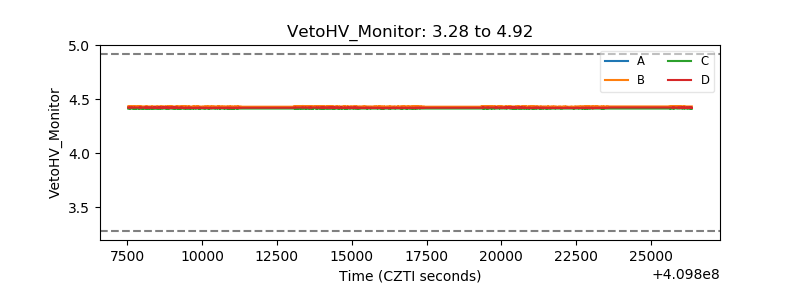 |
| Veto LLD | 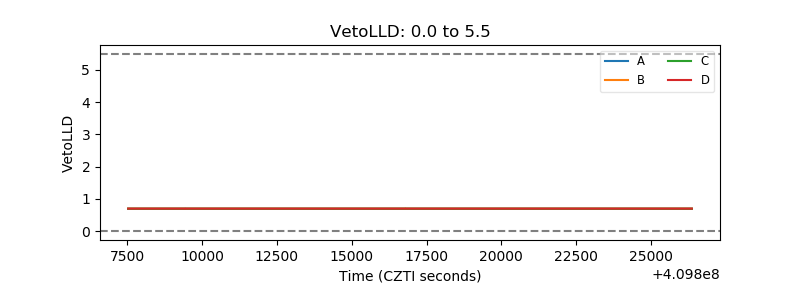 |
| Alpha Counter |  |
| _CPM_Rate | 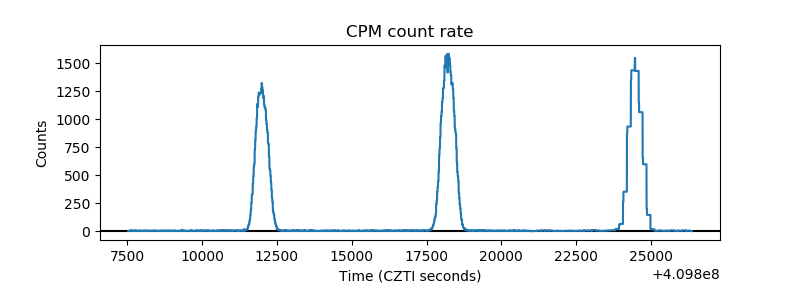 |
| CZT Counter | 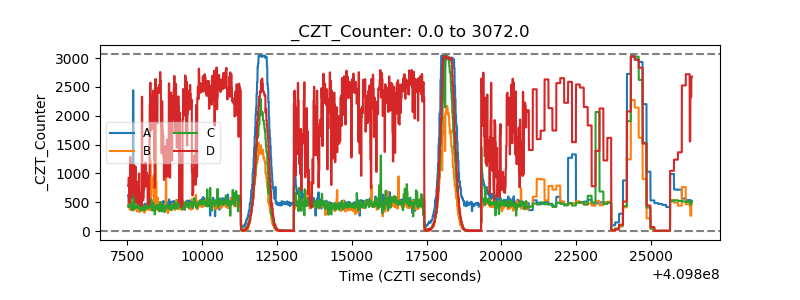 |
| +2.5 Volts monitor | 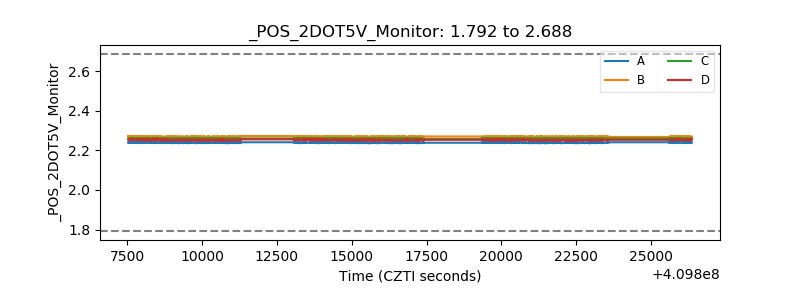 |
| +5 Volts monitor | 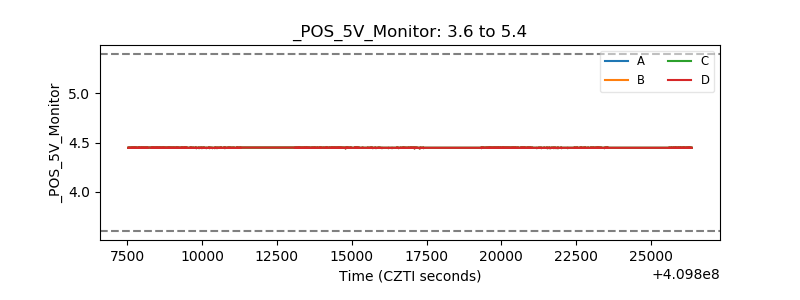 |
| _ROLL_ROT | 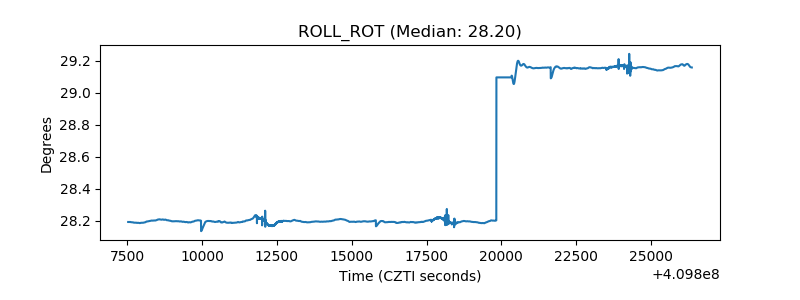 |
| _Roll_DEC | 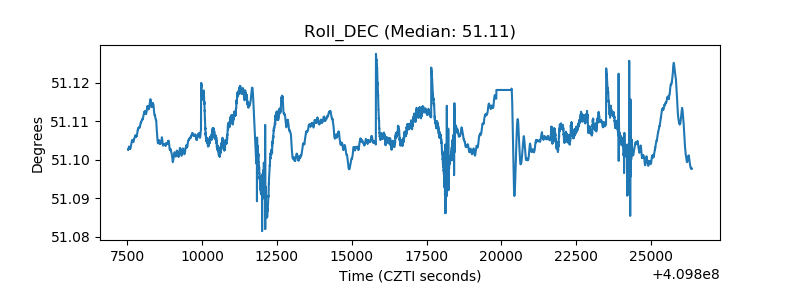 |
| _Roll_RA | 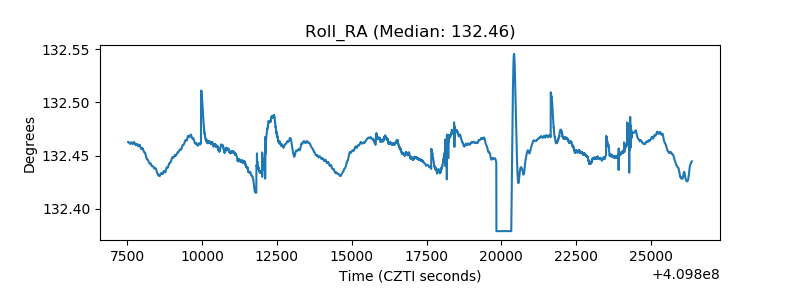 |
| Veto Counter | 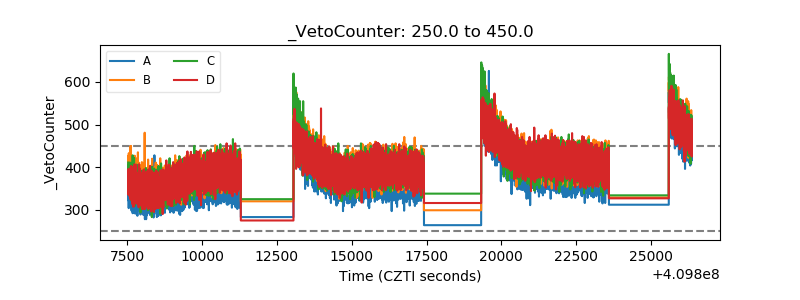 |