| Param | Original file | Final file |
|---|---|---|
| Filename | modeM0/AS1A12_054T02_9000005444_39186cztM0_level2.fits | modeM0/AS1A12_054T02_9000005444_39186cztM0_level2_quad_clean.evt |
| Size (bytes) | 540,708,480 | 84,381,120 |
| Size | 515.7 MB | 80.5 MB |
| Events in quadrant A | 3,086,093 | 674,355 |
| Events in quadrant B | 2,512,834 | 682,870 |
| Events in quadrant C | 2,776,098 | 630,886 |
| Events in quadrant D | 11,238,513 | 205,418 |
| Mode M9 | |||
|---|---|---|---|
| Quadrant | BADHDUFLAG | Total packets | Discarded packets |
| A | 0 | 22 | 0 |
| B | 0 | 22 | 0 |
| C | 0 | 22 | 0 |
| D | 0 | 23 | 0 |
| Mode M0 | |||
|---|---|---|---|
| Quadrant | BADHDUFLAG | Total packets | Discarded packets |
| A | 0 | 12268 | 3 |
| B | 0 | 10613 | 2 |
| C | 0 | 11184 | 2 |
| D | 0 | 36881 | 2 |
| Mode SS | |||
|---|---|---|---|
| Quadrant | BADHDUFLAG | Total packets | Discarded packets |
| A | 0 | 106 | 0 |
| B | 0 | 106 | 0 |
| C | 0 | 106 | 0 |
| D | 0 | 106 | 0 |
| Quadrant | Total seconds | Saturated seconds | Saturation percentage |
|---|---|---|---|
| A | 5161 | 32 | 0.620035% |
| B | 5161 | 16 | 0.310017% |
| C | 5161 | 28 | 0.542531% |
| D | 5161 | 3720 | 72.079054% |
Noise dominated data is calculated using 1-second bins in cleaned event files. If a bin has >2000 counts, and if more than 50% of those come from <1% of pixels, then it is considered to be noise-dominated and hence unusable.
| Quadrant | # 1 sec bins | Bins with >0 counts | Bins with >2000 counts | High rate bins dominated by noise | Noise dominated (total time) | Noise dominated (detector-on time) | Marked lightcurve |
|---|---|---|---|---|---|---|---|
| A | 7254 | 5162 | 21 | 21 | 0.29% | 0.41% | 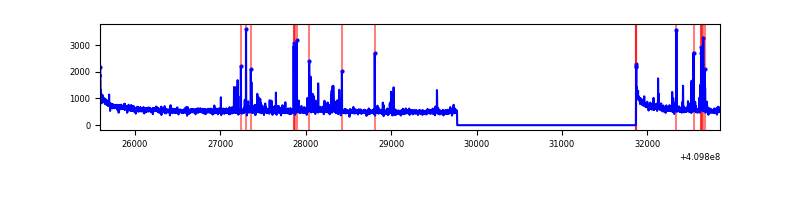 |
| B | 7254 | 5162 | 7 | 7 | 0.10% | 0.14% | 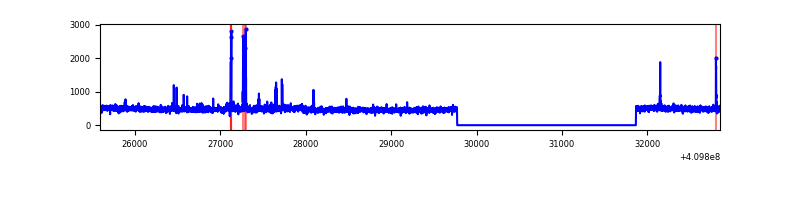 |
| C | 7254 | 5162 | 27 | 27 | 0.37% | 0.52% | 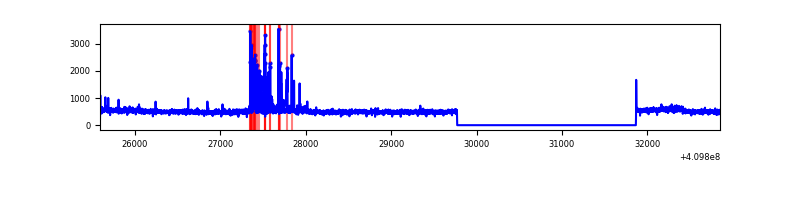 |
| D | 7253 | 5161 | 3048 | 3048 | 42.02% | 59.06% | 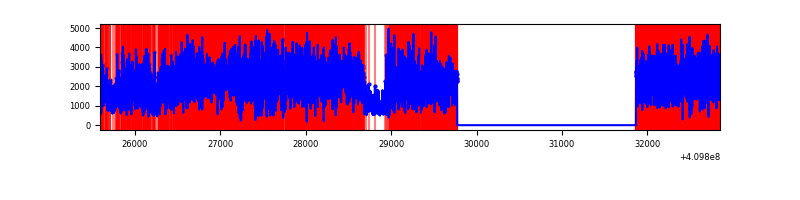 |
Top three noisy pixels from each quadrant. If the there are fewer than three noisy pixels in the level2.evt file, extra rows are filled as -1
| Pixel properties | Quadrant properties | ||||||
|---|---|---|---|---|---|---|---|
| Quadrant | DetID | PixID | Counts | Sigma | Mean | Median | Sigma |
| A | 10 | 83 | 422634 | 3393.09 | 624 | 614 | 124.4 |
| A | 9 | 143 | 142073 | 1137.35 | 624 | 614 | 124.4 |
| A | 13 | 248 | 60347 | 480.26 | 624 | 614 | 124.4 |
| B | 5 | 172 | 58219 | 500.58 | 610 | 594 | 115.1 |
| B | 0 | 230 | 24236 | 205.37 | 610 | 594 | 115.1 |
| B | 0 | 213 | 22897 | 193.74 | 610 | 594 | 115.1 |
| C | 9 | 187 | 230868 | 1687.48 | 594 | 599 | 136.5 |
| C | 15 | 214 | 218896 | 1599.74 | 594 | 599 | 136.5 |
| C | 0 | 10 | 6529 | 43.46 | 594 | 599 | 136.5 |
| D | 12 | 235 | 9033132 | 88260.33 | 422 | 410 | 102.3 |
| D | 2 | 249 | 244343 | 2383.51 | 422 | 410 | 102.3 |
| D | 5 | 222 | 135117 | 1316.25 | 422 | 410 | 102.3 |
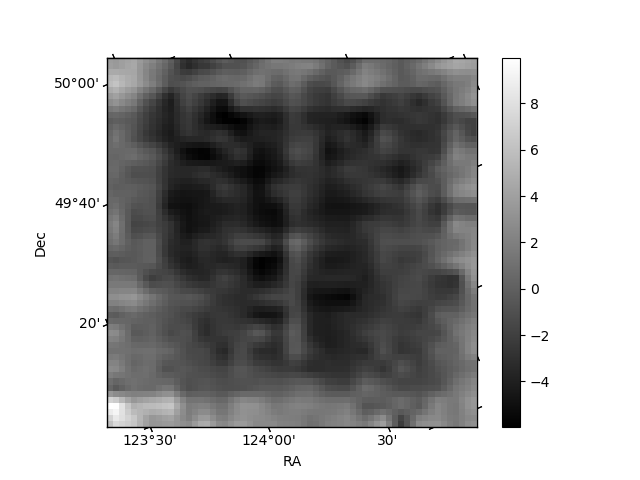
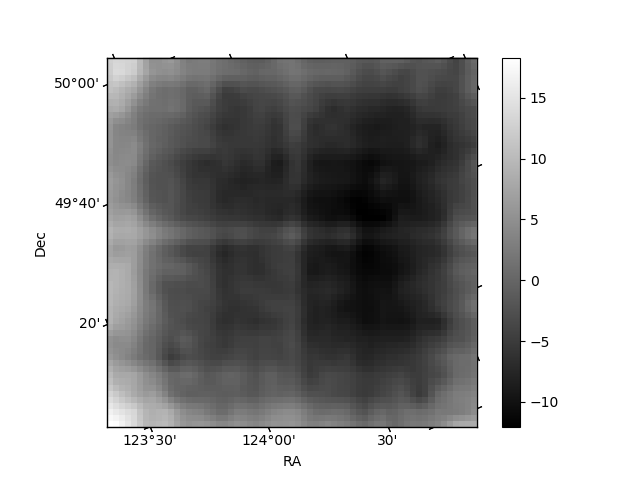
Histogram calculated using DETX and DETY for each event in the final _common_clean file
| Quadrant A | 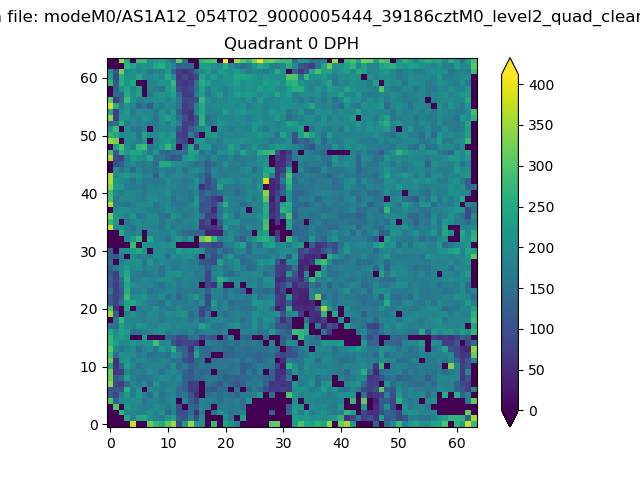 |
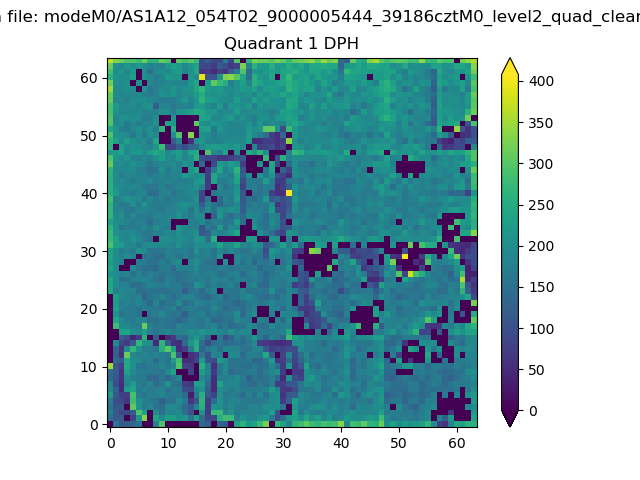 |
Quadrant B |
|---|---|---|---|
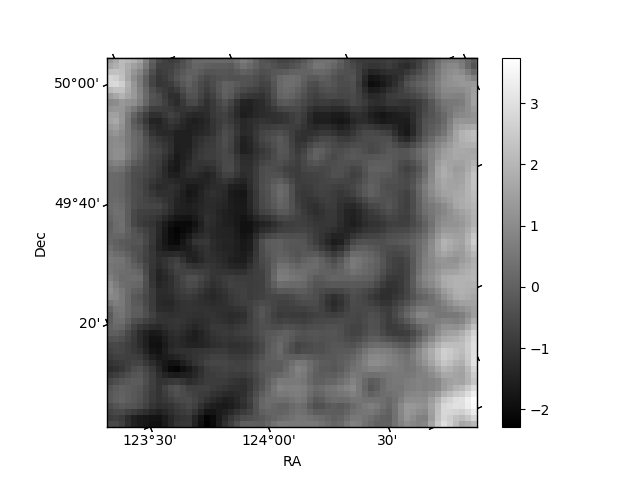
| Quadrant D | 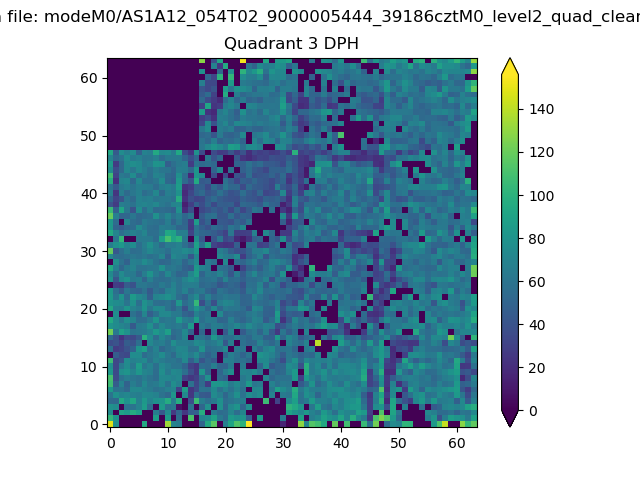 |
 |
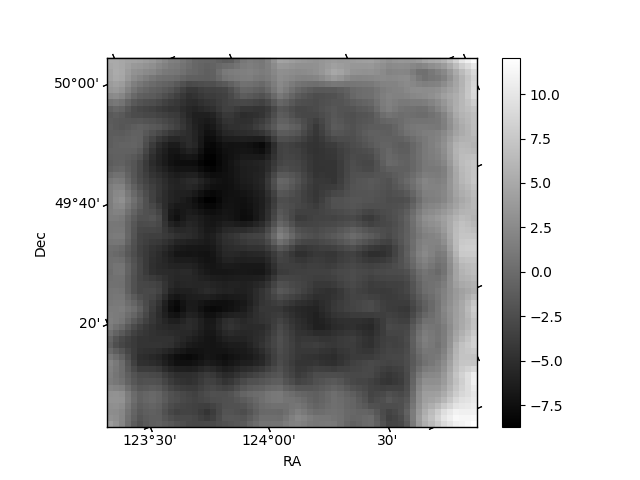
Quadrant C |
| Plot type | Count rate plots | Images |
|---|---|---|
| Comparison with Poisson distribution Blue bars denote a histogram of data divided into 1 sec bins. Red curve is a Poisson curve with rate = median count rate of data. |
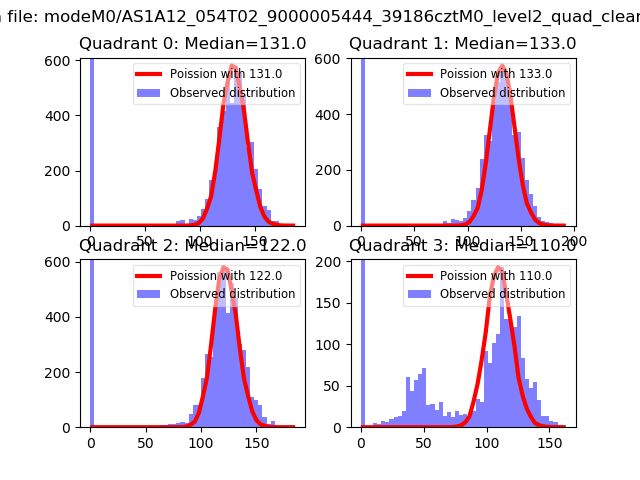 |
 |
| Quadrant-wise count rates Data is divided into 100 sec bins |
 |
|
| Module-wise count rates for Quadrant A Data is divided into 100 sec bins |
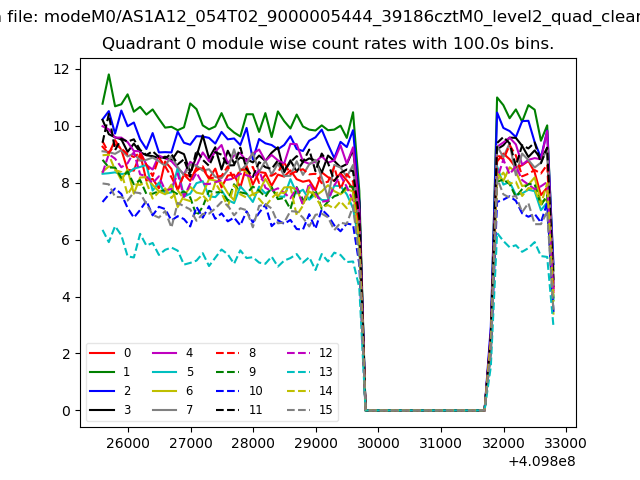 |
 |
| Module-wise count rates for Quadrant B Data is divided into 100 sec bins |
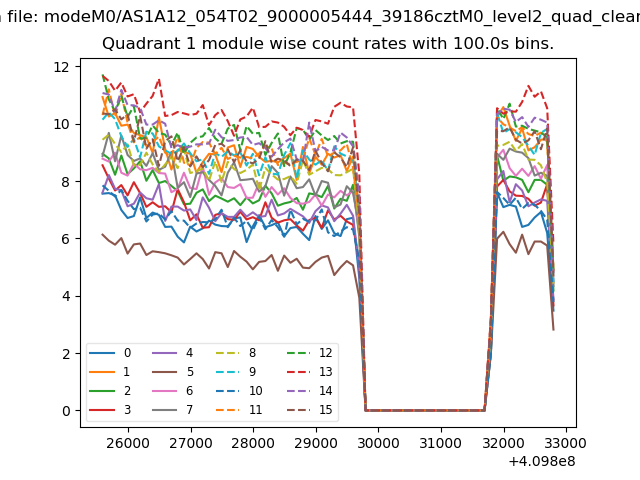 |
 |
| Module-wise count rates for Quadrant C Data is divided into 100 sec bins |
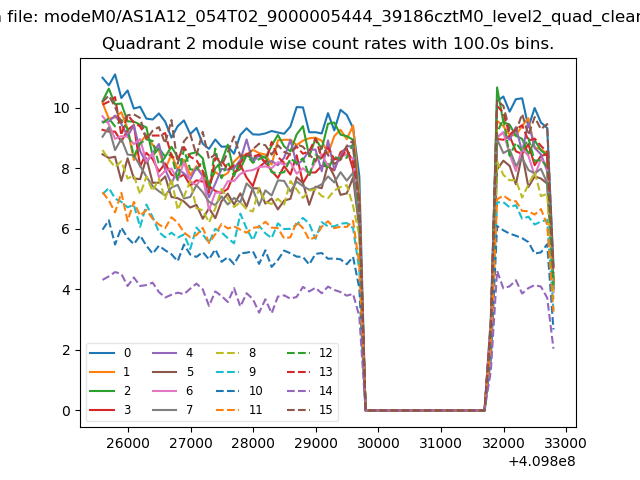 |
 |
| Module-wise count rates for Quadrant D Data is divided into 100 sec bins |
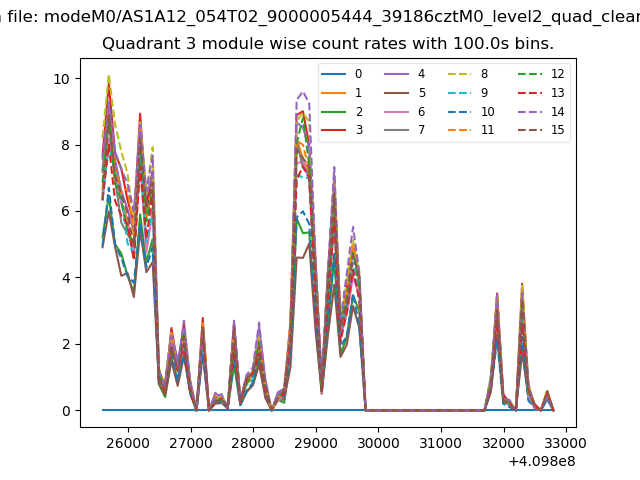 |
 |
| Parameter | Plot |
|---|---|
| CZT HV Monitor | 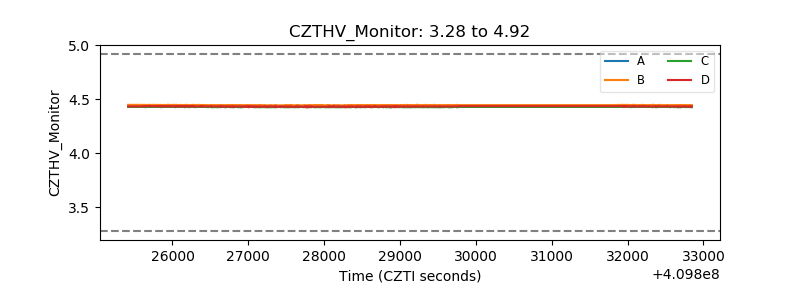 |
| D_VDD | 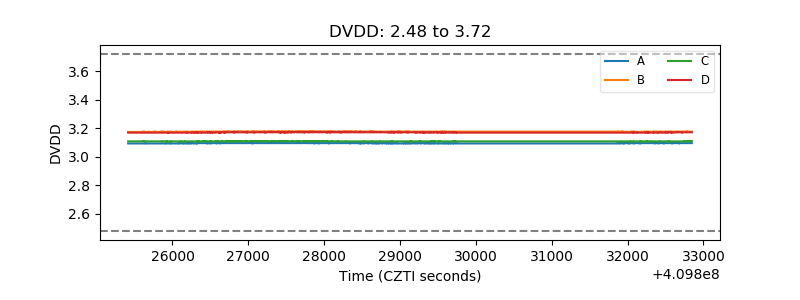 |
| Temperature 1 | 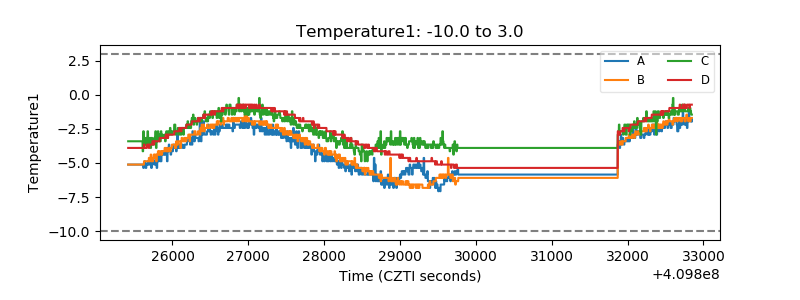 |
| Veto HV Monitor | 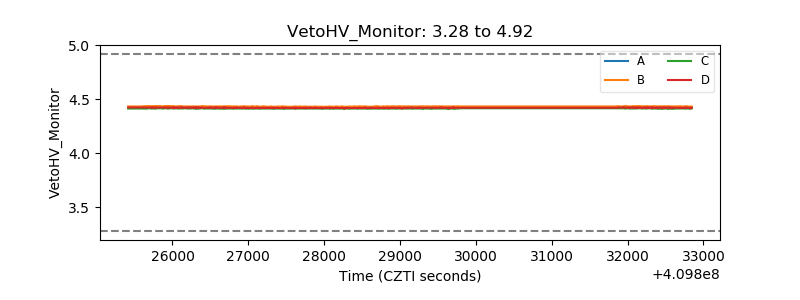 |
| Veto LLD | 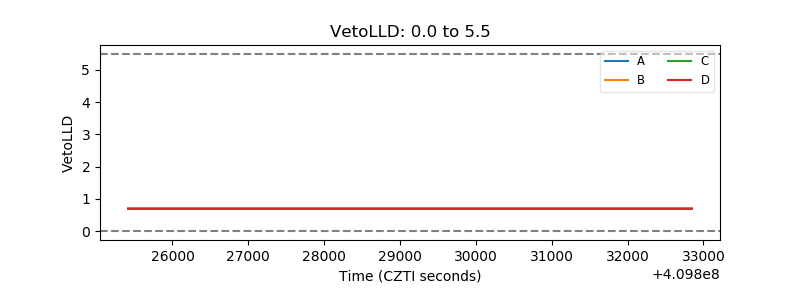 |
| Alpha Counter | 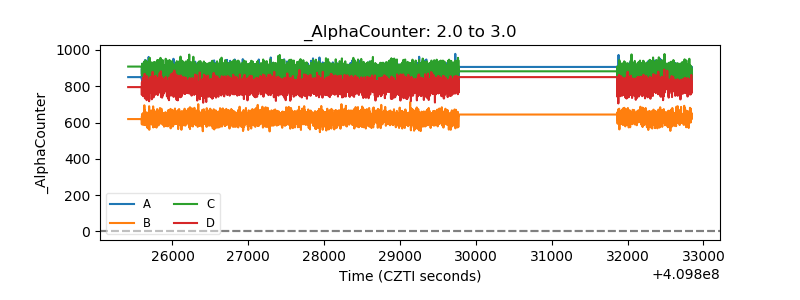 |
| _CPM_Rate | 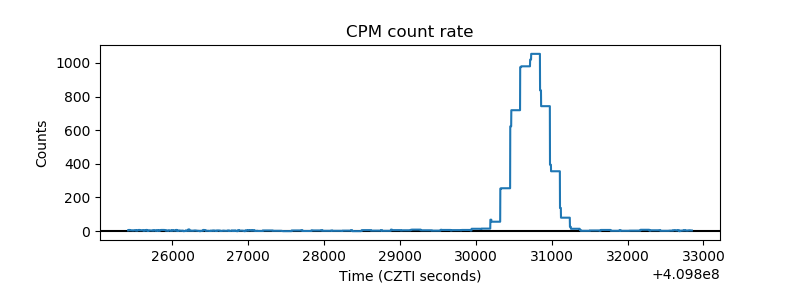 |
| CZT Counter | 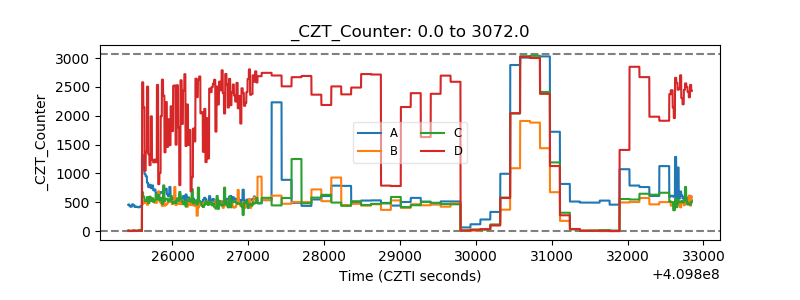 |
| +2.5 Volts monitor | 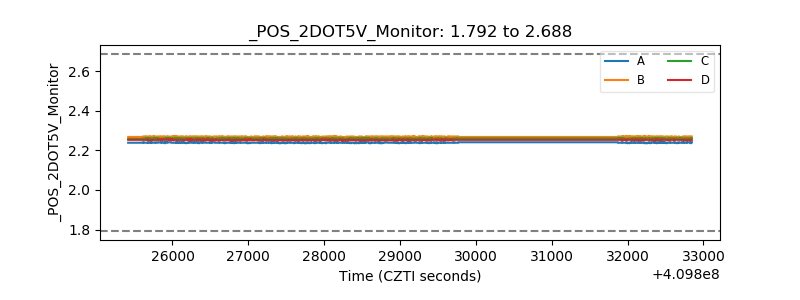 |
| +5 Volts monitor | 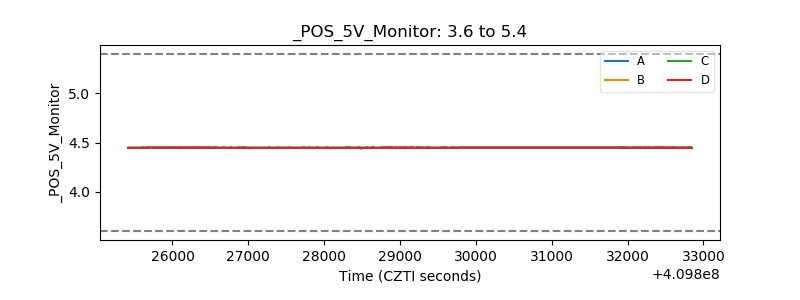 |
| _ROLL_ROT | 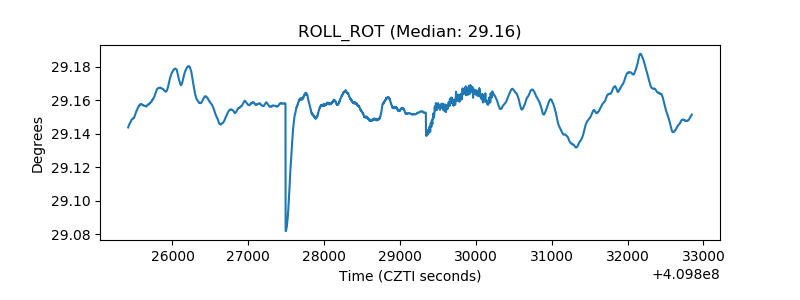 |
| _Roll_DEC | 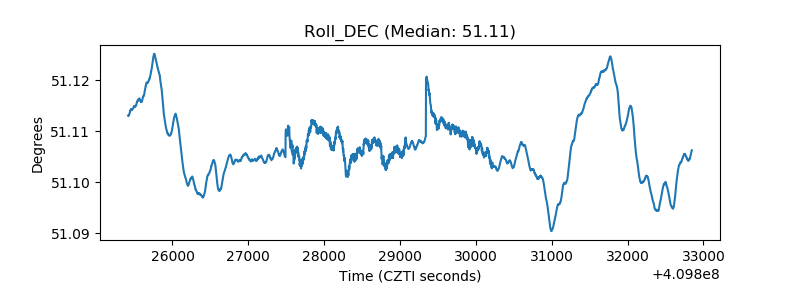 |
| _Roll_RA | 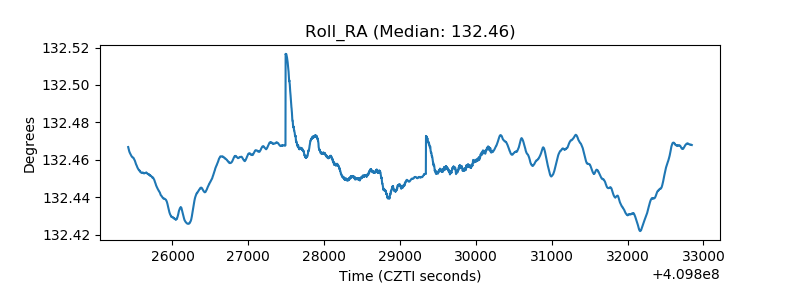 |
| Veto Counter | 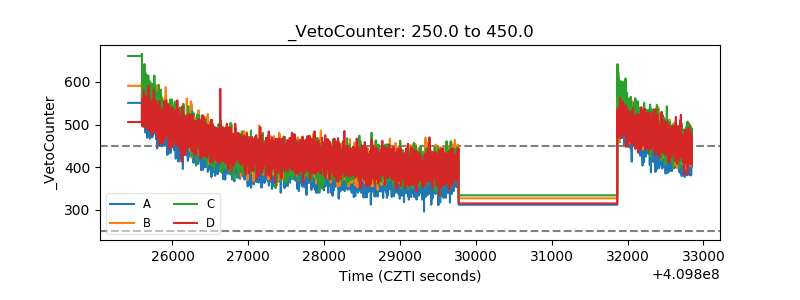 |