| Param | Original file | Final file |
|---|---|---|
| Filename | modeM0/AS1A12_054T02_9000005444_39187cztM0_level2.fits | modeM0/AS1A12_054T02_9000005444_39187cztM0_level2_quad_clean.evt |
| Size (bytes) | 526,775,040 | 81,492,480 |
| Size | 502.4 MB | 77.7 MB |
| Events in quadrant A | 3,210,801 | 652,119 |
| Events in quadrant B | 2,450,222 | 663,903 |
| Events in quadrant C | 2,576,243 | 614,969 |
| Events in quadrant D | 10,860,738 | 175,851 |
| Mode M9 | |||
|---|---|---|---|
| Quadrant | BADHDUFLAG | Total packets | Discarded packets |
| A | 0 | 28 | 0 |
| B | 0 | 28 | 0 |
| C | 0 | 28 | 0 |
| D | 0 | 29 | 0 |
| Mode M0 | |||
|---|---|---|---|
| Quadrant | BADHDUFLAG | Total packets | Discarded packets |
| A | 0 | 12728 | 3 |
| B | 0 | 10519 | 2 |
| C | 0 | 10617 | 2 |
| D | 0 | 35691 | 2 |
| Mode SS | |||
|---|---|---|---|
| Quadrant | BADHDUFLAG | Total packets | Discarded packets |
| A | 0 | 104 | 0 |
| B | 0 | 104 | 0 |
| C | 0 | 104 | 0 |
| D | 0 | 104 | 0 |
| Quadrant | Total seconds | Saturated seconds | Saturation percentage |
|---|---|---|---|
| A | 5154 | 95 | 1.843229% |
| B | 5154 | 6 | 0.116414% |
| C | 5154 | 8 | 0.155219% |
| D | 5154 | 3749 | 72.739620% |
Noise dominated data is calculated using 1-second bins in cleaned event files. If a bin has >2000 counts, and if more than 50% of those come from <1% of pixels, then it is considered to be noise-dominated and hence unusable.
| Quadrant | # 1 sec bins | Bins with >0 counts | Bins with >2000 counts | High rate bins dominated by noise | Noise dominated (total time) | Noise dominated (detector-on time) | Marked lightcurve |
|---|---|---|---|---|---|---|---|
| A | 7278 | 5155 | 62 | 62 | 0.85% | 1.20% | 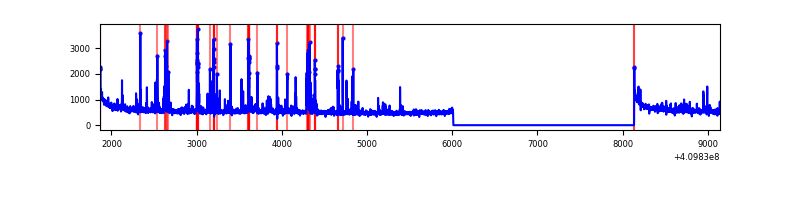 |
| B | 7278 | 5155 | 1 | 1 | 0.01% | 0.02% | 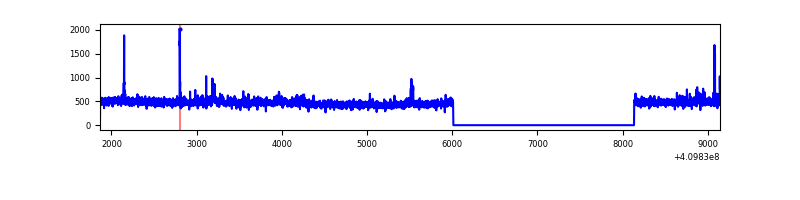 |
| C | 7278 | 5155 | 4 | 4 | 0.05% | 0.08% | 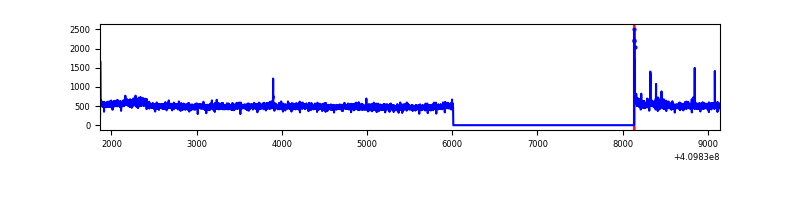 |
| D | 7278 | 5155 | 3059 | 3059 | 42.03% | 59.34% | 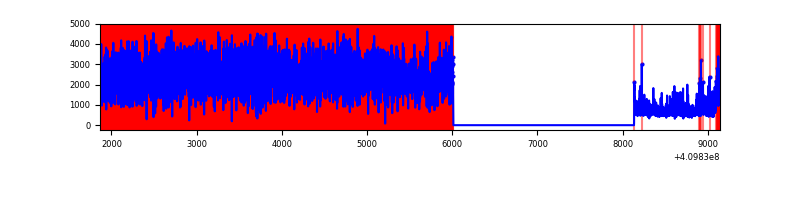 |
Top three noisy pixels from each quadrant. If the there are fewer than three noisy pixels in the level2.evt file, extra rows are filled as -1
| Pixel properties | Quadrant properties | ||||||
|---|---|---|---|---|---|---|---|
| Quadrant | DetID | PixID | Counts | Sigma | Mean | Median | Sigma |
| A | 10 | 83 | 436641 | 3576.01 | 607 | 596 | 121.9 |
| A | 9 | 143 | 244421 | 1999.61 | 607 | 596 | 121.9 |
| A | 13 | 248 | 146201 | 1194.11 | 607 | 596 | 121.9 |
| B | 0 | 213 | 64998 | 562.13 | 599 | 584 | 114.6 |
| B | 5 | 172 | 24763 | 211.01 | 599 | 584 | 114.6 |
| B | 5 | 184 | 15316 | 128.56 | 599 | 584 | 114.6 |
| C | 15 | 214 | 218209 | 1623.37 | 584 | 590 | 134.1 |
| C | 9 | 187 | 55248 | 407.73 | 584 | 590 | 134.1 |
| C | 15 | 208 | 9320 | 65.12 | 584 | 590 | 134.1 |
| D | 12 | 235 | 8803357 | 89620.05 | 402 | 391 | 98.2 |
| D | 2 | 249 | 137492 | 1395.78 | 402 | 391 | 98.2 |
| D | 5 | 222 | 78253 | 792.69 | 402 | 391 | 98.2 |
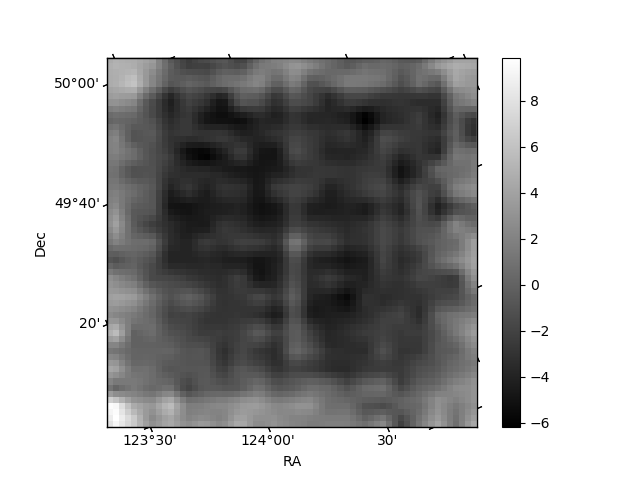
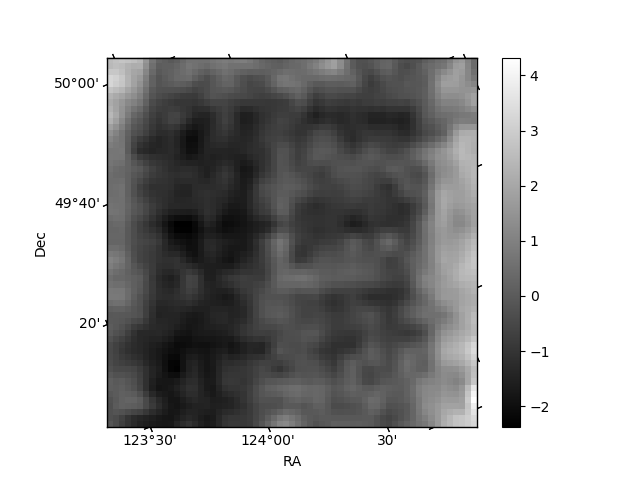
Histogram calculated using DETX and DETY for each event in the final _common_clean file
| Quadrant A | 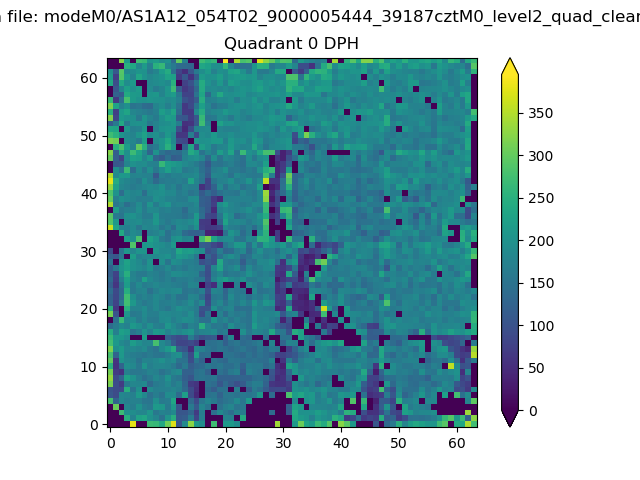 |
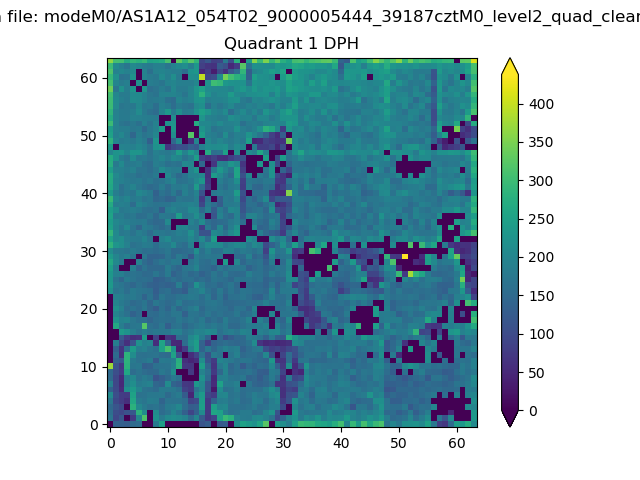 |
Quadrant B |
|---|---|---|---|
| Quadrant D | 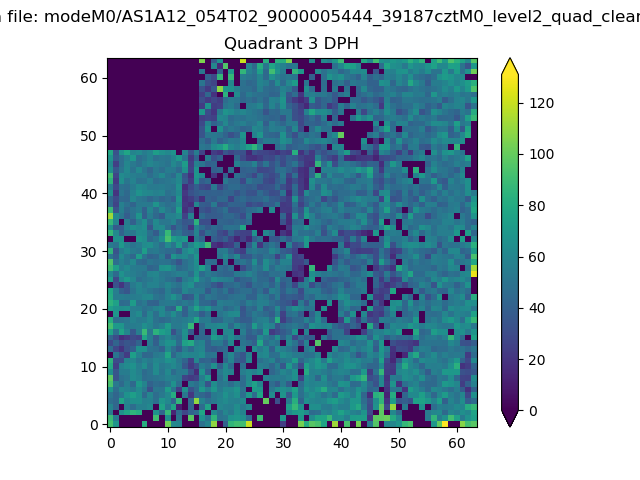 |
 |
Quadrant C |
| Plot type | Count rate plots | Images |
|---|---|---|
| Comparison with Poisson distribution Blue bars denote a histogram of data divided into 1 sec bins. Red curve is a Poisson curve with rate = median count rate of data. |
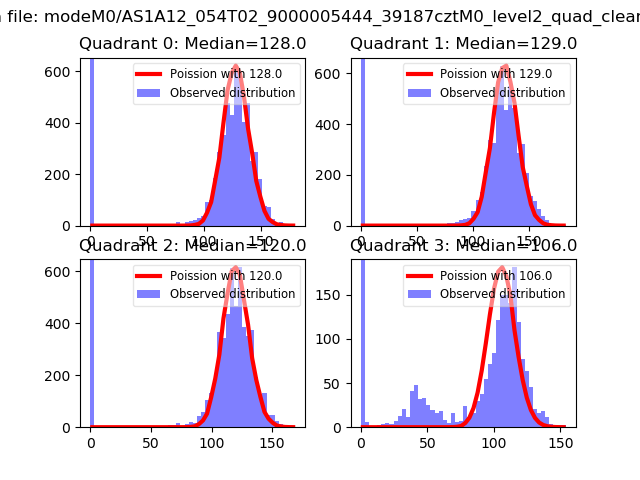 |
 |
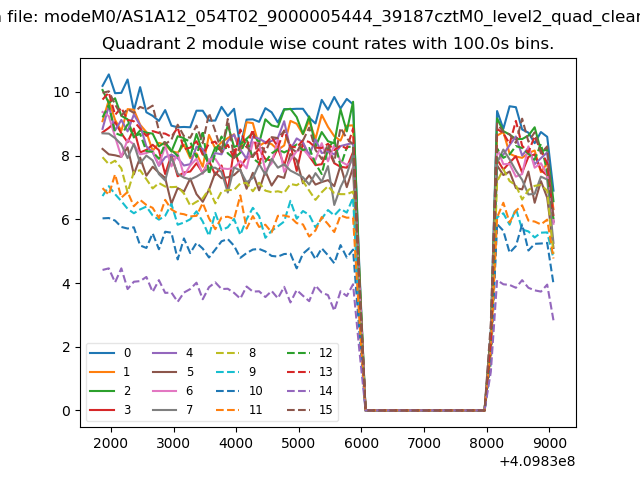
| Quadrant-wise count rates Data is divided into 100 sec bins |
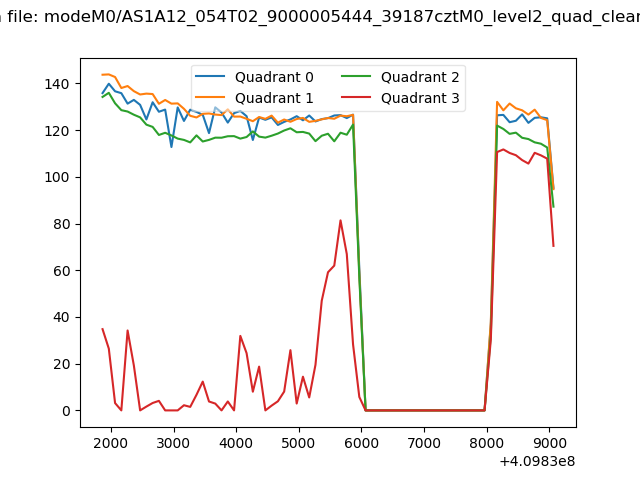 |
|
| Module-wise count rates for Quadrant A Data is divided into 100 sec bins |
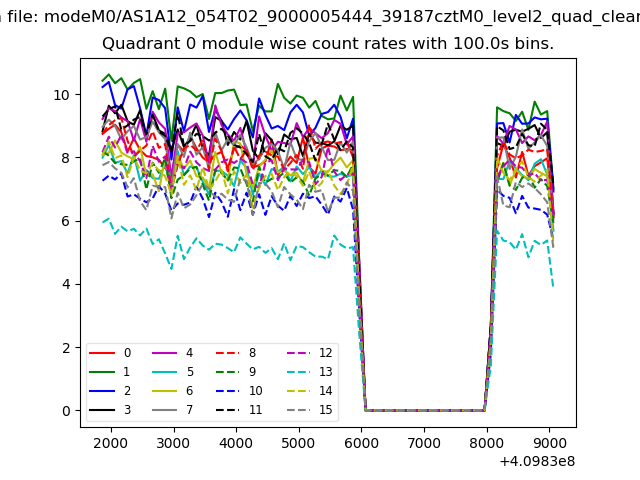 |
 |
| Module-wise count rates for Quadrant B Data is divided into 100 sec bins |
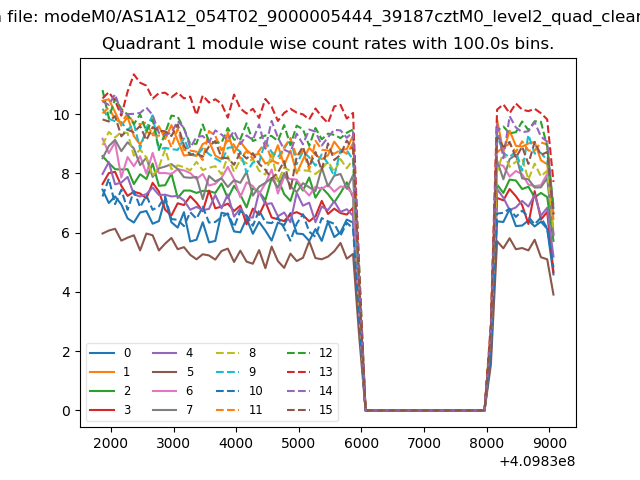 |
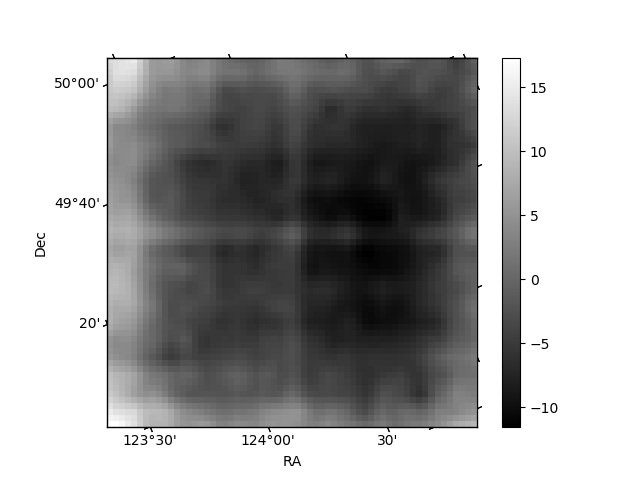 |
| Module-wise count rates for Quadrant C Data is divided into 100 sec bins |
 |
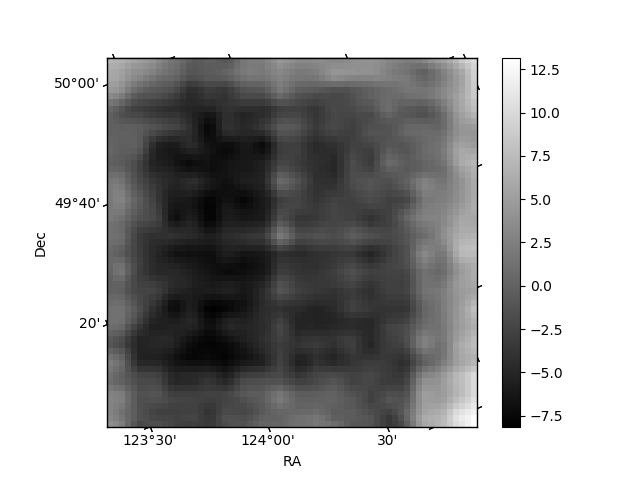 |
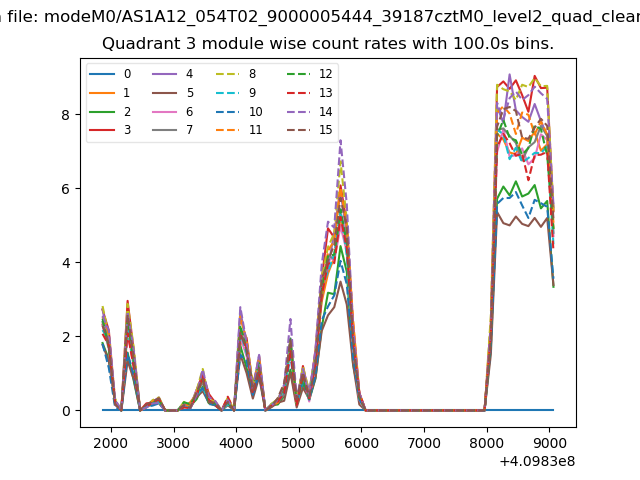
| Module-wise count rates for Quadrant D Data is divided into 100 sec bins |
 |
 |
| Parameter | Plot |
|---|---|
| CZT HV Monitor | 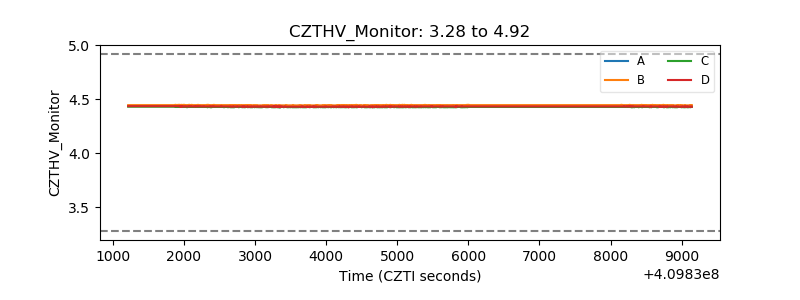 |
| D_VDD | 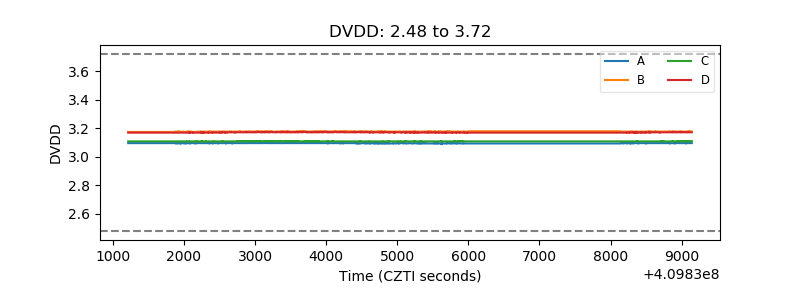 |
| Temperature 1 | 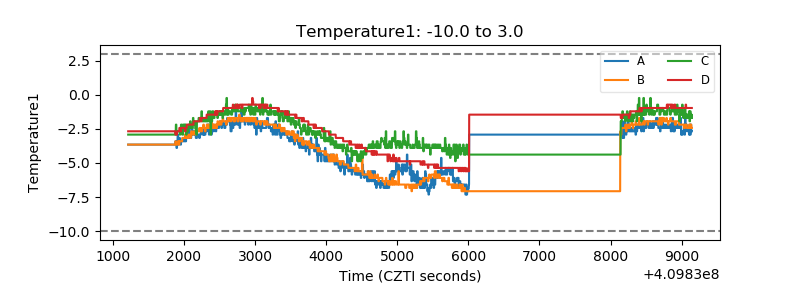 |
| Veto HV Monitor | 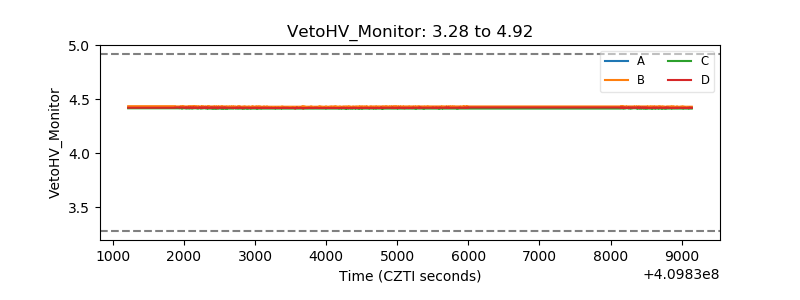 |
| Veto LLD | 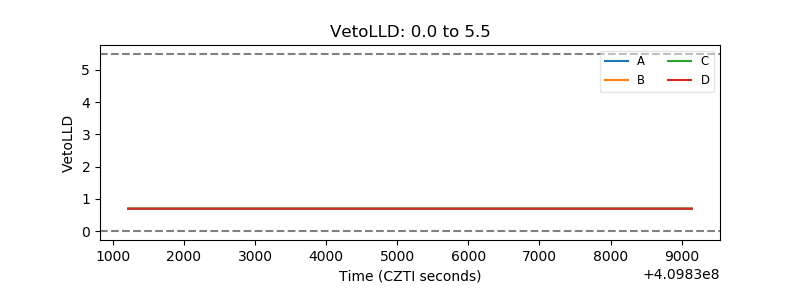 |
| Alpha Counter | 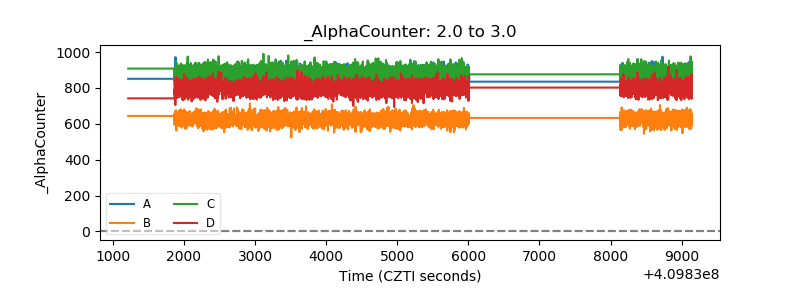 |
| _CPM_Rate | 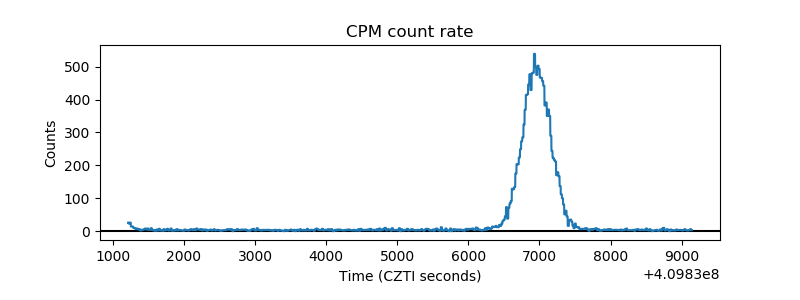 |
| CZT Counter | 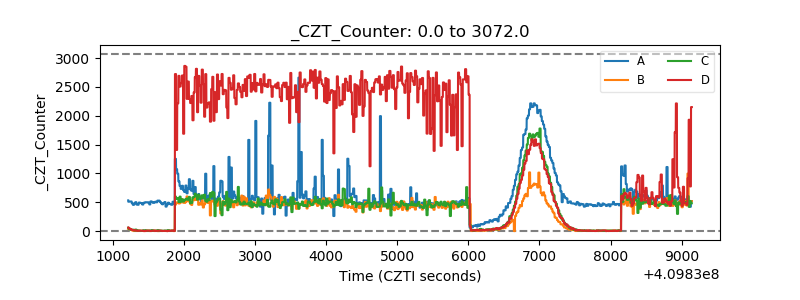 |
| +2.5 Volts monitor | 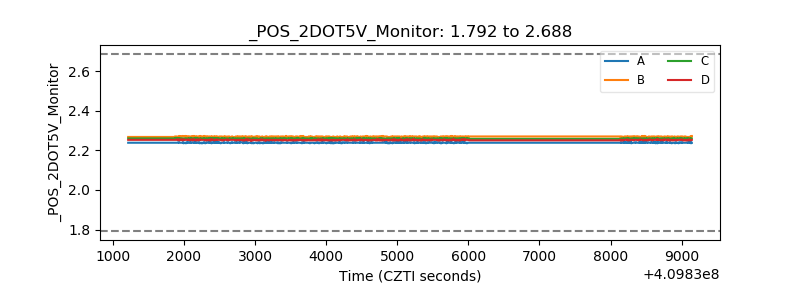 |
| +5 Volts monitor | 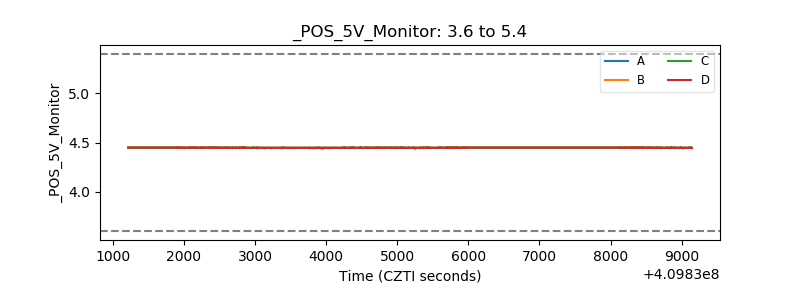 |
| _ROLL_ROT | 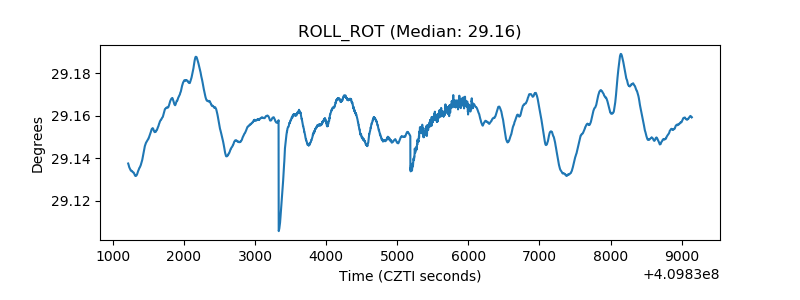 |
| _Roll_DEC |  |
| _Roll_RA | 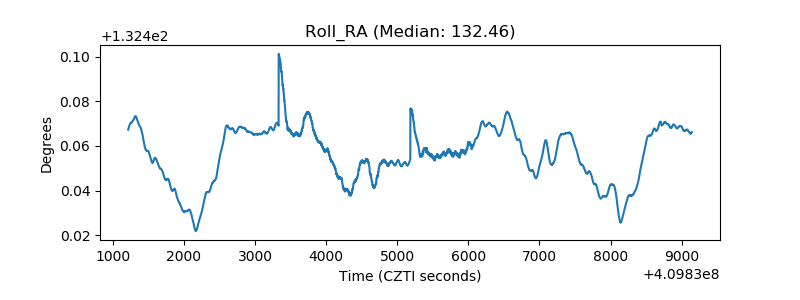 |
| Veto Counter | 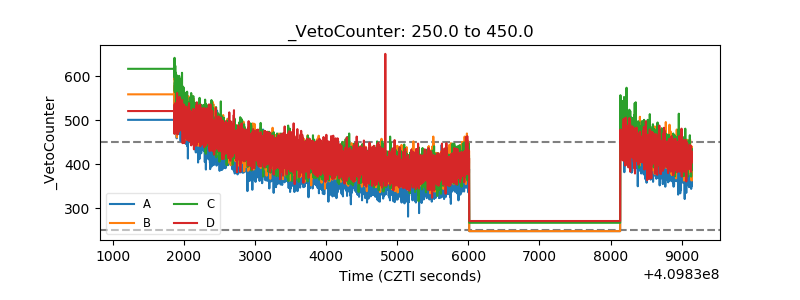 |