| Param | Original file | Final file |
|---|---|---|
| Filename | modeM0/AS1A12_054T02_9000005444_39188cztM0_level2.fits | modeM0/AS1A12_054T02_9000005444_39188cztM0_level2_quad_clean.evt |
| Size (bytes) | 423,817,920 | 86,664,960 |
| Size | 404.2 MB | 82.7 MB |
| Events in quadrant A | 2,883,423 | 622,021 |
| Events in quadrant B | 2,392,326 | 629,440 |
| Events in quadrant C | 2,570,457 | 583,857 |
| Events in quadrant D | 7,441,157 | 427,614 |
| Mode M9 | |||
|---|---|---|---|
| Quadrant | BADHDUFLAG | Total packets | Discarded packets |
| A | 0 | 31 | 0 |
| B | 0 | 31 | 0 |
| C | 0 | 31 | 0 |
| D | 0 | 32 | 0 |
| Mode M0 | |||
|---|---|---|---|
| Quadrant | BADHDUFLAG | Total packets | Discarded packets |
| A | 0 | 11783 | 3 |
| B | 0 | 10566 | 2 |
| C | 0 | 10747 | 2 |
| D | 0 | 25631 | 2 |
| Mode SS | |||
|---|---|---|---|
| Quadrant | BADHDUFLAG | Total packets | Discarded packets |
| A | 0 | 106 | 0 |
| B | 0 | 106 | 0 |
| C | 0 | 106 | 0 |
| D | 0 | 106 | 0 |
| Quadrant | Total seconds | Saturated seconds | Saturation percentage |
|---|---|---|---|
| A | 5152 | 71 | 1.378106% |
| B | 5152 | 7 | 0.135870% |
| C | 5152 | 15 | 0.291149% |
| D | 5152 | 1475 | 28.629658% |
Noise dominated data is calculated using 1-second bins in cleaned event files. If a bin has >2000 counts, and if more than 50% of those come from <1% of pixels, then it is considered to be noise-dominated and hence unusable.
| Quadrant | # 1 sec bins | Bins with >0 counts | Bins with >2000 counts | High rate bins dominated by noise | Noise dominated (total time) | Noise dominated (detector-on time) | Marked lightcurve |
|---|---|---|---|---|---|---|---|
| A | 7216 | 5153 | 37 | 37 | 0.51% | 0.72% | 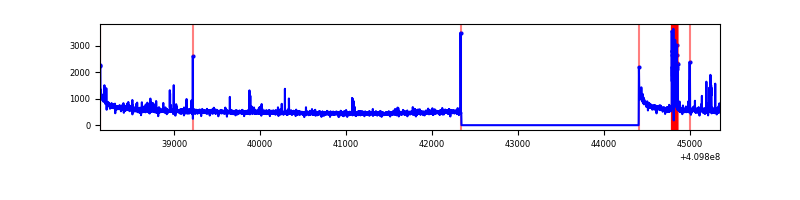 |
| B | 7216 | 5153 | 3 | 3 | 0.04% | 0.06% | 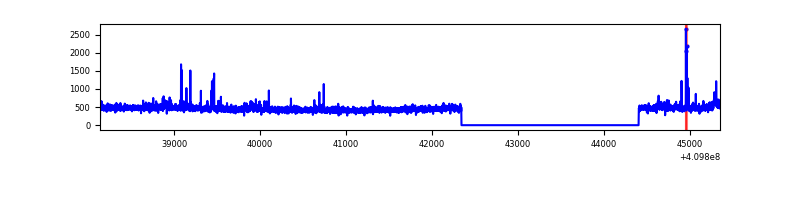 |
| C | 7216 | 5153 | 12 | 12 | 0.17% | 0.23% | 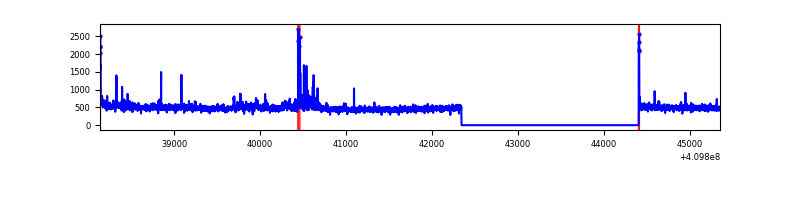 |
| D | 7216 | 5153 | 1321 | 1321 | 18.31% | 25.64% | 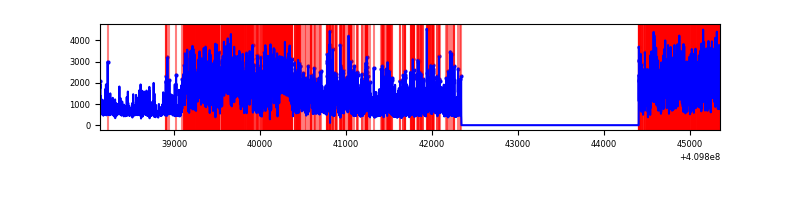 |
Top three noisy pixels from each quadrant. If the there are fewer than three noisy pixels in the level2.evt file, extra rows are filled as -1
| Pixel properties | Quadrant properties | ||||||
|---|---|---|---|---|---|---|---|
| Quadrant | DetID | PixID | Counts | Sigma | Mean | Median | Sigma |
| A | 10 | 83 | 434337 | 3677.71 | 583 | 572 | 117.9 |
| A | 13 | 248 | 127803 | 1078.74 | 583 | 572 | 117.9 |
| A | 9 | 143 | 52821 | 443.0 | 583 | 572 | 117.9 |
| B | 0 | 213 | 45819 | 408.13 | 579 | 564 | 110.9 |
| B | 5 | 184 | 31047 | 274.91 | 579 | 564 | 110.9 |
| B | 5 | 172 | 28352 | 250.61 | 579 | 564 | 110.9 |
| C | 15 | 214 | 217262 | 1659.0 | 565 | 569 | 130.6 |
| C | 9 | 187 | 122328 | 932.19 | 565 | 569 | 130.6 |
| C | 0 | 10 | 15358 | 113.22 | 565 | 569 | 130.6 |
| D | 12 | 235 | 4724393 | 38178.89 | 512 | 497 | 123.7 |
| D | 2 | 249 | 246601 | 1989.03 | 512 | 497 | 123.7 |
| D | 1 | 47 | 102242 | 822.31 | 512 | 497 | 123.7 |
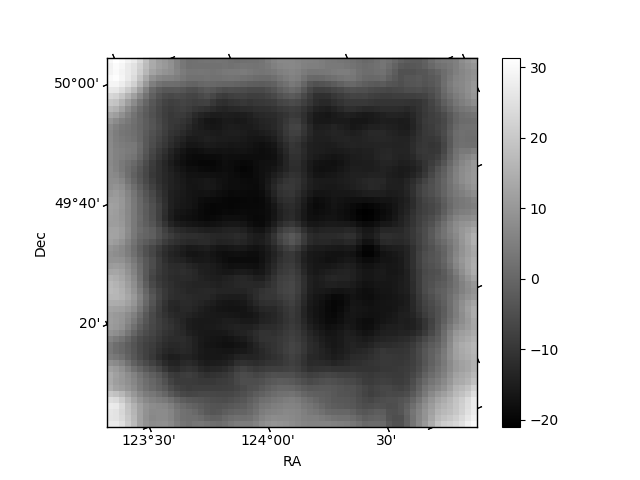
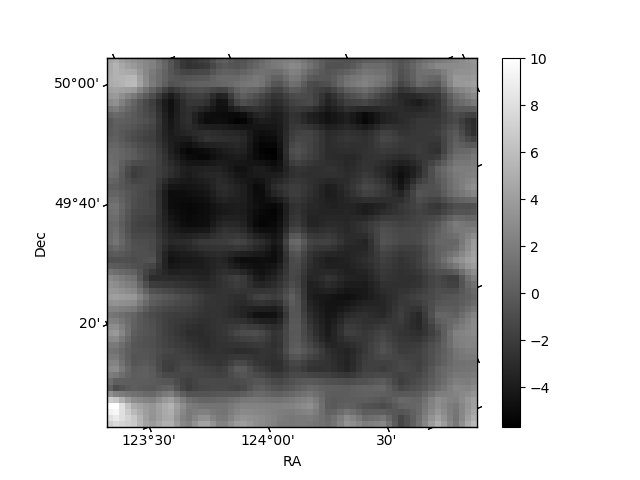
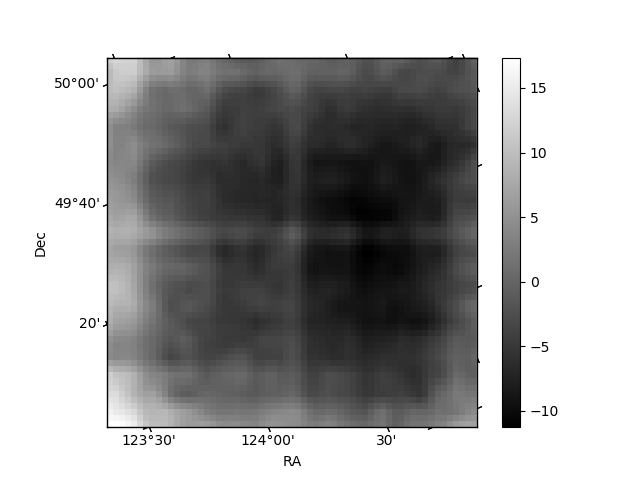
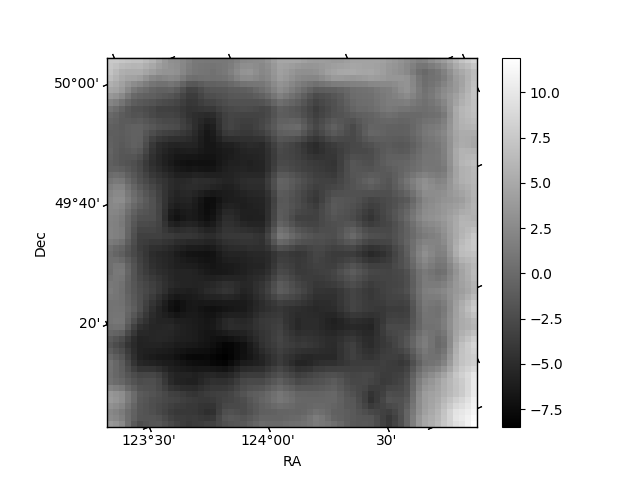
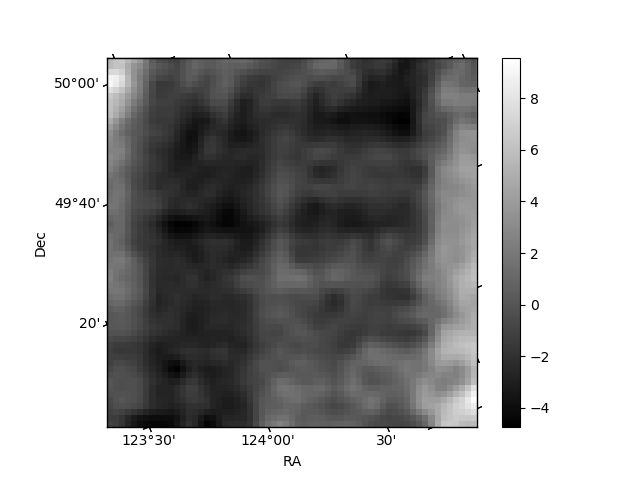
Histogram calculated using DETX and DETY for each event in the final _common_clean file
| Quadrant A | 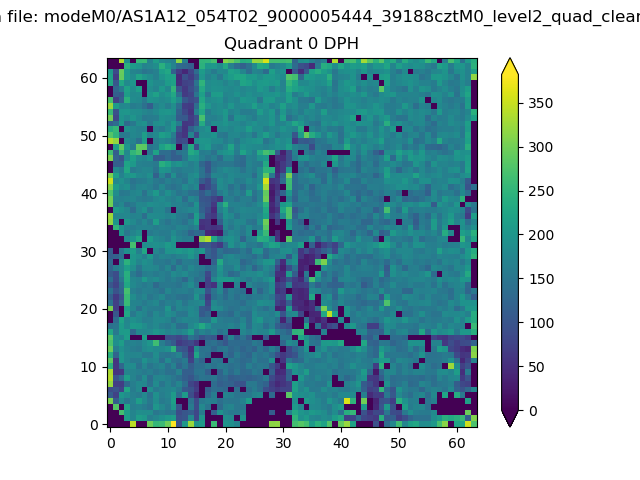 |
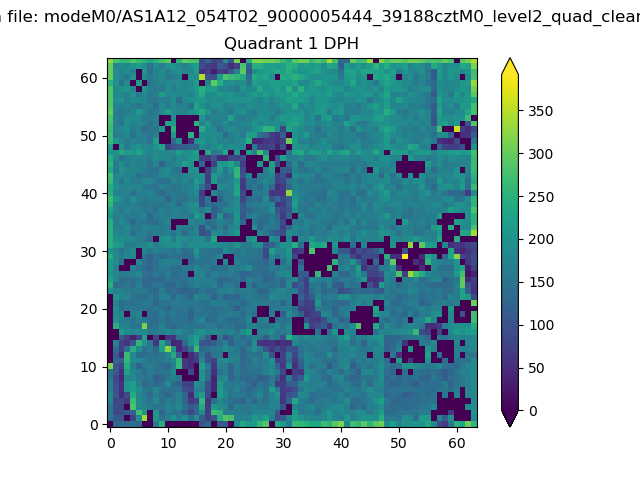 |
Quadrant B |
|---|---|---|---|
| Quadrant D | 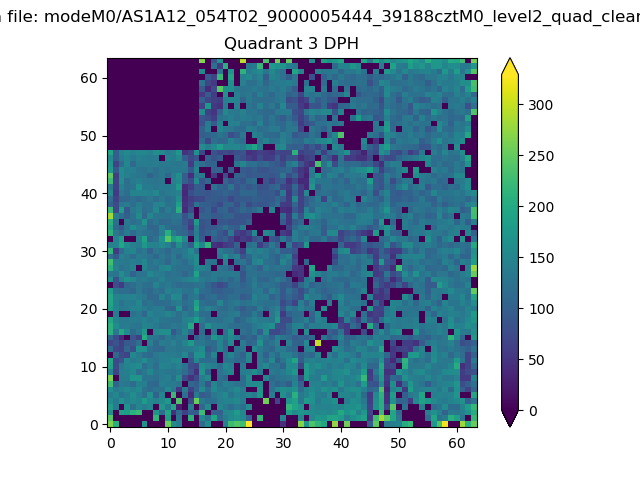 |
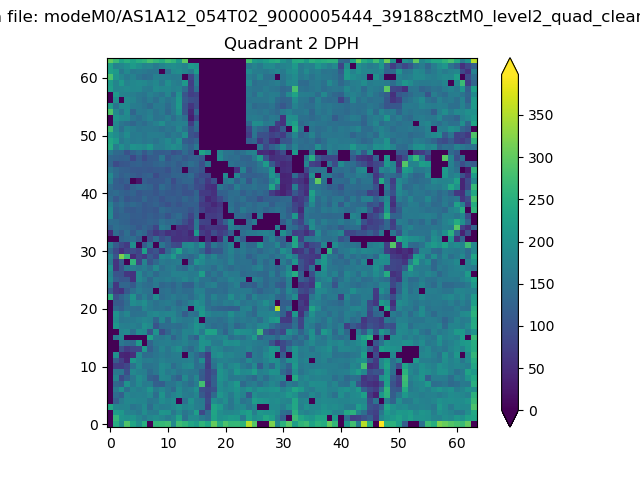 |
Quadrant C |
| Plot type | Count rate plots | Images |
|---|---|---|
| Comparison with Poisson distribution Blue bars denote a histogram of data divided into 1 sec bins. Red curve is a Poisson curve with rate = median count rate of data. |
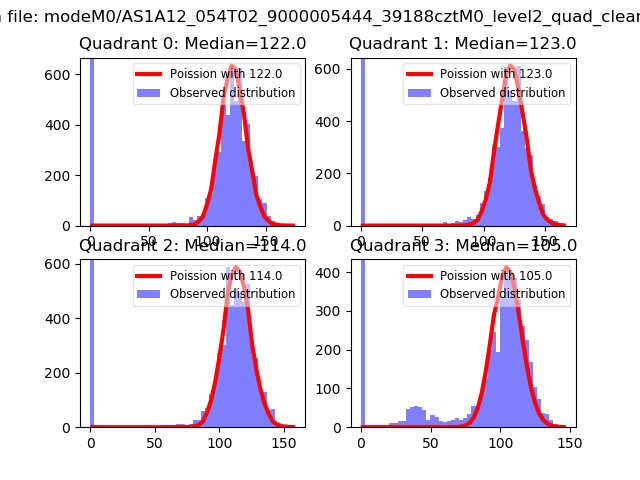 |
 |
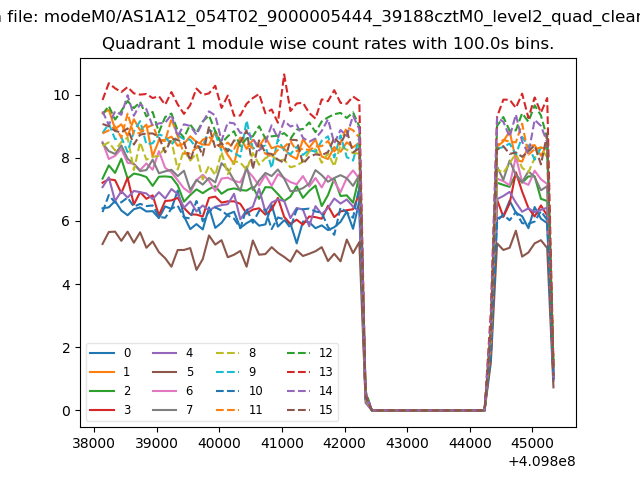
| Quadrant-wise count rates Data is divided into 100 sec bins |
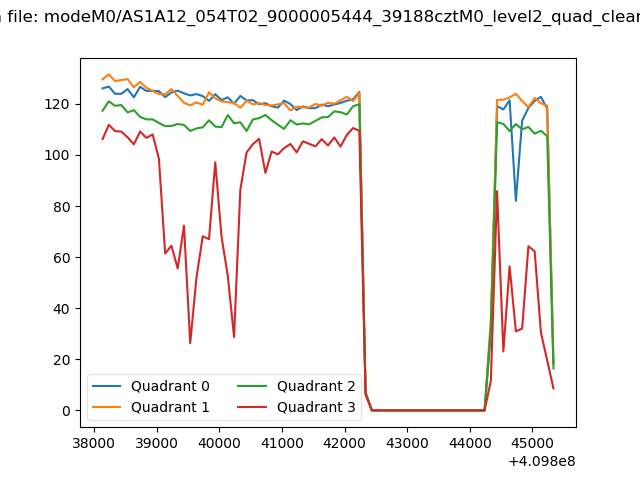 |
|
| Module-wise count rates for Quadrant A Data is divided into 100 sec bins |
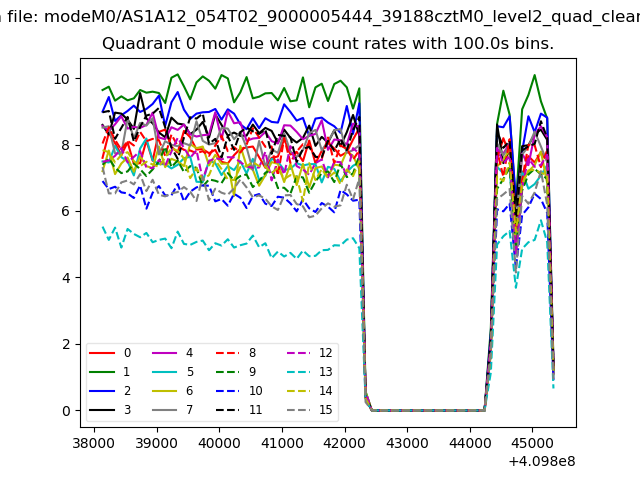 |
 |
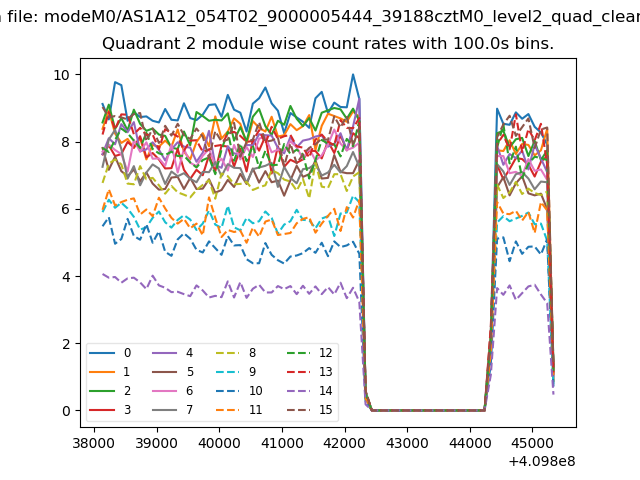
| Module-wise count rates for Quadrant B Data is divided into 100 sec bins |
 |
 |
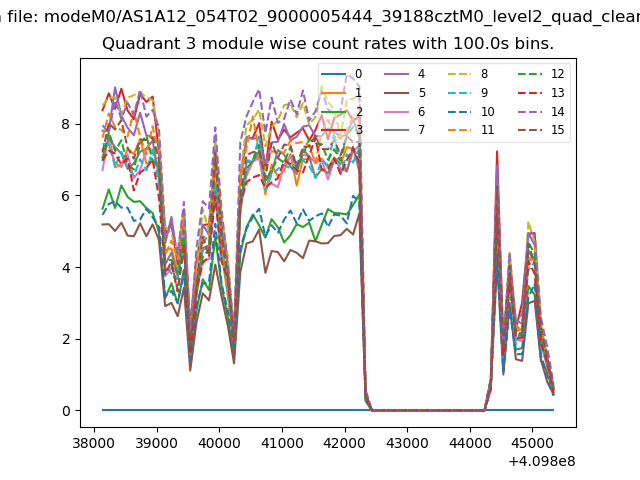
| Module-wise count rates for Quadrant C Data is divided into 100 sec bins |
 |
 |
| Module-wise count rates for Quadrant D Data is divided into 100 sec bins |
 |
 |
| Parameter | Plot |
|---|---|
| CZT HV Monitor | 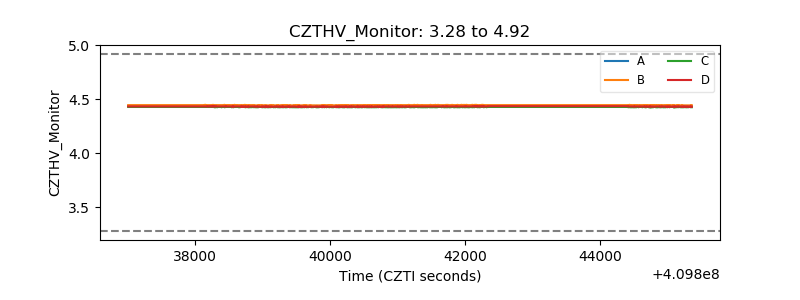 |
| D_VDD | 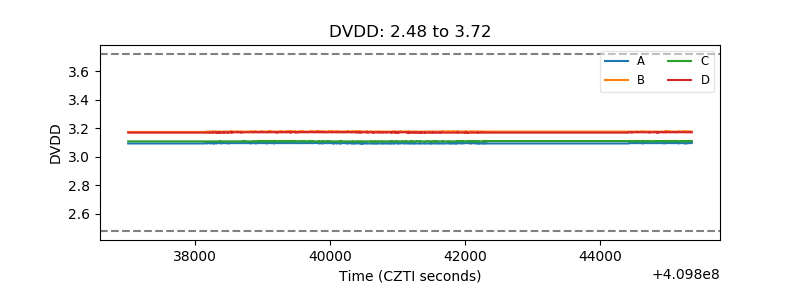 |
| Temperature 1 | 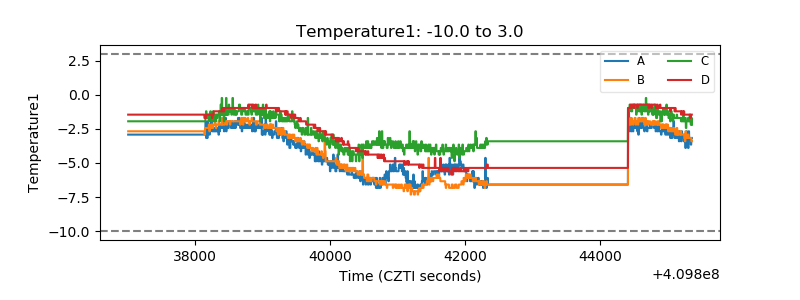 |
| Veto HV Monitor | 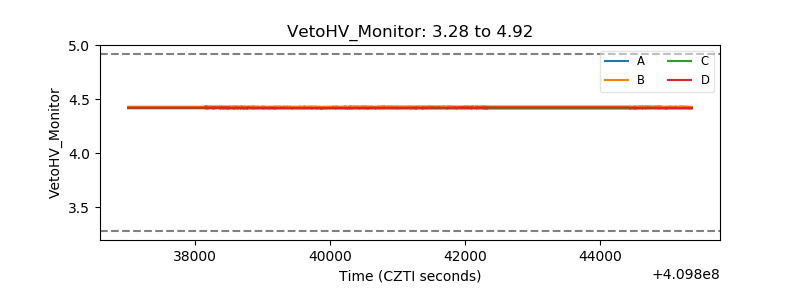 |
| Veto LLD | 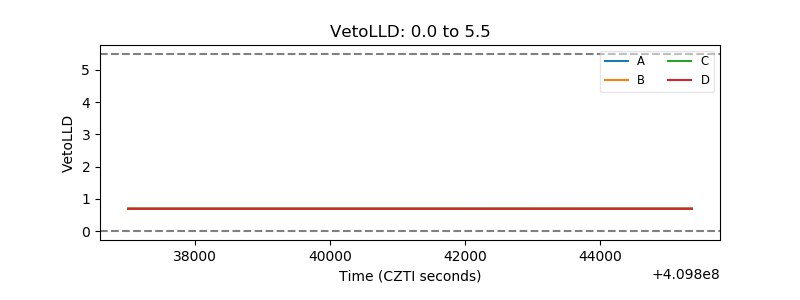 |
| Alpha Counter | 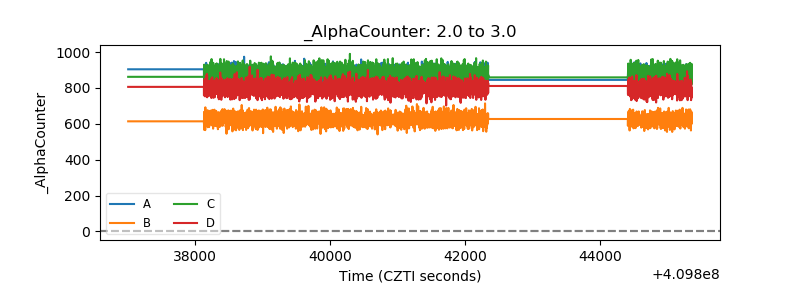 |
| _CPM_Rate | 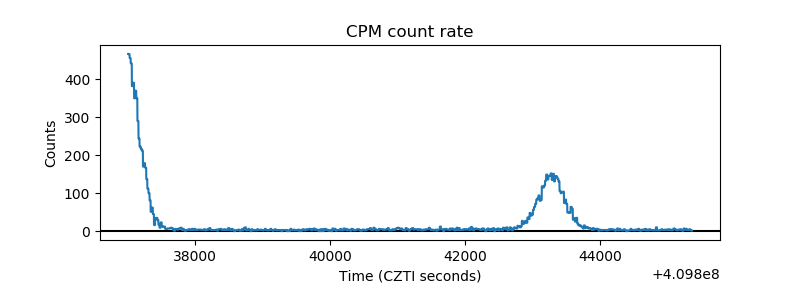 |
| CZT Counter | 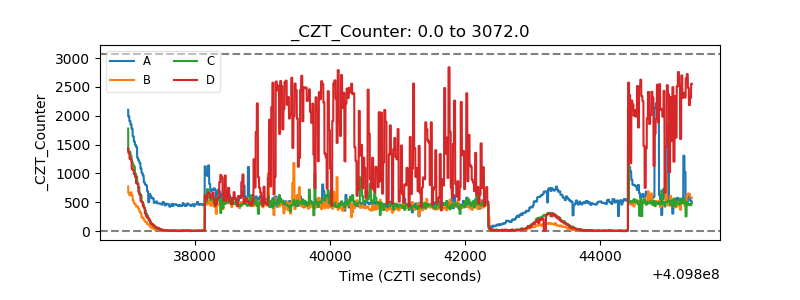 |
| +2.5 Volts monitor | 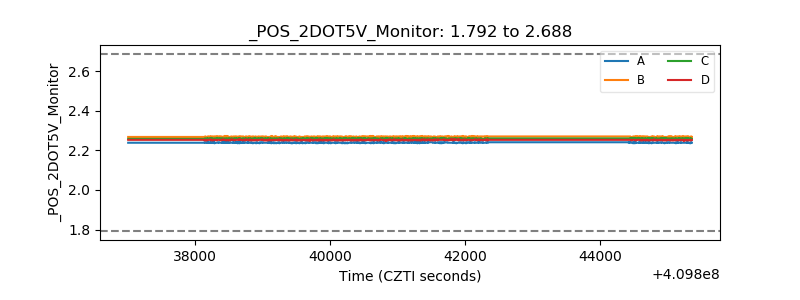 |
| +5 Volts monitor | 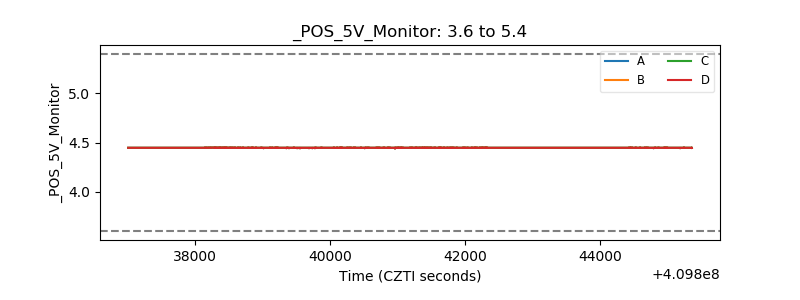 |
| _ROLL_ROT | 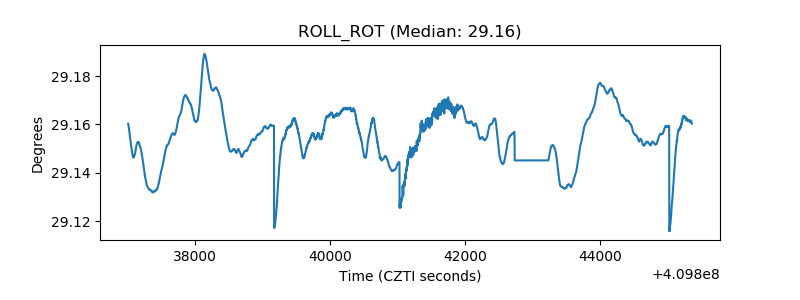 |
| _Roll_DEC | 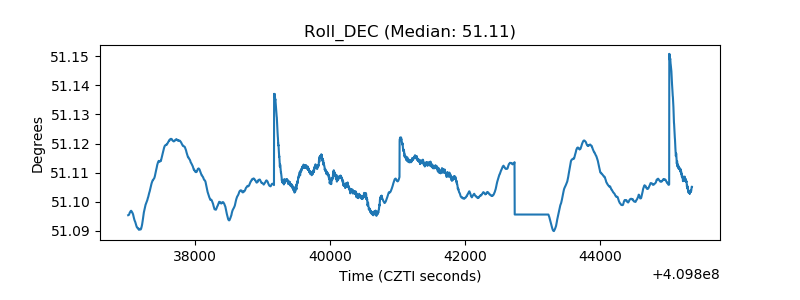 |
| _Roll_RA | 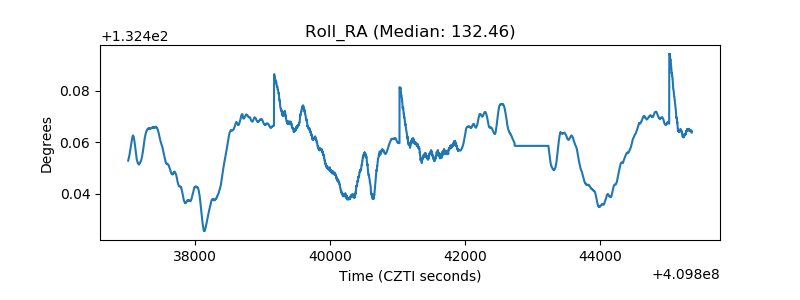 |
| Veto Counter | 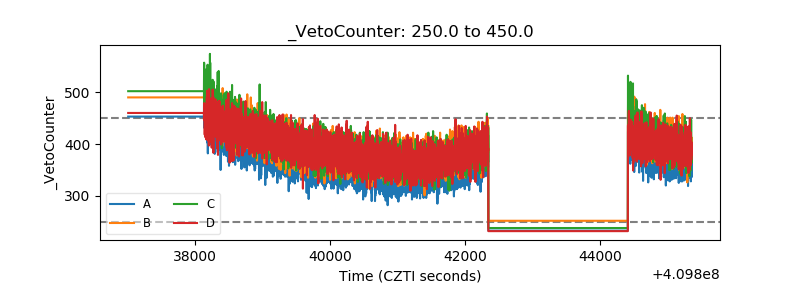 |