| Param | Original file | Final file |
|---|---|---|
| Filename | modeM0/AS1A12_054T02_9000005444_39190cztM0_level2.fits | modeM0/AS1A12_054T02_9000005444_39190cztM0_level2_quad_clean.evt |
| Size (bytes) | 505,992,960 | 85,844,160 |
| Size | 482.6 MB | 81.9 MB |
| Events in quadrant A | 2,811,249 | 632,040 |
| Events in quadrant B | 2,505,488 | 631,769 |
| Events in quadrant C | 2,718,309 | 594,548 |
| Events in quadrant D | 10,265,083 | 353,812 |
| Mode M9 | |||
|---|---|---|---|
| Quadrant | BADHDUFLAG | Total packets | Discarded packets |
| A | 0 | 29 | 0 |
| B | 0 | 29 | 0 |
| C | 0 | 29 | 0 |
| D | 0 | 30 | 0 |
| Mode M0 | |||
|---|---|---|---|
| Quadrant | BADHDUFLAG | Total packets | Discarded packets |
| A | 0 | 11901 | 3 |
| B | 0 | 11414 | 2 |
| C | 0 | 11656 | 2 |
| D | 0 | 34314 | 2 |
| Mode SS | |||
|---|---|---|---|
| Quadrant | BADHDUFLAG | Total packets | Discarded packets |
| A | 0 | 112 | 0 |
| B | 0 | 112 | 0 |
| C | 0 | 112 | 0 |
| D | 0 | 112 | 0 |
| Quadrant | Total seconds | Saturated seconds | Saturation percentage |
|---|---|---|---|
| A | 5529 | 11 | 0.198951% |
| B | 5529 | 15 | 0.271297% |
| C | 5529 | 24 | 0.434075% |
| D | 5529 | 2512 | 45.433171% |
Noise dominated data is calculated using 1-second bins in cleaned event files. If a bin has >2000 counts, and if more than 50% of those come from <1% of pixels, then it is considered to be noise-dominated and hence unusable.
| Quadrant | # 1 sec bins | Bins with >0 counts | Bins with >2000 counts | High rate bins dominated by noise | Noise dominated (total time) | Noise dominated (detector-on time) | Marked lightcurve |
|---|---|---|---|---|---|---|---|
| A | 7023 | 5530 | 8 | 8 | 0.11% | 0.14% | 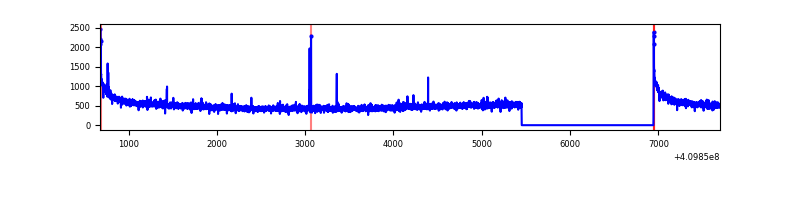 |
| B | 7023 | 5530 | 6 | 6 | 0.09% | 0.11% | 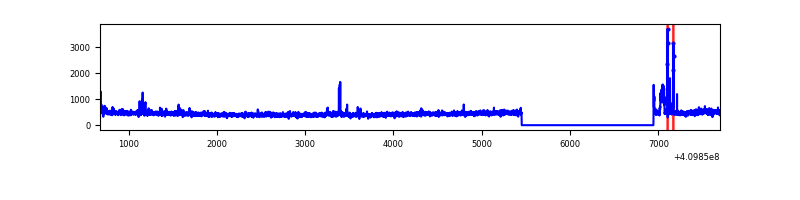 |
| C | 7023 | 5530 | 19 | 19 | 0.27% | 0.34% | 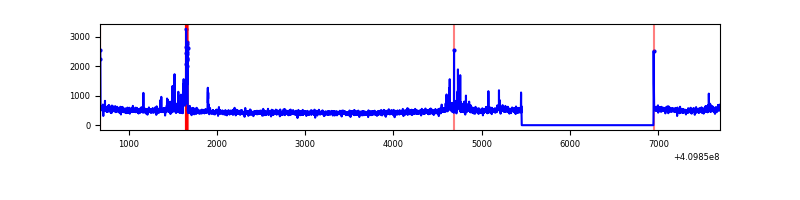 |
| D | 7023 | 5530 | 2339 | 2339 | 33.30% | 42.30% | 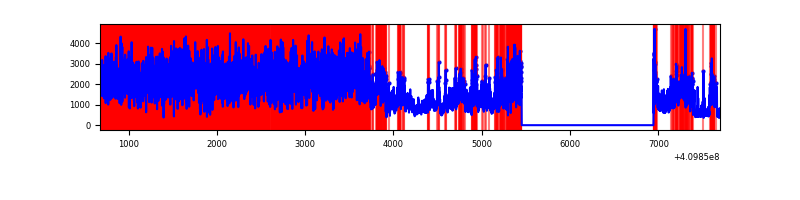 |
Top three noisy pixels from each quadrant. If the there are fewer than three noisy pixels in the level2.evt file, extra rows are filled as -1
| Pixel properties | Quadrant properties | ||||||
|---|---|---|---|---|---|---|---|
| Quadrant | DetID | PixID | Counts | Sigma | Mean | Median | Sigma |
| A | 10 | 83 | 445990 | 3635.05 | 602 | 590 | 122.5 |
| A | 2 | 79 | 16319 | 128.37 | 602 | 590 | 122.5 |
| A | 13 | 254 | 7329 | 55.0 | 602 | 590 | 122.5 |
| B | 5 | 172 | 80543 | 693.49 | 597 | 580 | 115.3 |
| B | 0 | 213 | 38877 | 332.13 | 597 | 580 | 115.3 |
| B | 5 | 184 | 33202 | 282.92 | 597 | 580 | 115.3 |
| C | 15 | 214 | 232583 | 1688.7 | 584 | 586 | 137.4 |
| C | 9 | 187 | 186184 | 1350.96 | 584 | 586 | 137.4 |
| C | 0 | 10 | 12900 | 89.63 | 584 | 586 | 137.4 |
| D | 12 | 235 | 7182915 | 57811.34 | 504 | 488 | 124.2 |
| D | 5 | 222 | 690920 | 5557.29 | 504 | 488 | 124.2 |
| D | 2 | 249 | 210560 | 1690.87 | 504 | 488 | 124.2 |
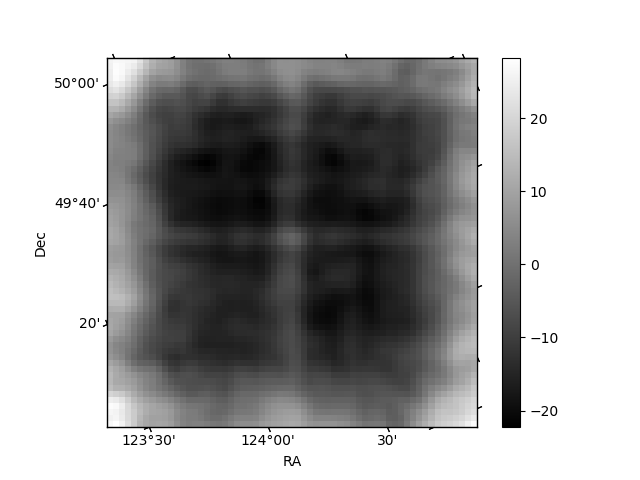
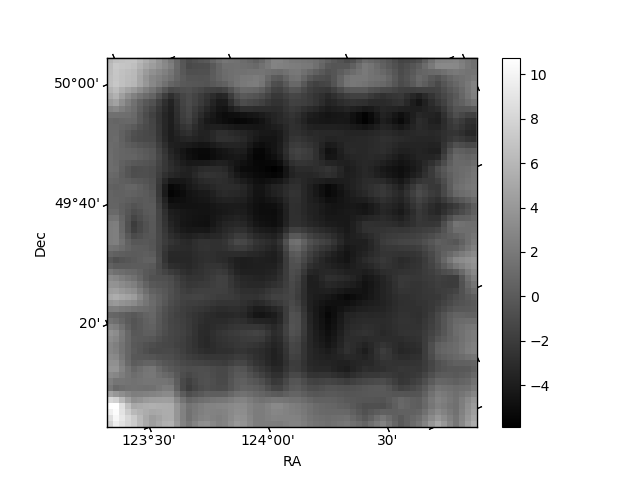
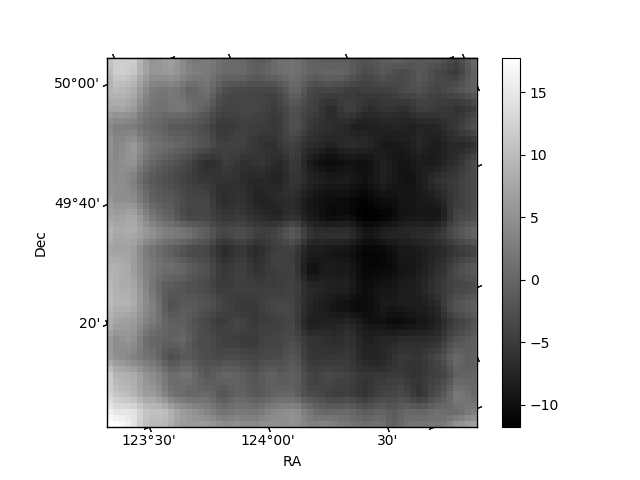
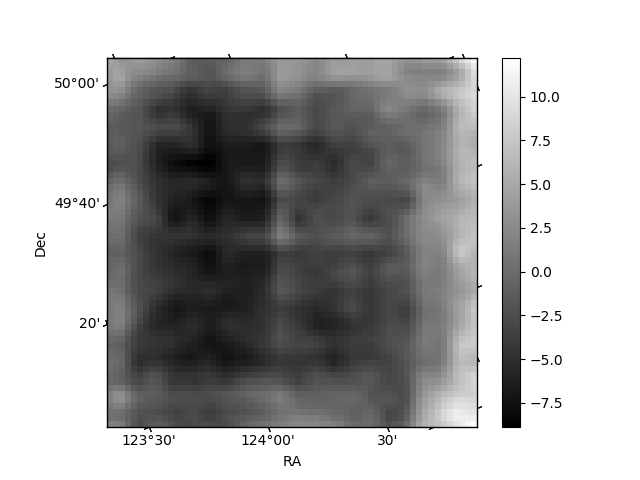
Histogram calculated using DETX and DETY for each event in the final _common_clean file
| Quadrant A | 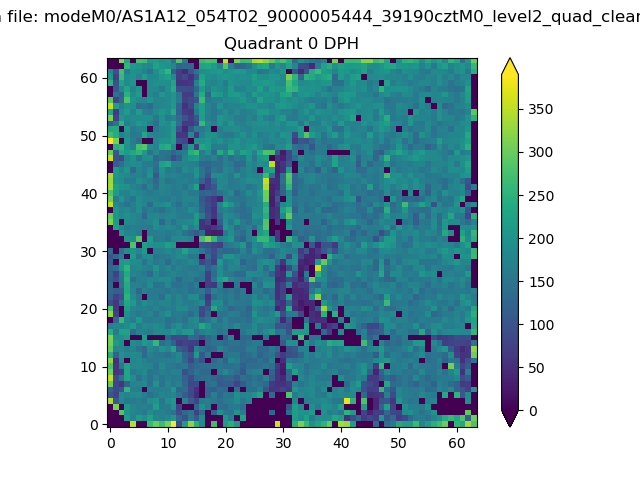 |
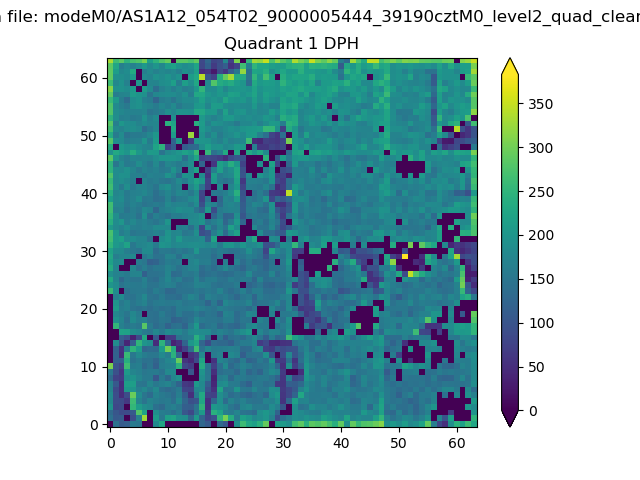 |
Quadrant B |
|---|---|---|---|
| Quadrant D |  |
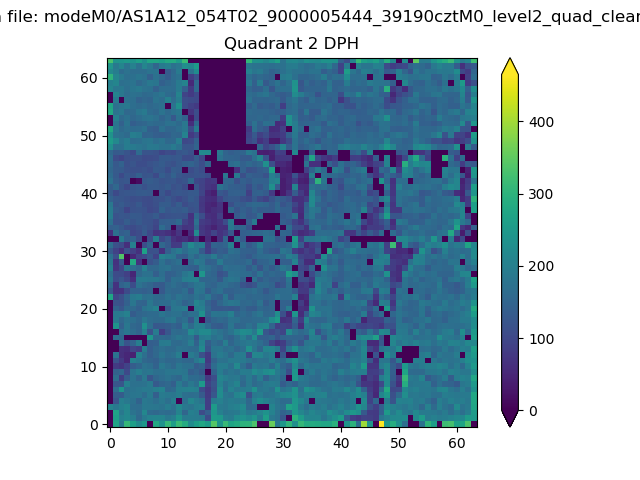 |
Quadrant C |
| Plot type | Count rate plots | Images |
|---|---|---|
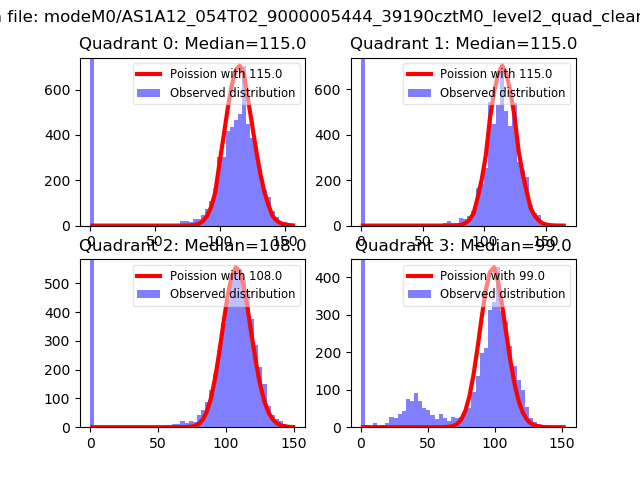
| Comparison with Poisson distribution Blue bars denote a histogram of data divided into 1 sec bins. Red curve is a Poisson curve with rate = median count rate of data. |
 |
 |
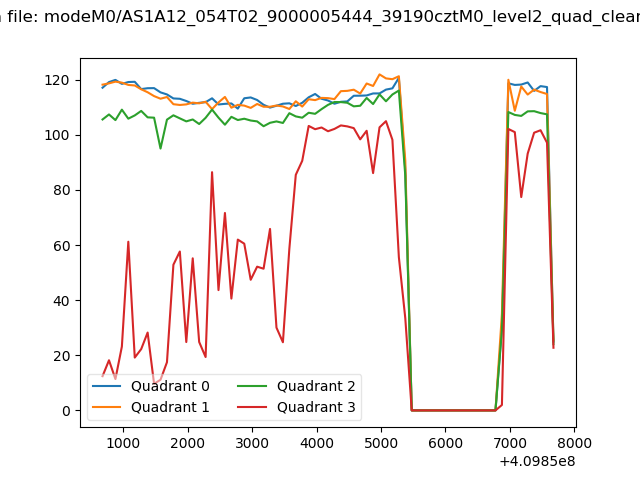
| Quadrant-wise count rates Data is divided into 100 sec bins |
 |
|
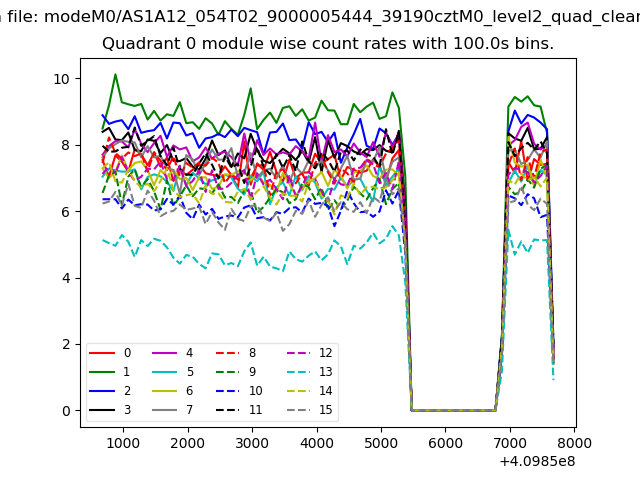
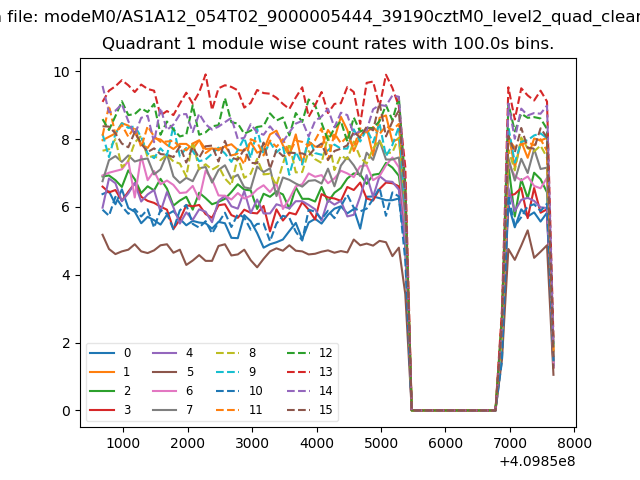
| Module-wise count rates for Quadrant A Data is divided into 100 sec bins |
 |
 |
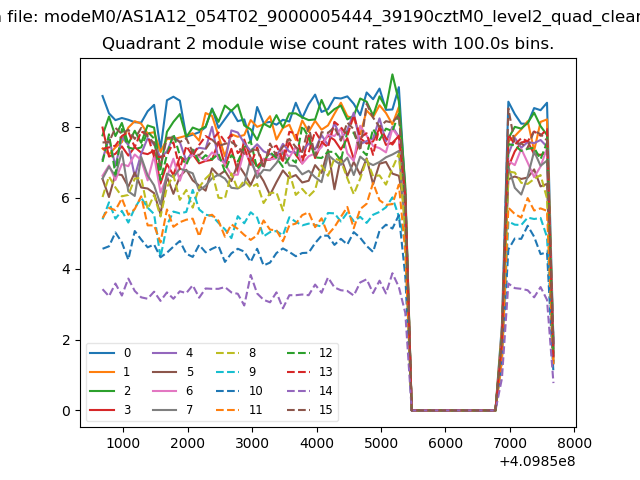
| Module-wise count rates for Quadrant B Data is divided into 100 sec bins |
 |
 |
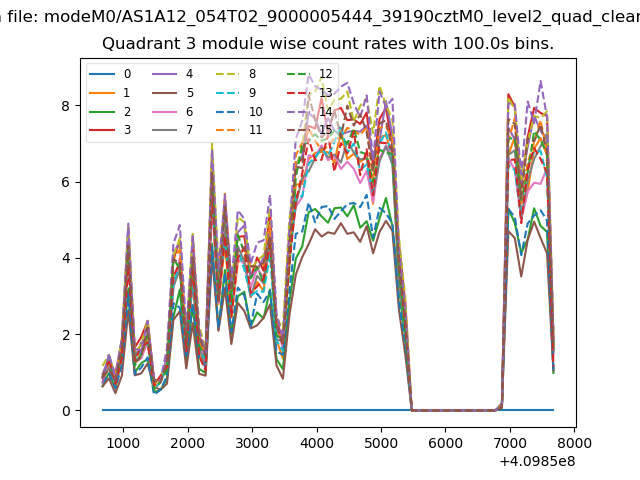
| Module-wise count rates for Quadrant C Data is divided into 100 sec bins |
 |
 |
| Module-wise count rates for Quadrant D Data is divided into 100 sec bins |
 |
 |
| Parameter | Plot |
|---|---|
| CZT HV Monitor | 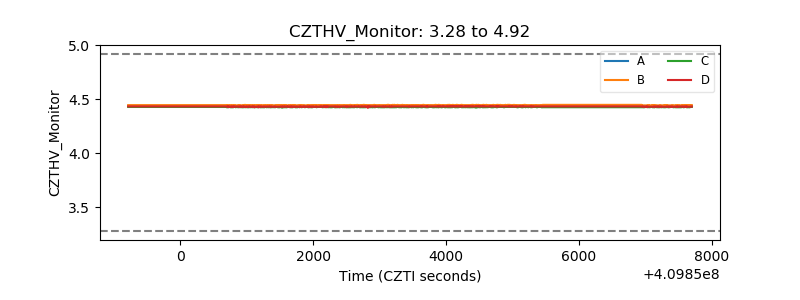 |
| D_VDD | 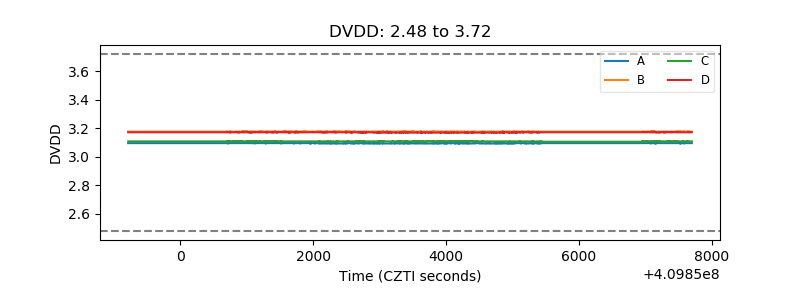 |
| Temperature 1 | 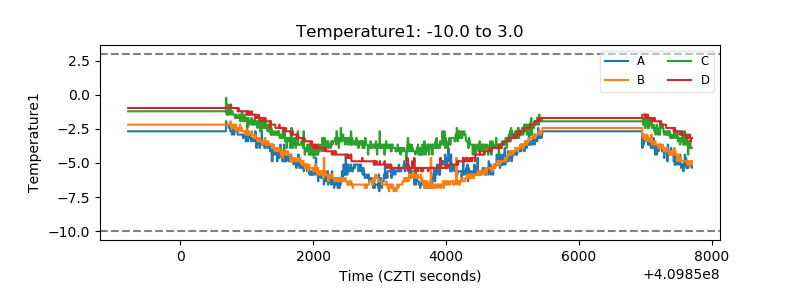 |
| Veto HV Monitor | 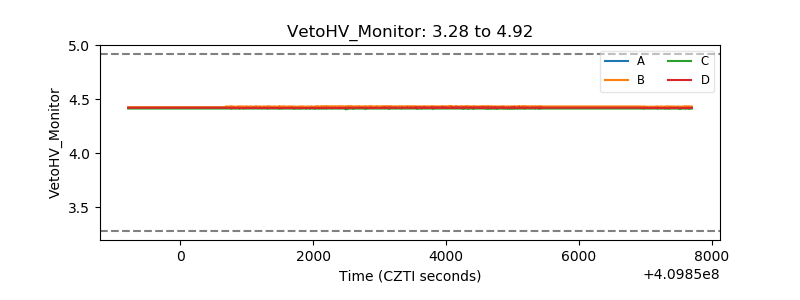 |
| Veto LLD | 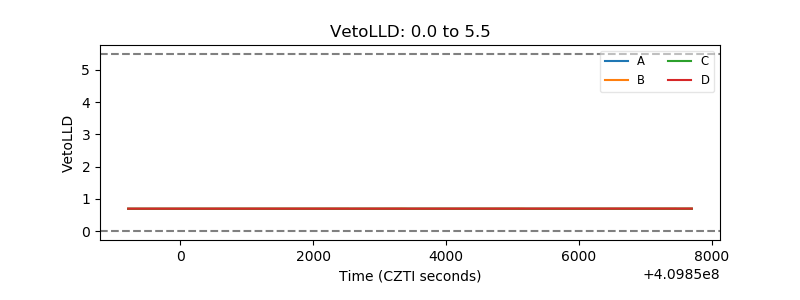 |
| Alpha Counter | 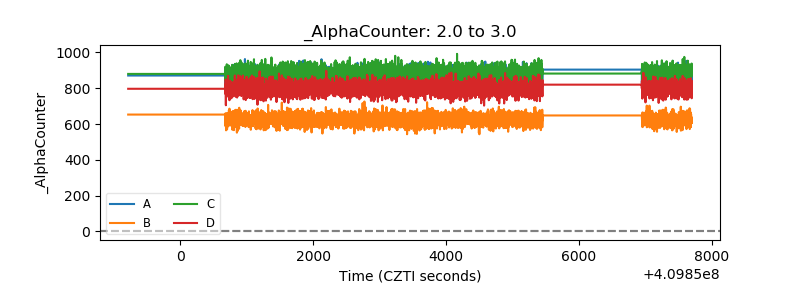 |
| _CPM_Rate | 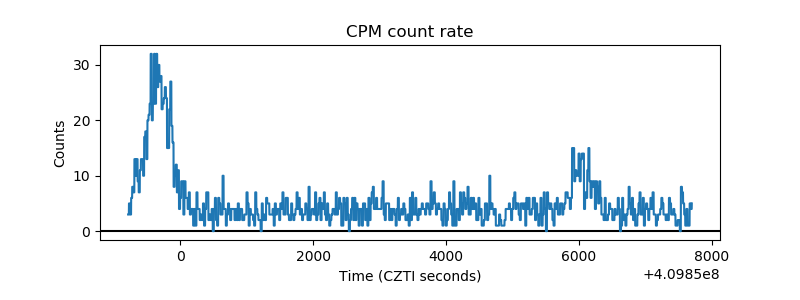 |
| CZT Counter | 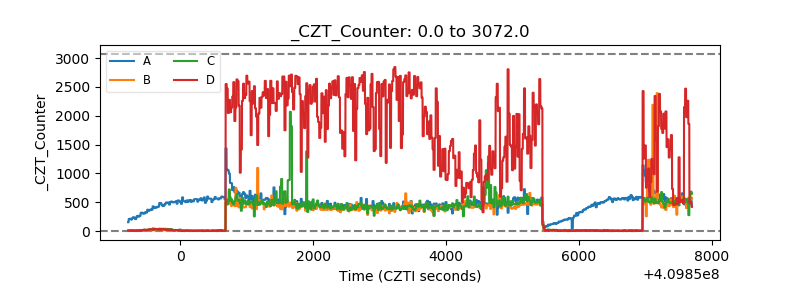 |
| +2.5 Volts monitor | 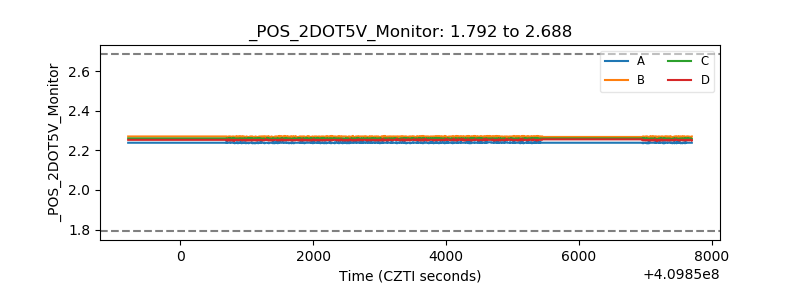 |
| +5 Volts monitor |  |
| _ROLL_ROT | 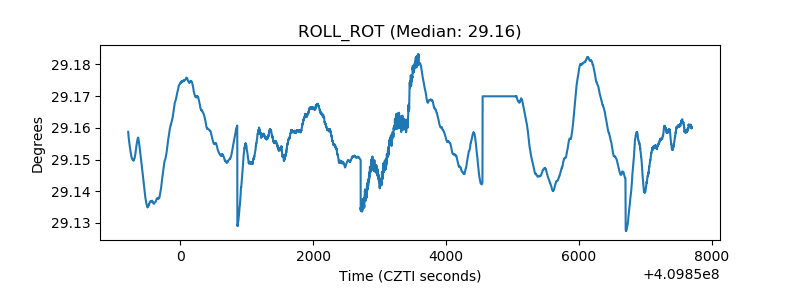 |
| _Roll_DEC | 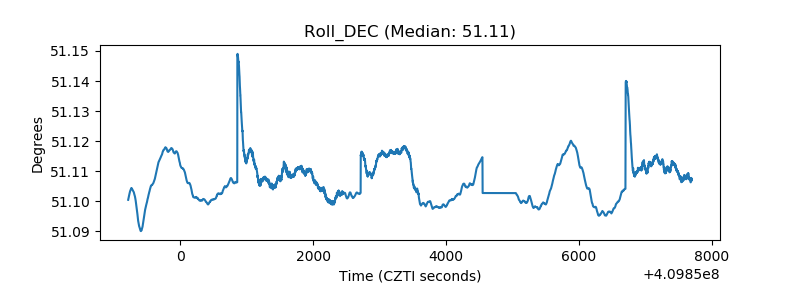 |
| _Roll_RA | 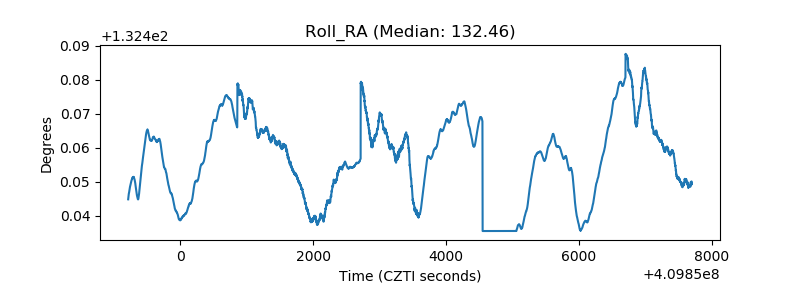 |
| Veto Counter | 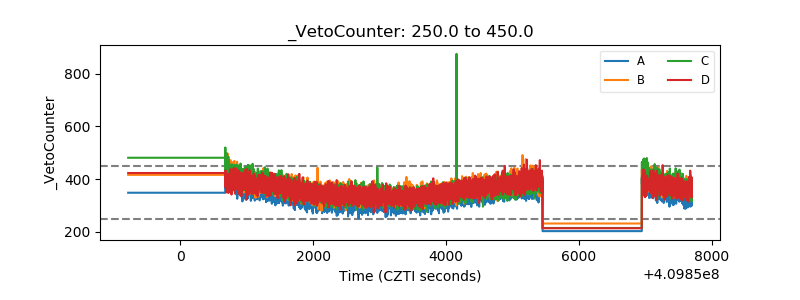 |