| Param | Original file | Final file |
|---|---|---|
| Filename | modeM0/AS1A12_054T02_9000005444_39191cztM0_level2.fits | modeM0/AS1A12_054T02_9000005444_39191cztM0_level2_quad_clean.evt |
| Size (bytes) | 486,138,240 | 100,183,680 |
| Size | 463.6 MB | 95.5 MB |
| Events in quadrant A | 3,212,088 | 700,129 |
| Events in quadrant B | 2,752,562 | 704,483 |
| Events in quadrant C | 3,392,601 | 661,741 |
| Events in quadrant D | 8,156,399 | 534,121 |
| Mode M9 | |||
|---|---|---|---|
| Quadrant | BADHDUFLAG | Total packets | Discarded packets |
| A | 0 | 28 | 0 |
| B | 0 | 28 | 0 |
| C | 0 | 28 | 0 |
| D | 0 | 28 | 0 |
| Mode M0 | |||
|---|---|---|---|
| Quadrant | BADHDUFLAG | Total packets | Discarded packets |
| A | 0 | 13453 | 3 |
| B | 0 | 12666 | 2 |
| C | 0 | 14088 | 2 |
| D | 0 | 28583 | 2 |
| Mode SS | |||
|---|---|---|---|
| Quadrant | BADHDUFLAG | Total packets | Discarded packets |
| A | 0 | 128 | 0 |
| B | 0 | 128 | 0 |
| C | 0 | 128 | 0 |
| D | 0 | 128 | 0 |
| Quadrant | Total seconds | Saturated seconds | Saturation percentage |
|---|---|---|---|
| A | 6200 | 21 | 0.338710% |
| B | 6200 | 16 | 0.258065% |
| C | 6200 | 95 | 1.532258% |
| D | 6200 | 1226 | 19.774194% |
Noise dominated data is calculated using 1-second bins in cleaned event files. If a bin has >2000 counts, and if more than 50% of those come from <1% of pixels, then it is considered to be noise-dominated and hence unusable.
| Quadrant | # 1 sec bins | Bins with >0 counts | Bins with >2000 counts | High rate bins dominated by noise | Noise dominated (total time) | Noise dominated (detector-on time) | Marked lightcurve |
|---|---|---|---|---|---|---|---|
| A | 9007 | 6202 | 12 | 12 | 0.13% | 0.19% | 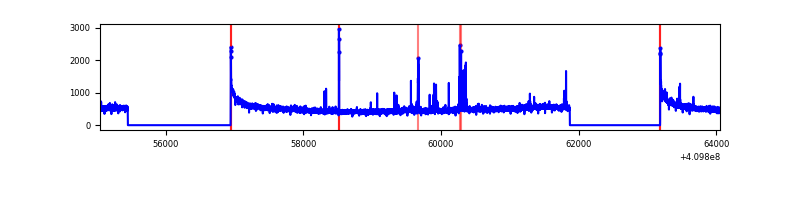 |
| B | 9007 | 6202 | 7 | 7 | 0.08% | 0.11% | 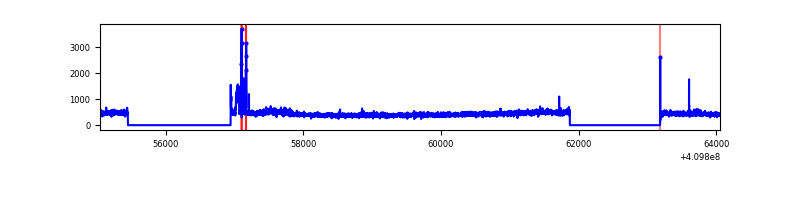 |
| C | 9007 | 6202 | 76 | 76 | 0.84% | 1.23% | 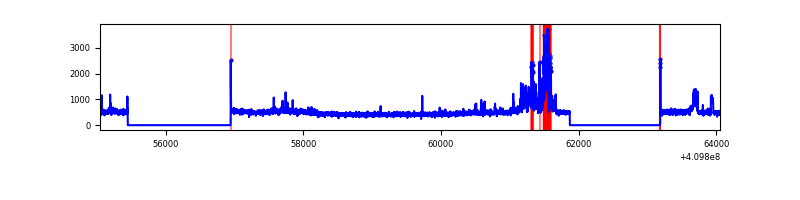 |
| D | 9007 | 6202 | 1065 | 1065 | 11.82% | 17.17% | 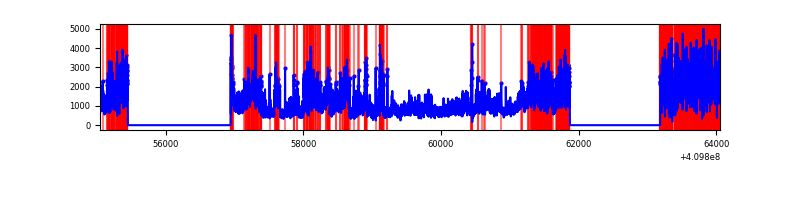 |
Top three noisy pixels from each quadrant. If the there are fewer than three noisy pixels in the level2.evt file, extra rows are filled as -1
| Pixel properties | Quadrant properties | ||||||
|---|---|---|---|---|---|---|---|
| Quadrant | DetID | PixID | Counts | Sigma | Mean | Median | Sigma |
| A | 10 | 83 | 476606 | 3464.57 | 678 | 664 | 137.4 |
| A | 9 | 143 | 68280 | 492.2 | 678 | 664 | 137.4 |
| A | 2 | 79 | 27831 | 197.76 | 678 | 664 | 137.4 |
| B | 5 | 172 | 71827 | 546.73 | 671 | 653 | 130.2 |
| B | 0 | 213 | 34316 | 258.59 | 671 | 653 | 130.2 |
| B | 12 | 111 | 16232 | 119.67 | 671 | 653 | 130.2 |
| C | 9 | 187 | 553887 | 3608.66 | 653 | 655 | 153.3 |
| C | 15 | 214 | 256981 | 1671.98 | 653 | 655 | 153.3 |
| C | 0 | 10 | 13664 | 84.86 | 653 | 655 | 153.3 |
| D | 12 | 235 | 4334810 | 29083.48 | 611 | 591 | 149.0 |
| D | 12 | 227 | 620443 | 4159.33 | 611 | 591 | 149.0 |
| D | 2 | 249 | 408366 | 2736.25 | 611 | 591 | 149.0 |
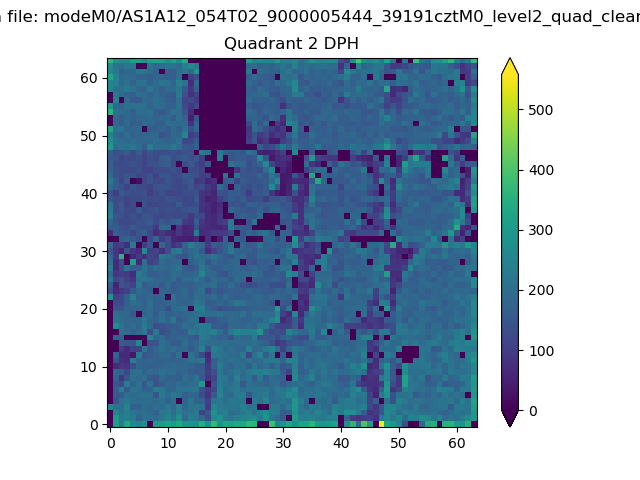
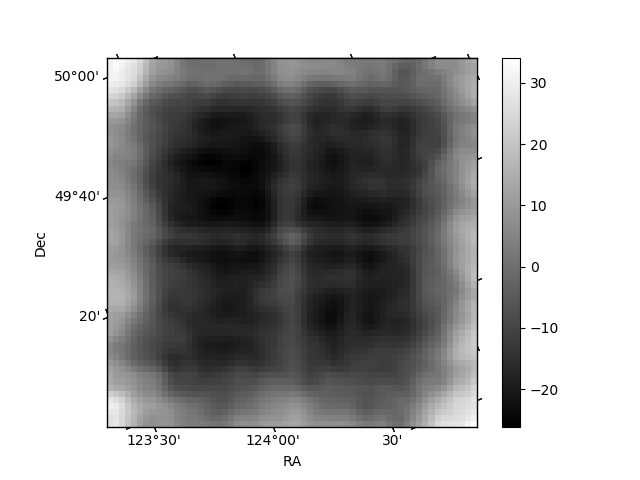
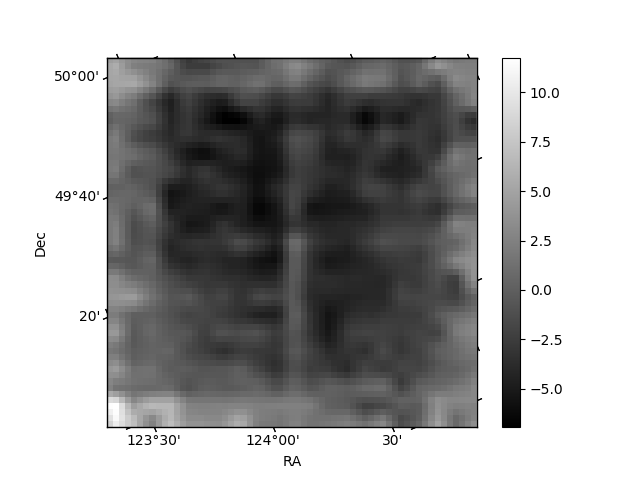
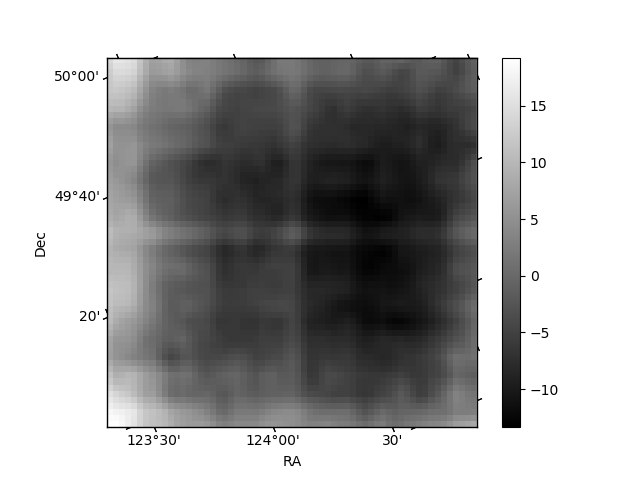
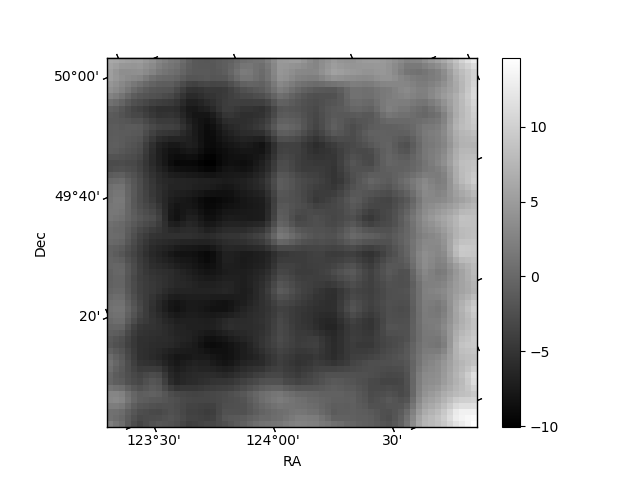
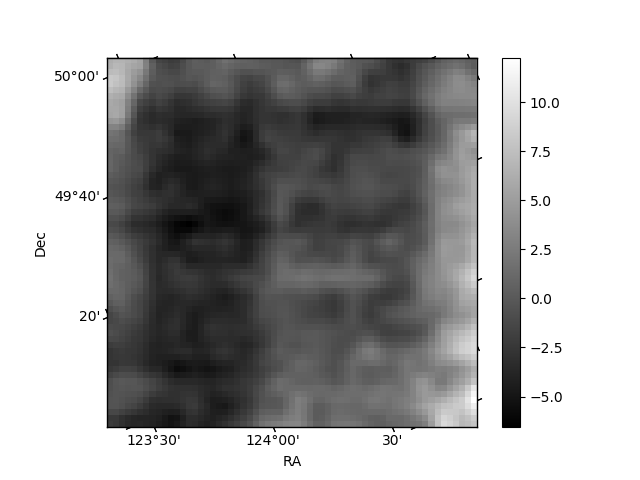
Histogram calculated using DETX and DETY for each event in the final _common_clean file
| Quadrant A | 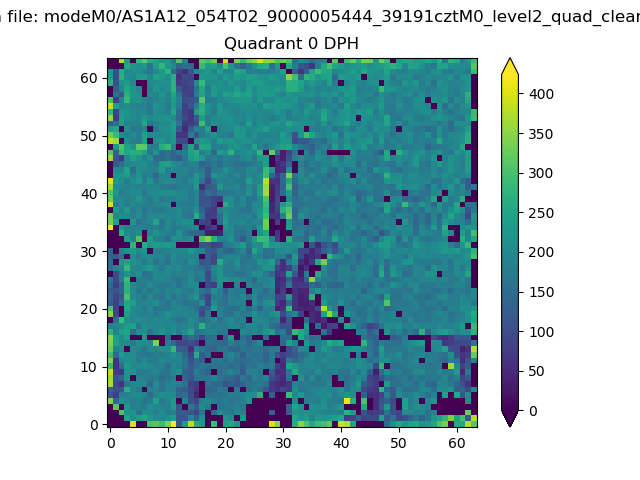 |
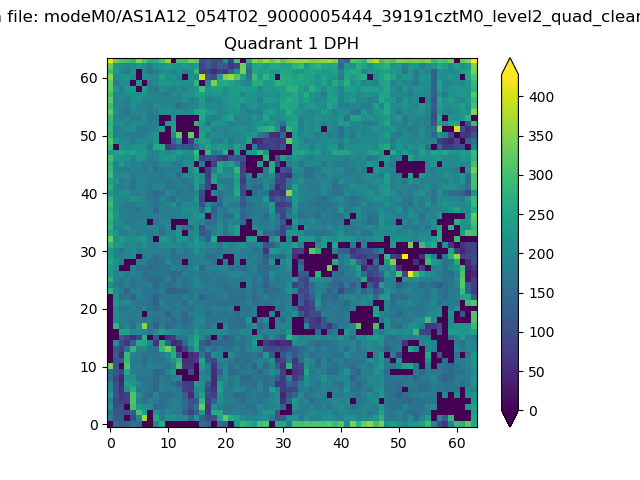 |
Quadrant B |
|---|---|---|---|
| Quadrant D | 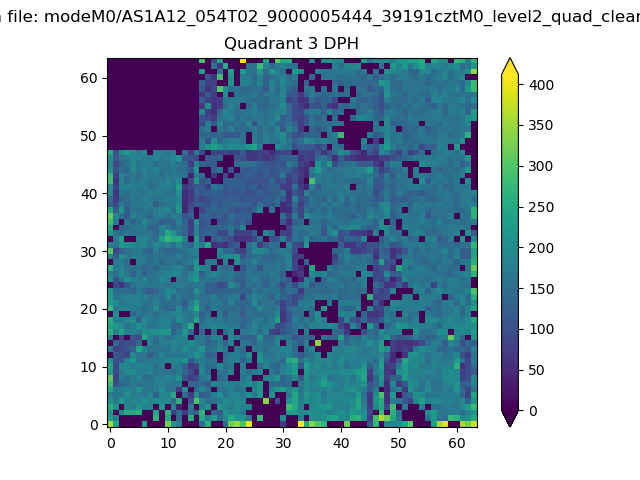 |
 |
Quadrant C |
| Plot type | Count rate plots | Images |
|---|---|---|
| Comparison with Poisson distribution Blue bars denote a histogram of data divided into 1 sec bins. Red curve is a Poisson curve with rate = median count rate of data. |
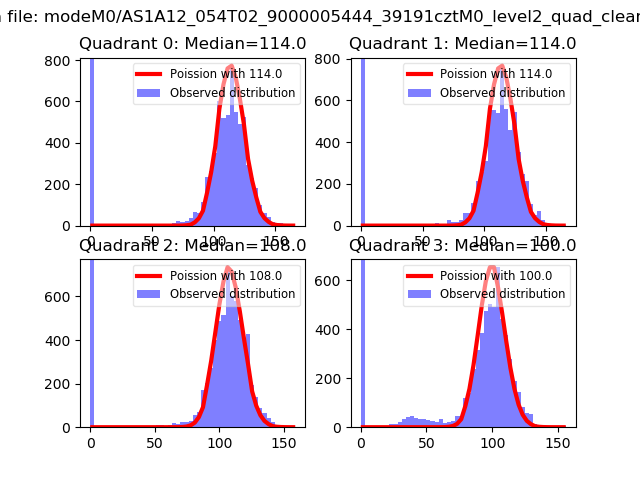 |
 |
| Quadrant-wise count rates Data is divided into 100 sec bins |
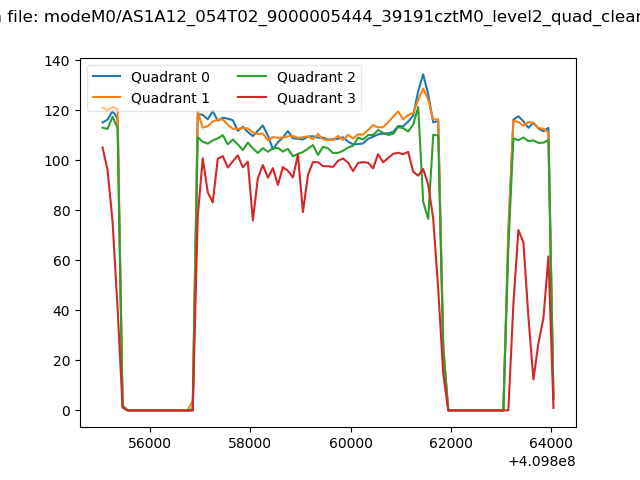 |
|
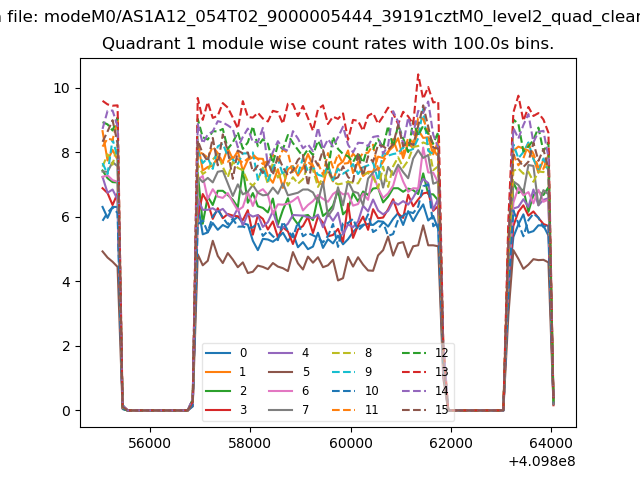
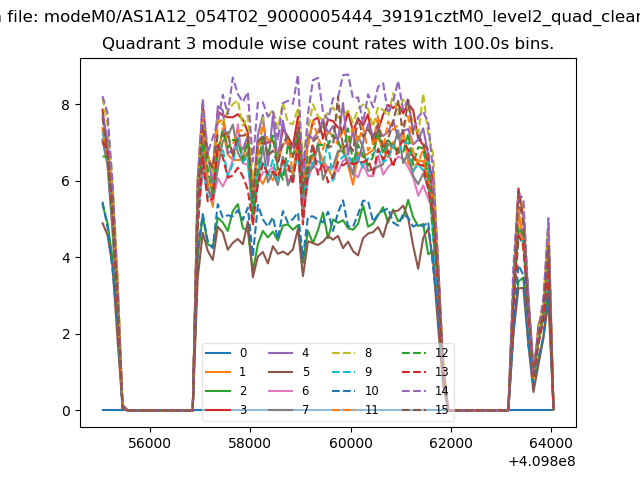
| Module-wise count rates for Quadrant A Data is divided into 100 sec bins |
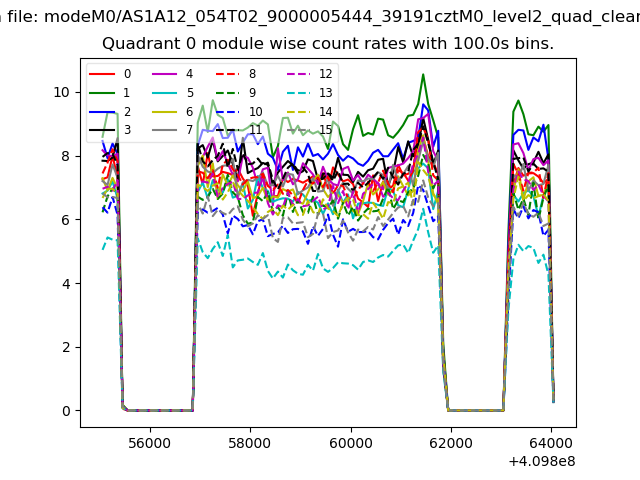 |
 |
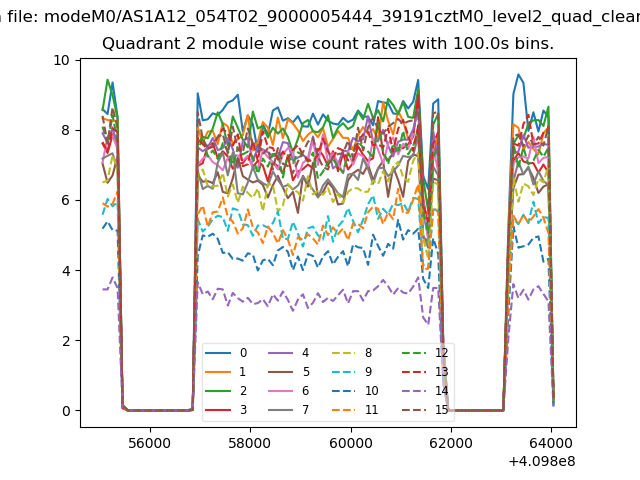
| Module-wise count rates for Quadrant B Data is divided into 100 sec bins |
 |
 |
| Module-wise count rates for Quadrant C Data is divided into 100 sec bins |
 |
 |
| Module-wise count rates for Quadrant D Data is divided into 100 sec bins |
 |
 |
| Parameter | Plot |
|---|---|
| CZT HV Monitor | 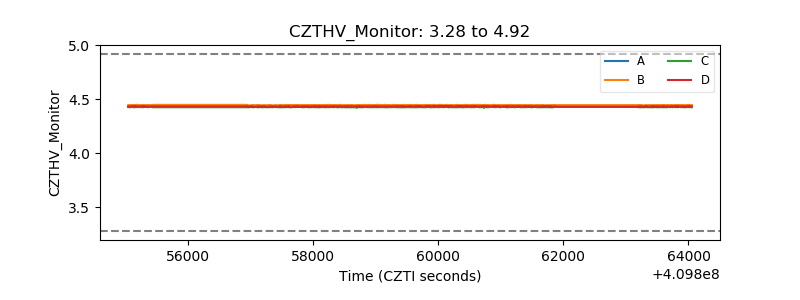 |
| D_VDD | 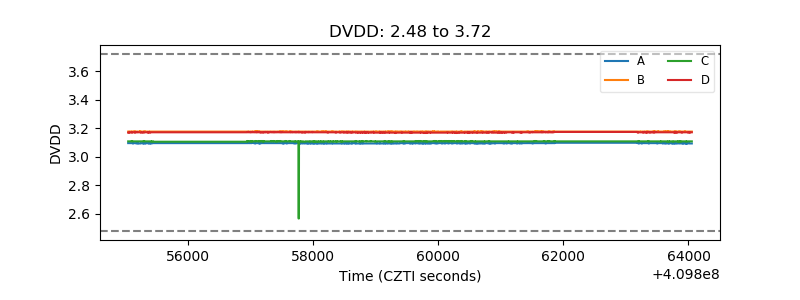 |
| Temperature 1 |  |
| Veto HV Monitor |  |
| Veto LLD | 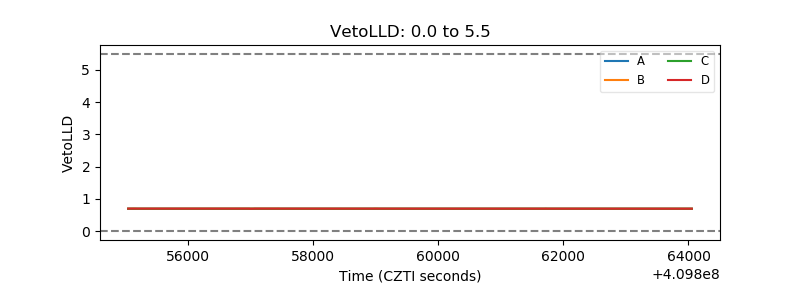 |
| Alpha Counter |  |
| _CPM_Rate | 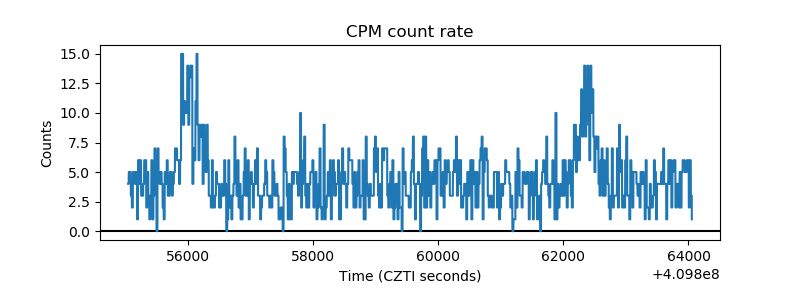 |
| CZT Counter | 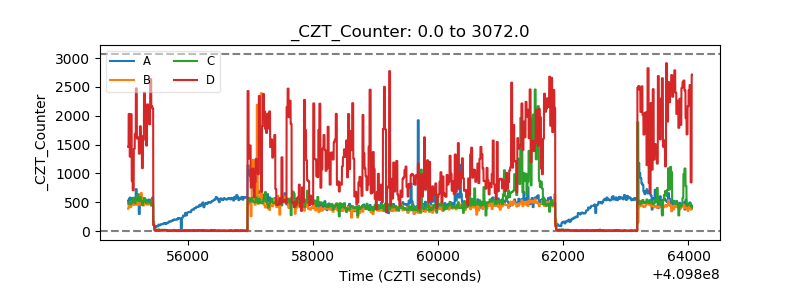 |
| +2.5 Volts monitor | 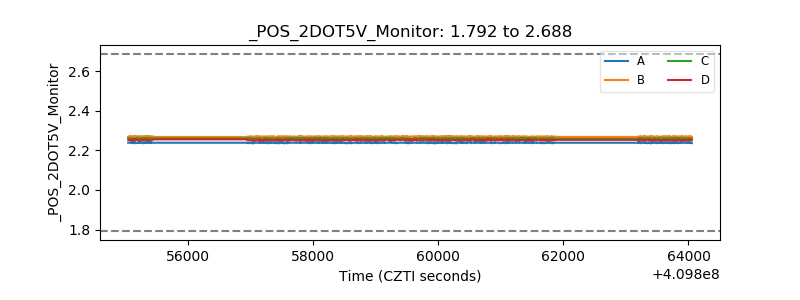 |
| +5 Volts monitor | 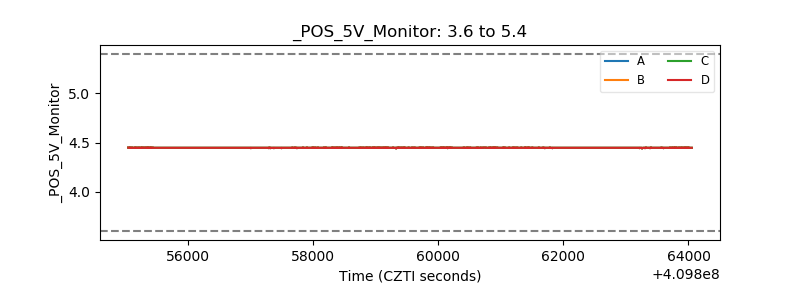 |
| _ROLL_ROT | 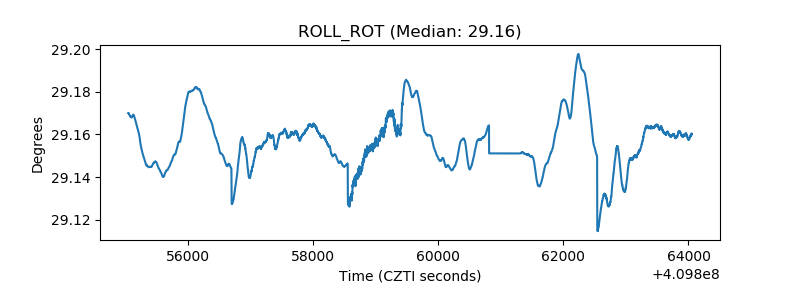 |
| _Roll_DEC | 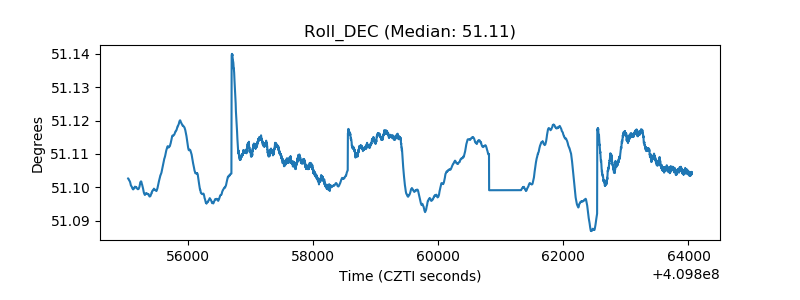 |
| _Roll_RA | 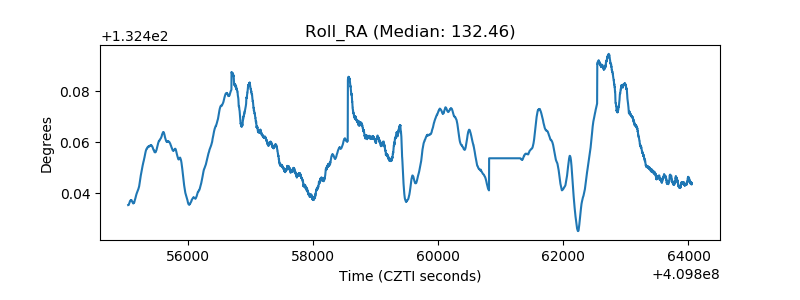 |
| Veto Counter | 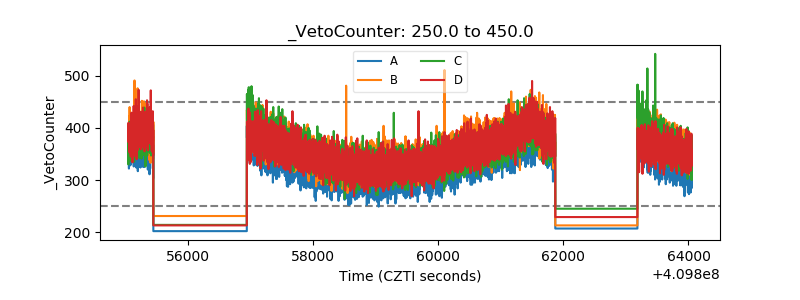 |