| Param | Original file | Final file |
|---|---|---|
| Filename | modeM0/AS1A12_054T02_9000005444_39192cztM0_level2.fits | modeM0/AS1A12_054T02_9000005444_39192cztM0_level2_quad_clean.evt |
| Size (bytes) | 594,120,960 | 103,184,640 |
| Size | 566.6 MB | 98.4 MB |
| Events in quadrant A | 3,461,393 | 736,699 |
| Events in quadrant B | 2,905,619 | 747,309 |
| Events in quadrant C | 3,424,703 | 707,837 |
| Events in quadrant D | 11,685,024 | 469,149 |
| Mode M9 | |||
|---|---|---|---|
| Quadrant | BADHDUFLAG | Total packets | Discarded packets |
| A | 0 | 26 | 0 |
| B | 0 | 26 | 0 |
| C | 0 | 26 | 0 |
| D | 0 | 26 | 0 |
| Mode M0 | |||
|---|---|---|---|
| Quadrant | BADHDUFLAG | Total packets | Discarded packets |
| A | 0 | 14595 | 3 |
| B | 0 | 13558 | 2 |
| C | 0 | 14592 | 2 |
| D | 0 | 39347 | 2 |
| Mode SS | |||
|---|---|---|---|
| Quadrant | BADHDUFLAG | Total packets | Discarded packets |
| A | 0 | 136 | 0 |
| B | 0 | 136 | 0 |
| C | 0 | 136 | 0 |
| D | 0 | 136 | 0 |
| Quadrant | Total seconds | Saturated seconds | Saturation percentage |
|---|---|---|---|
| A | 6646 | 73 | 1.098405% |
| B | 6646 | 23 | 0.346073% |
| C | 6646 | 92 | 1.384291% |
| D | 6646 | 2466 | 37.105026% |
Noise dominated data is calculated using 1-second bins in cleaned event files. If a bin has >2000 counts, and if more than 50% of those come from <1% of pixels, then it is considered to be noise-dominated and hence unusable.
| Quadrant | # 1 sec bins | Bins with >0 counts | Bins with >2000 counts | High rate bins dominated by noise | Noise dominated (total time) | Noise dominated (detector-on time) | Marked lightcurve |
|---|---|---|---|---|---|---|---|
| A | 9242 | 6648 | 47 | 47 | 0.51% | 0.71% | 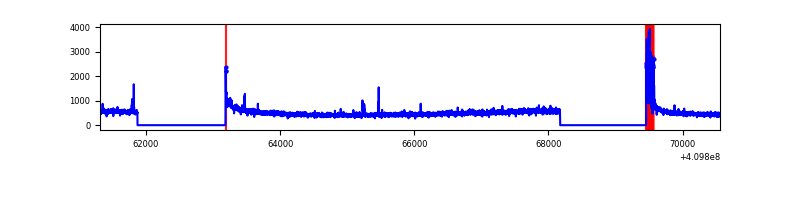 |
| B | 9242 | 6648 | 9 | 9 | 0.10% | 0.14% | 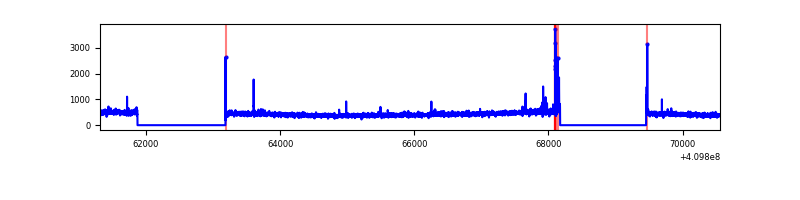 |
| C | 9242 | 6648 | 75 | 75 | 0.81% | 1.13% | 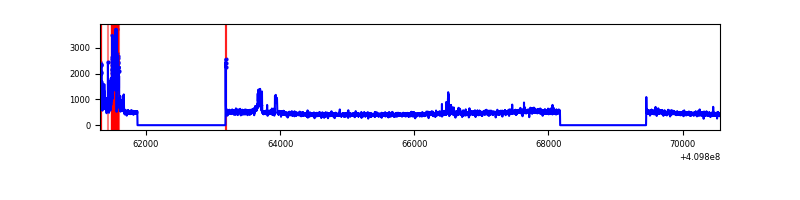 |
| D | 9242 | 6648 | 2248 | 2248 | 24.32% | 33.81% | 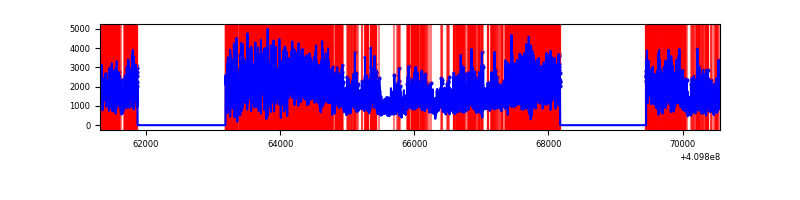 |
Top three noisy pixels from each quadrant. If the there are fewer than three noisy pixels in the level2.evt file, extra rows are filled as -1
| Pixel properties | Quadrant properties | ||||||
|---|---|---|---|---|---|---|---|
| Quadrant | DetID | PixID | Counts | Sigma | Mean | Median | Sigma |
| A | 10 | 83 | 490166 | 3309.95 | 725 | 708 | 147.9 |
| A | 13 | 248 | 125124 | 841.36 | 725 | 708 | 147.9 |
| A | 9 | 143 | 26462 | 174.16 | 725 | 708 | 147.9 |
| B | 5 | 172 | 67449 | 478.96 | 716 | 698 | 139.4 |
| B | 12 | 111 | 17379 | 119.69 | 716 | 698 | 139.4 |
| B | 5 | 184 | 16784 | 115.42 | 716 | 698 | 139.4 |
| C | 9 | 187 | 398079 | 2430.19 | 700 | 703 | 163.5 |
| C | 15 | 214 | 274260 | 1672.96 | 700 | 703 | 163.5 |
| C | 0 | 10 | 10199 | 58.07 | 700 | 703 | 163.5 |
| D | 12 | 235 | 6785221 | 45688.86 | 613 | 595 | 148.5 |
| D | 12 | 227 | 1750608 | 11784.89 | 613 | 595 | 148.5 |
| D | 2 | 249 | 282129 | 1895.9 | 613 | 595 | 148.5 |
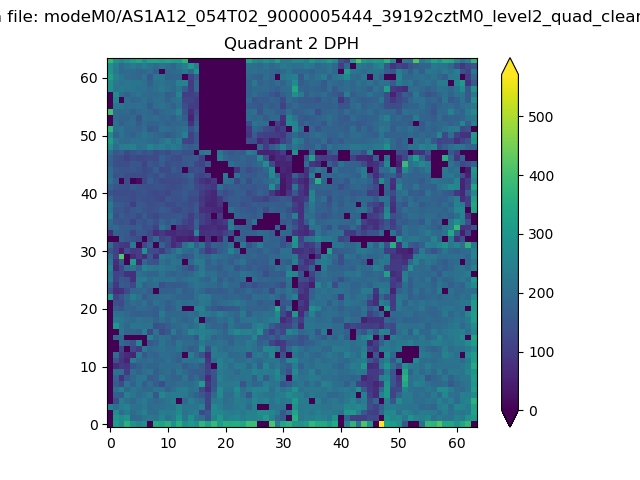
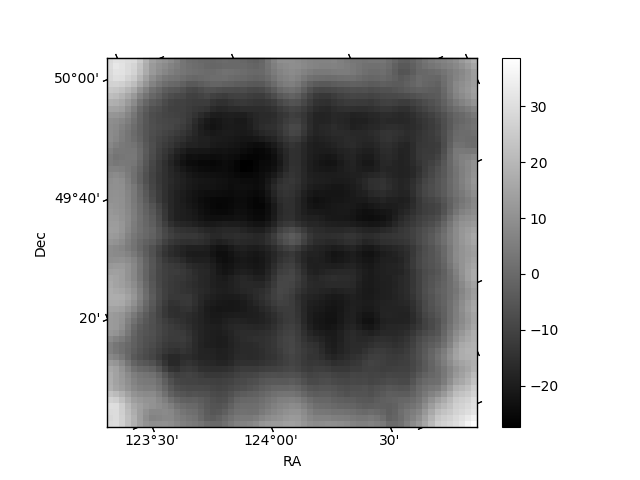
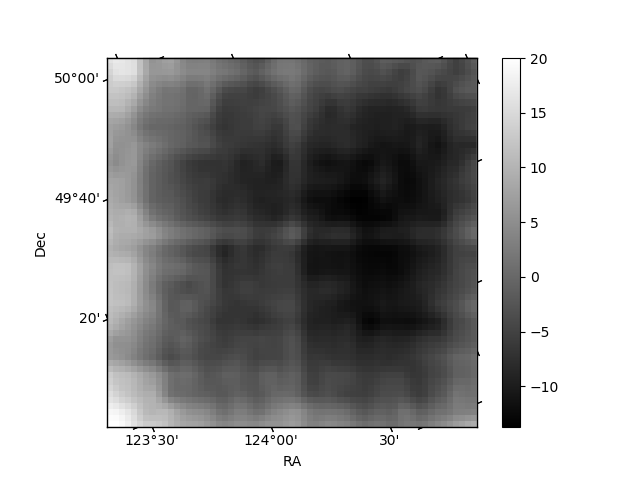
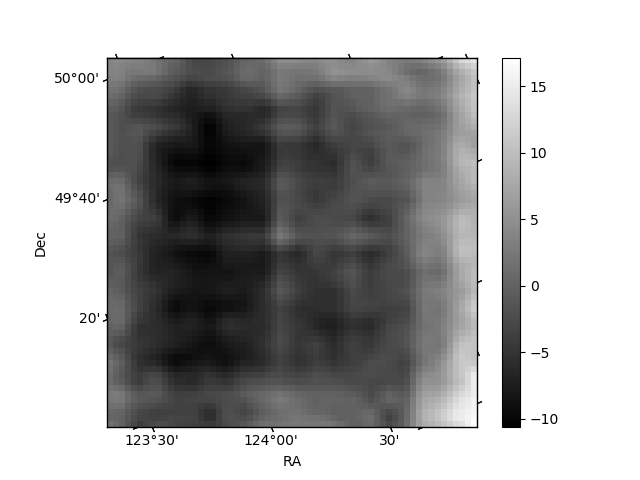
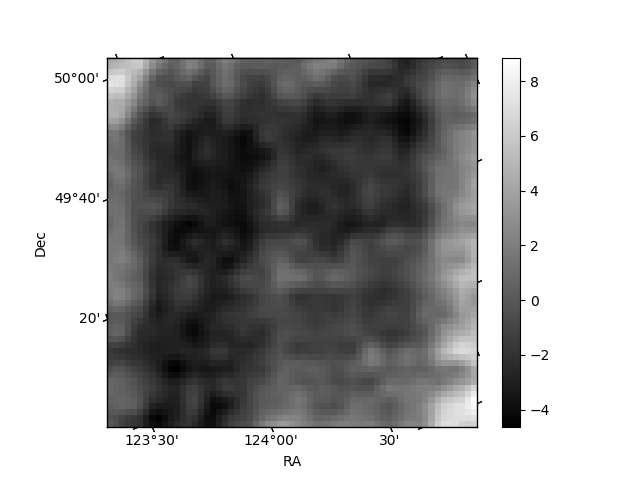
Histogram calculated using DETX and DETY for each event in the final _common_clean file
| Quadrant A | 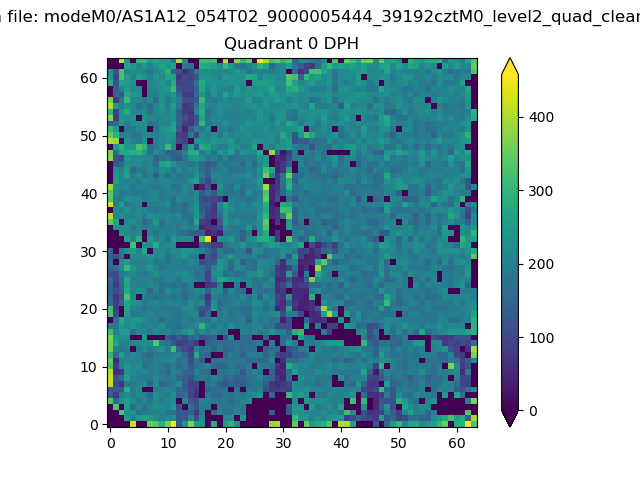 |
 |
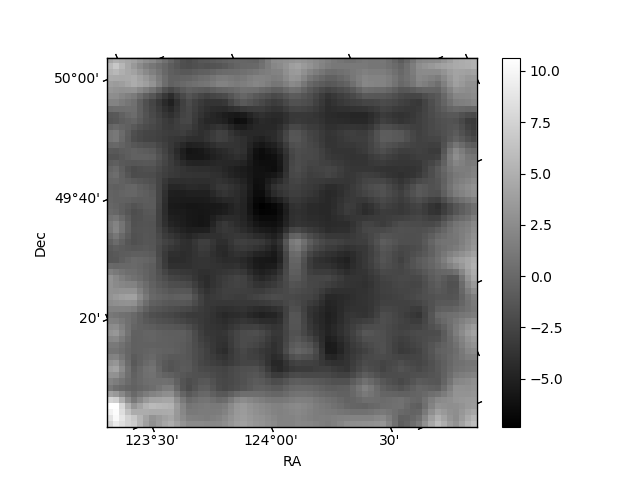
Quadrant B |
|---|---|---|---|
| Quadrant D | 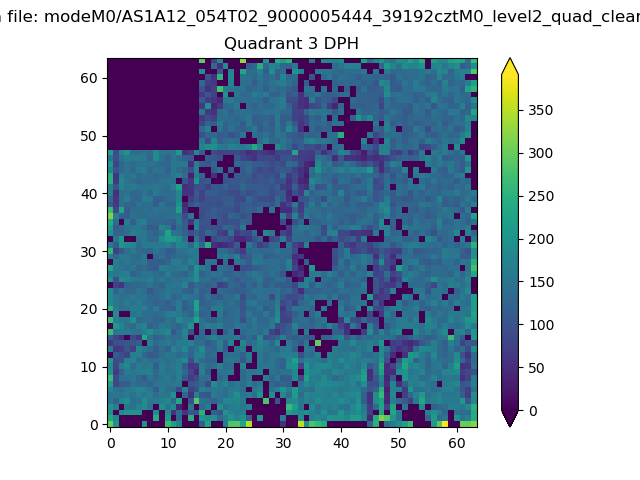 |
 |
Quadrant C |
| Plot type | Count rate plots | Images |
|---|---|---|
| Comparison with Poisson distribution Blue bars denote a histogram of data divided into 1 sec bins. Red curve is a Poisson curve with rate = median count rate of data. |
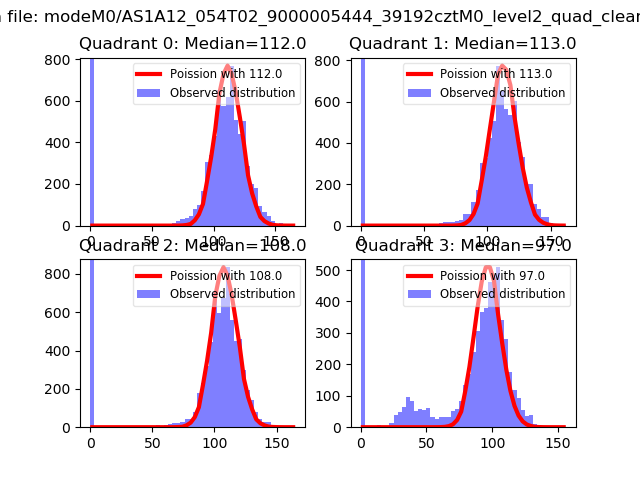 |
 |
| Quadrant-wise count rates Data is divided into 100 sec bins |
 |
|
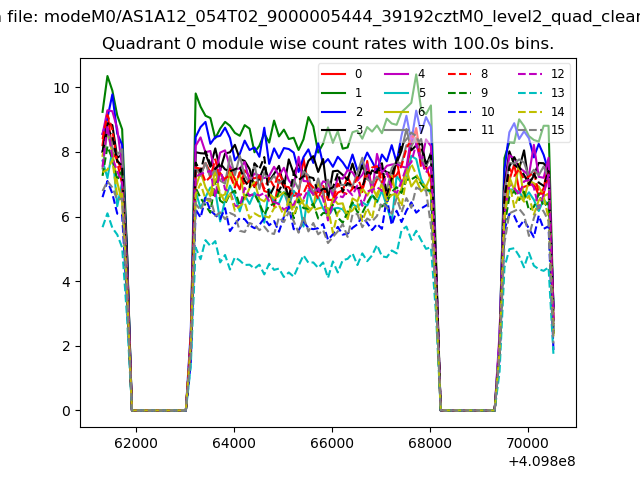
| Module-wise count rates for Quadrant A Data is divided into 100 sec bins |
 |
 |
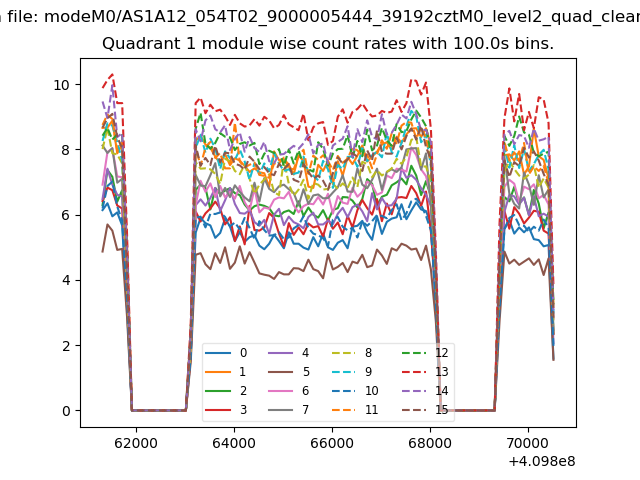
| Module-wise count rates for Quadrant B Data is divided into 100 sec bins |
 |
 |
| Module-wise count rates for Quadrant C Data is divided into 100 sec bins |
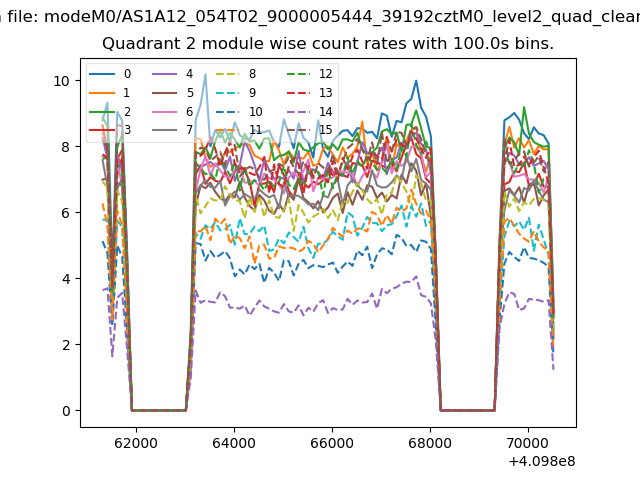 |
 |
| Module-wise count rates for Quadrant D Data is divided into 100 sec bins |
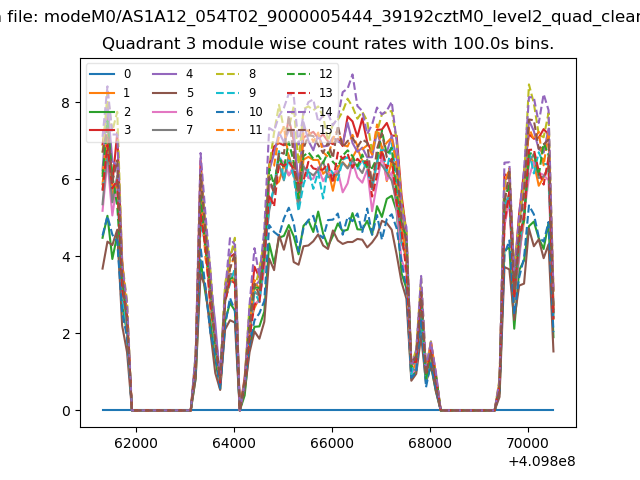 |
 |
| Parameter | Plot |
|---|---|
| CZT HV Monitor |  |
| D_VDD | 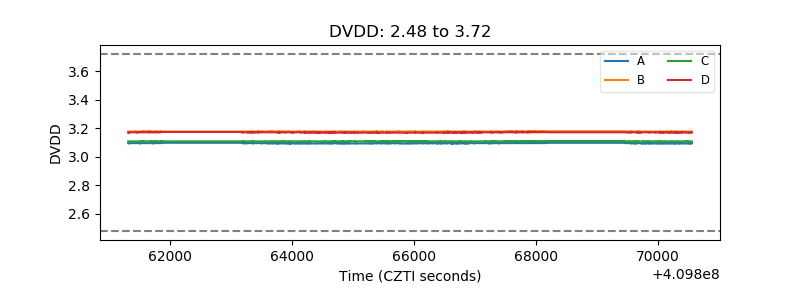 |
| Temperature 1 | 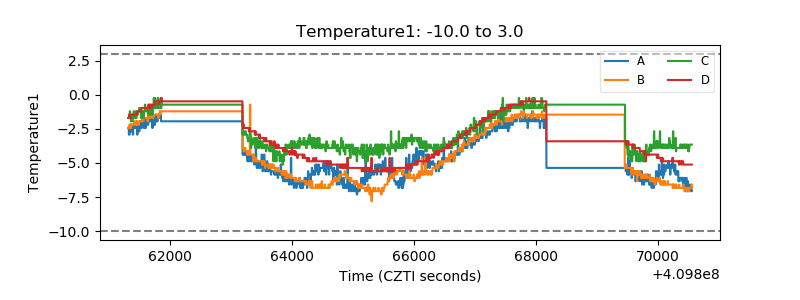 |
| Veto HV Monitor | 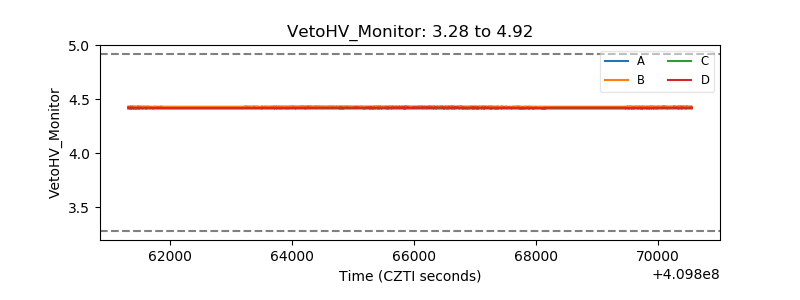 |
| Veto LLD | 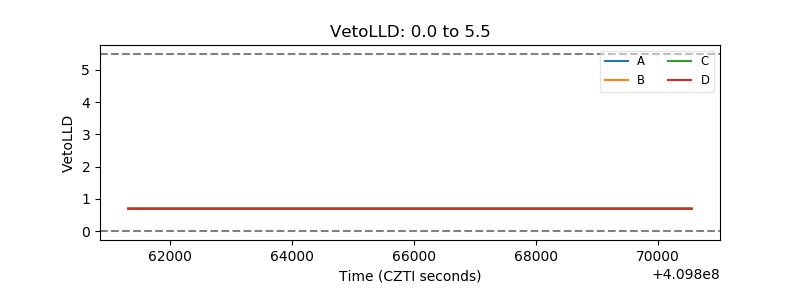 |
| Alpha Counter | 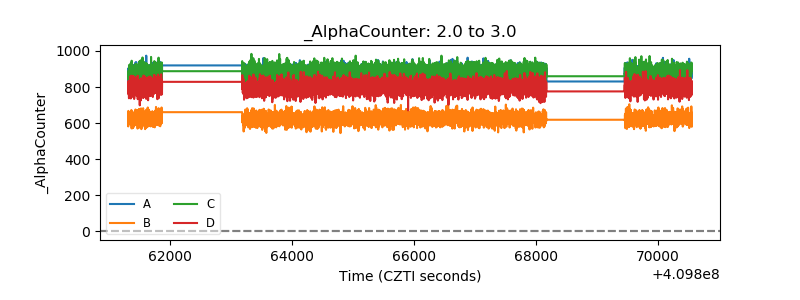 |
| _CPM_Rate | 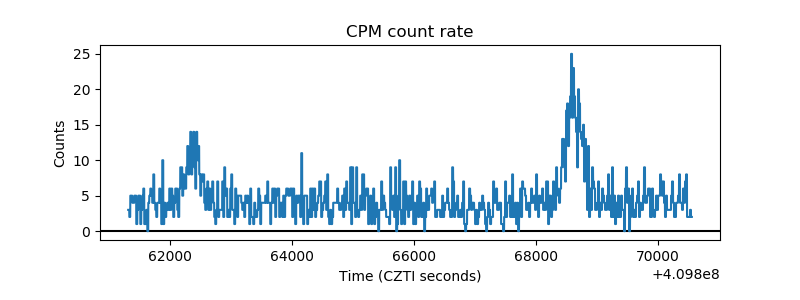 |
| CZT Counter |  |
| +2.5 Volts monitor | 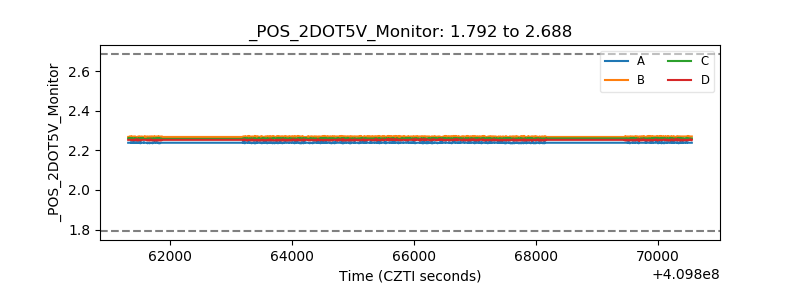 |
| +5 Volts monitor | 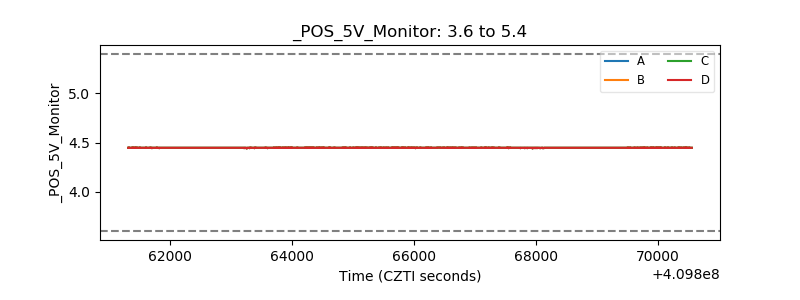 |
| _ROLL_ROT | 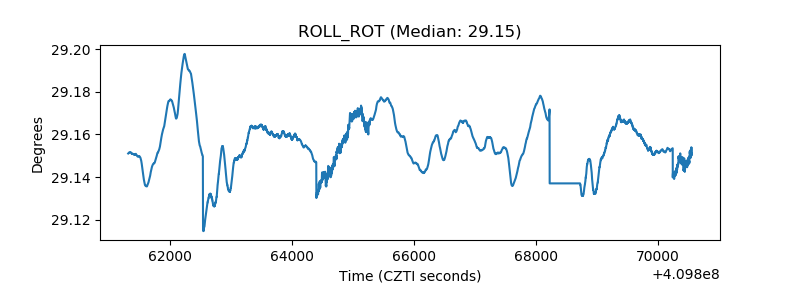 |
| _Roll_DEC | 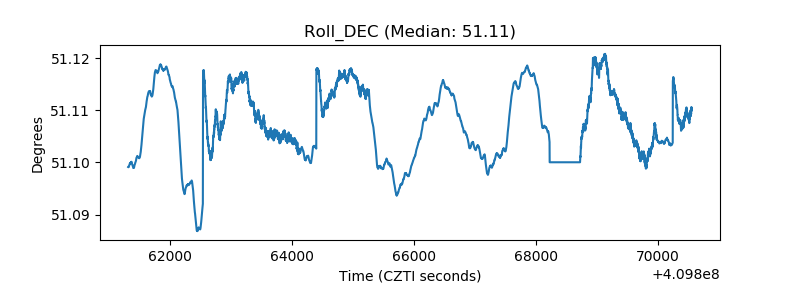 |
| _Roll_RA | 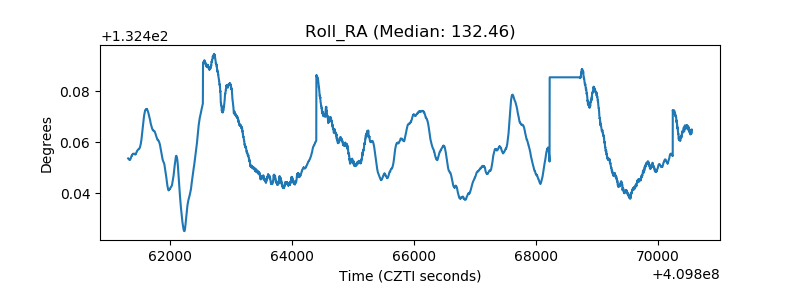 |
| Veto Counter | 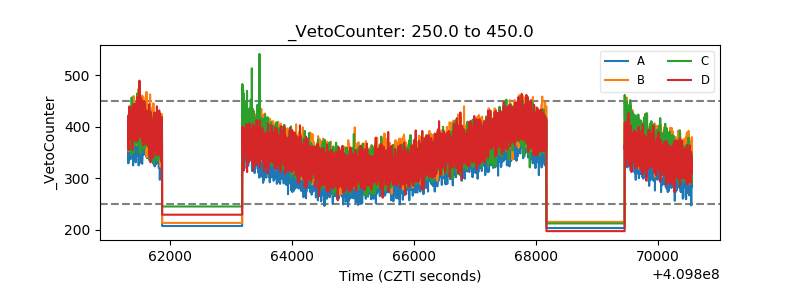 |