| Param | Original file | Final file |
|---|---|---|
| Filename | modeM0/AS1A12_054T02_9000005444_39194cztM0_level2.fits | modeM0/AS1A12_054T02_9000005444_39194cztM0_level2_quad_clean.evt |
| Size (bytes) | 826,824,960 | 167,328,000 |
| Size | 788.5 MB | 159.6 MB |
| Events in quadrant A | 5,708,419 | 1,155,752 |
| Events in quadrant B | 4,632,991 | 1,185,654 |
| Events in quadrant C | 4,856,761 | 1,134,839 |
| Events in quadrant D | 14,574,336 | 844,433 |
| Mode M9 | |||
|---|---|---|---|
| Quadrant | BADHDUFLAG | Total packets | Discarded packets |
| A | 0 | 34 | 0 |
| B | 0 | 34 | 0 |
| C | 0 | 34 | 0 |
| D | 0 | 35 | 0 |
| Mode M0 | |||
|---|---|---|---|
| Quadrant | BADHDUFLAG | Total packets | Discarded packets |
| A | 0 | 24120 | 4 |
| B | 0 | 21989 | 3 |
| C | 0 | 21787 | 3 |
| D | 0 | 50764 | 3 |
| Mode SS | |||
|---|---|---|---|
| Quadrant | BADHDUFLAG | Total packets | Discarded packets |
| A | 0 | 220 | 0 |
| B | 0 | 220 | 0 |
| C | 0 | 220 | 0 |
| D | 0 | 220 | 0 |
| Quadrant | Total seconds | Saturated seconds | Saturation percentage |
|---|---|---|---|
| A | 10762 | 202 | 1.876975% |
| B | 10762 | 35 | 0.325218% |
| C | 10762 | 9 | 0.083628% |
| D | 10762 | 2478 | 23.025460% |
Noise dominated data is calculated using 1-second bins in cleaned event files. If a bin has >2000 counts, and if more than 50% of those come from <1% of pixels, then it is considered to be noise-dominated and hence unusable.
| Quadrant | # 1 sec bins | Bins with >0 counts | Bins with >2000 counts | High rate bins dominated by noise | Noise dominated (total time) | Noise dominated (detector-on time) | Marked lightcurve |
|---|---|---|---|---|---|---|---|
| A | 13569 | 10764 | 134 | 134 | 0.99% | 1.24% | 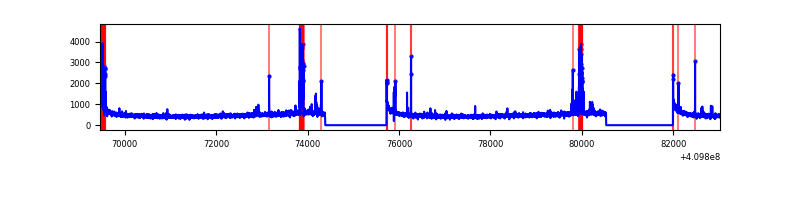 |
| B | 13569 | 10764 | 9 | 9 | 0.07% | 0.08% | 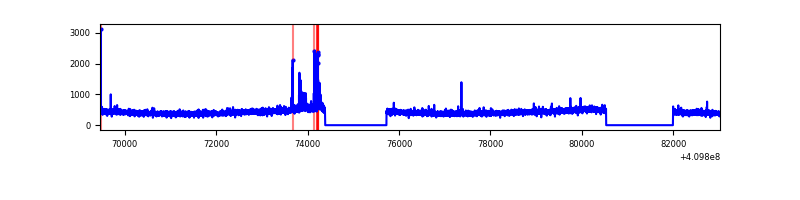 |
| C | 13569 | 10764 | 1 | 1 | 0.01% | 0.01% | 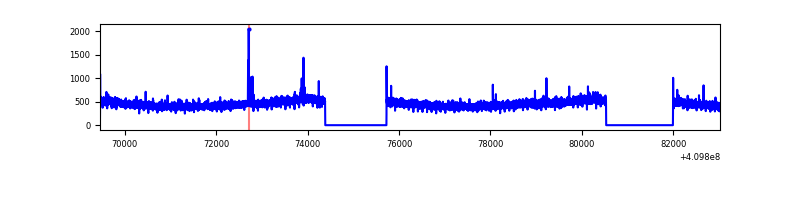 |
| D | 13569 | 10763 | 2185 | 2185 | 16.10% | 20.30% | 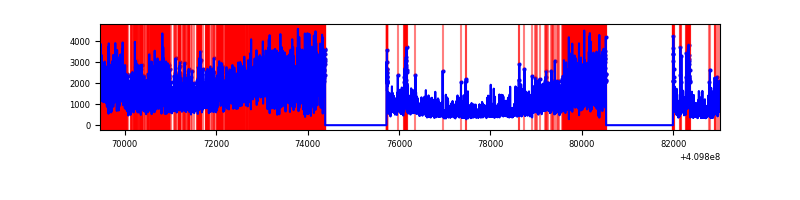 |
Top three noisy pixels from each quadrant. If the there are fewer than three noisy pixels in the level2.evt file, extra rows are filled as -1
| Pixel properties | Quadrant properties | ||||||
|---|---|---|---|---|---|---|---|
| Quadrant | DetID | PixID | Counts | Sigma | Mean | Median | Sigma |
| A | 10 | 83 | 774501 | 3322.15 | 1145 | 1120 | 232.8 |
| A | 13 | 248 | 291146 | 1245.84 | 1145 | 1120 | 232.8 |
| A | 9 | 143 | 197617 | 844.07 | 1145 | 1120 | 232.8 |
| B | 5 | 172 | 104568 | 473.35 | 1143 | 1108 | 218.6 |
| B | 5 | 184 | 28287 | 124.35 | 1143 | 1108 | 218.6 |
| B | 12 | 111 | 28106 | 123.52 | 1143 | 1108 | 218.6 |
| C | 15 | 214 | 450189 | 1736.5 | 1117 | 1121 | 258.6 |
| C | 15 | 159 | 15659 | 56.22 | 1117 | 1121 | 258.6 |
| C | 3 | 233 | 12914 | 45.6 | 1117 | 1121 | 258.6 |
| D | 12 | 235 | 9403548 | 37297.83 | 1028 | 999 | 252.1 |
| D | 2 | 249 | 277338 | 1096.18 | 1028 | 999 | 252.1 |
| D | 5 | 222 | 222512 | 878.69 | 1028 | 999 | 252.1 |
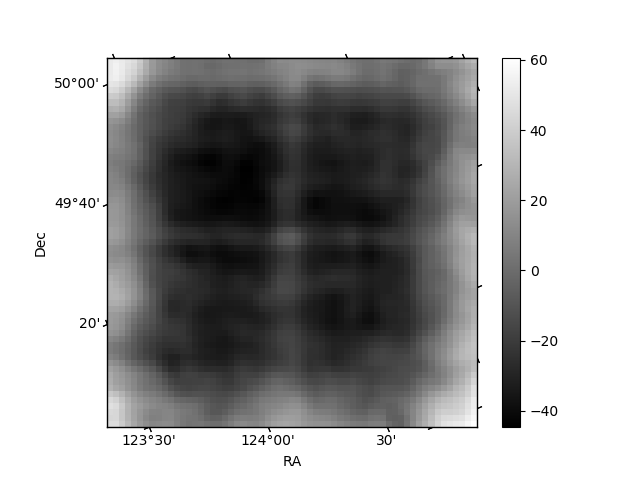
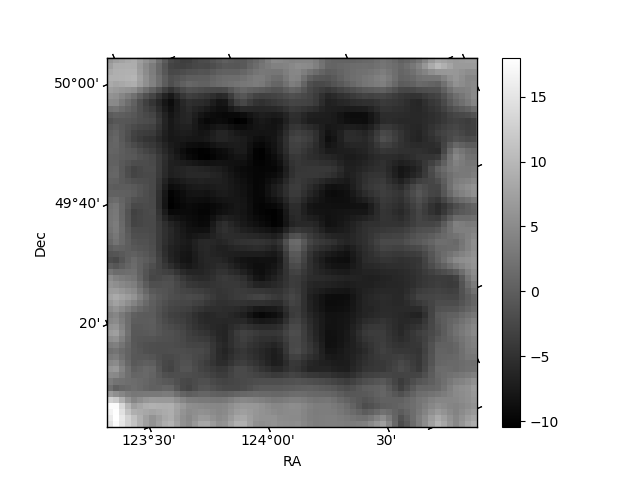
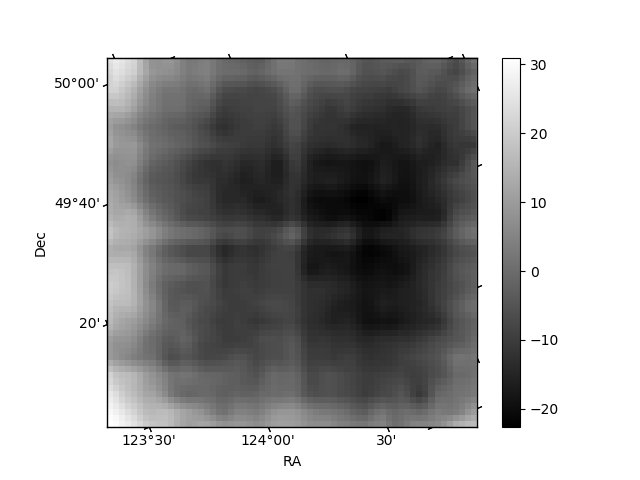
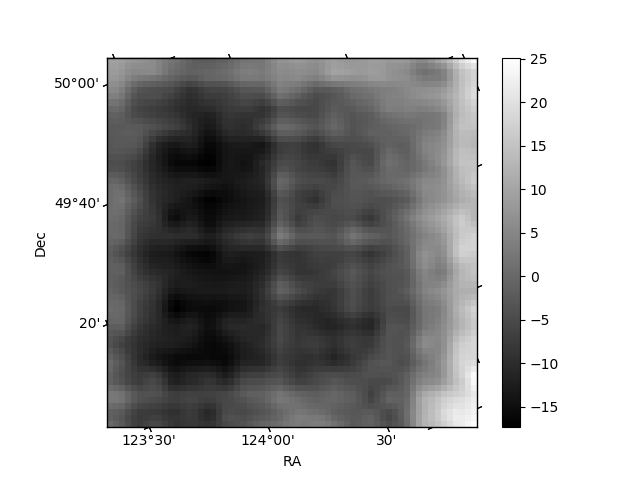
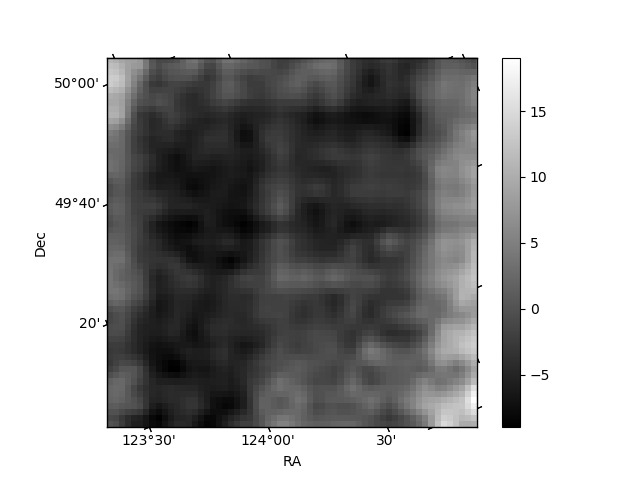
Histogram calculated using DETX and DETY for each event in the final _common_clean file
| Quadrant A | 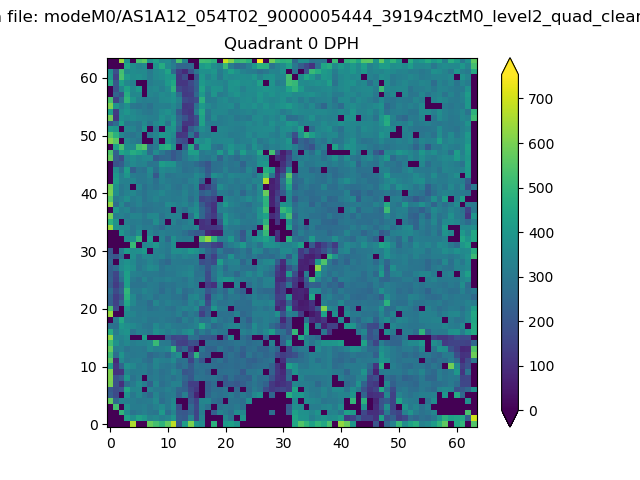 |
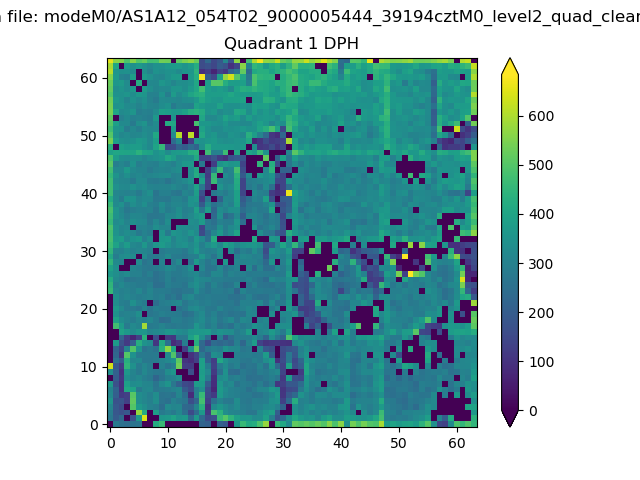 |
Quadrant B |
|---|---|---|---|
| Quadrant D | 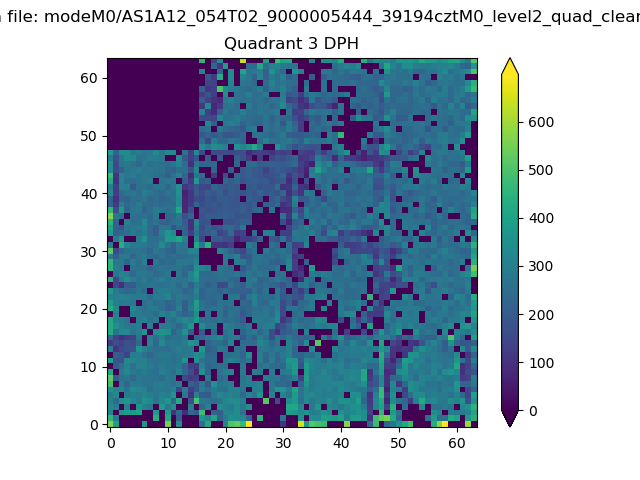 |
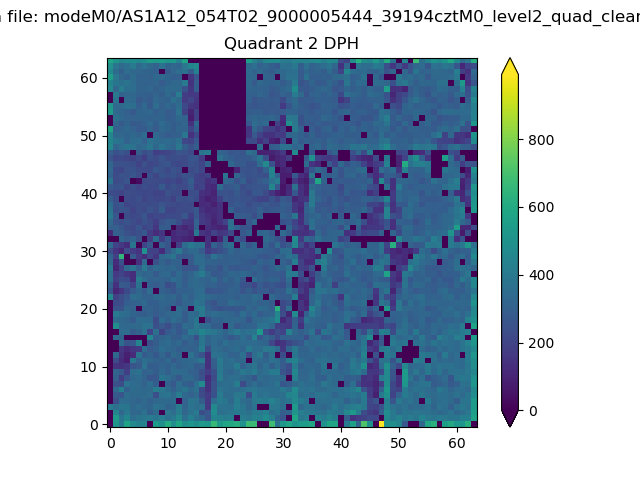 |
Quadrant C |
| Plot type | Count rate plots | Images |
|---|---|---|
| Comparison with Poisson distribution Blue bars denote a histogram of data divided into 1 sec bins. Red curve is a Poisson curve with rate = median count rate of data. |
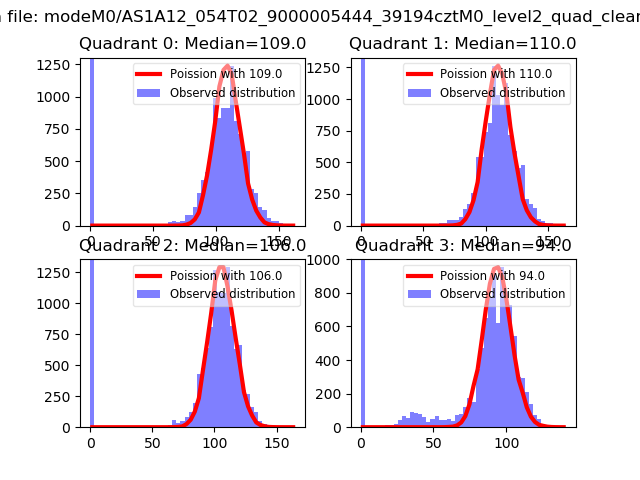 |
 |
| Quadrant-wise count rates Data is divided into 100 sec bins |
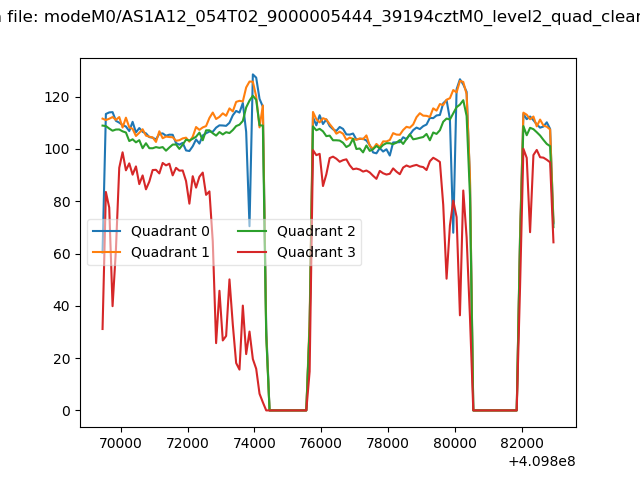 |
|
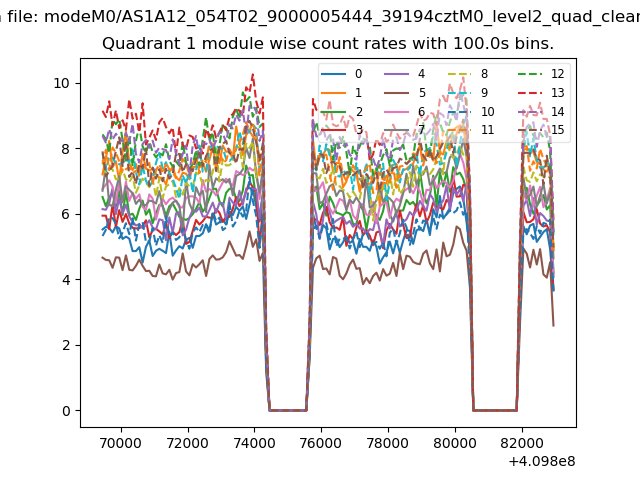
| Module-wise count rates for Quadrant A Data is divided into 100 sec bins |
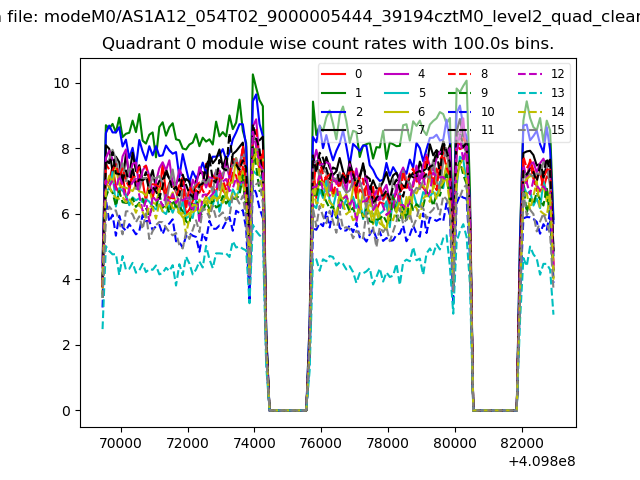 |
 |
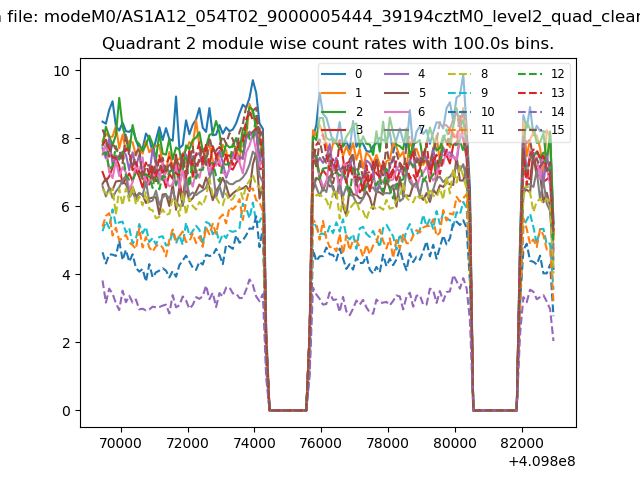
| Module-wise count rates for Quadrant B Data is divided into 100 sec bins |
 |
 |
| Module-wise count rates for Quadrant C Data is divided into 100 sec bins |
 |
 |
| Module-wise count rates for Quadrant D Data is divided into 100 sec bins |
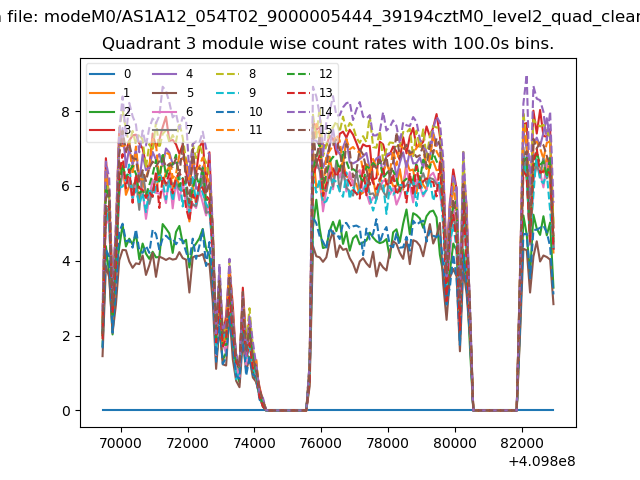 |
 |
| Parameter | Plot |
|---|---|
| CZT HV Monitor | 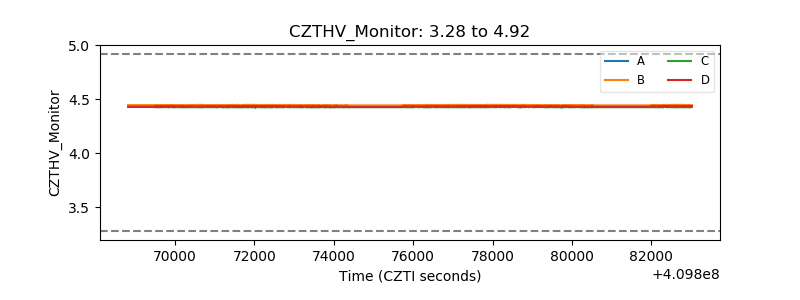 |
| D_VDD | 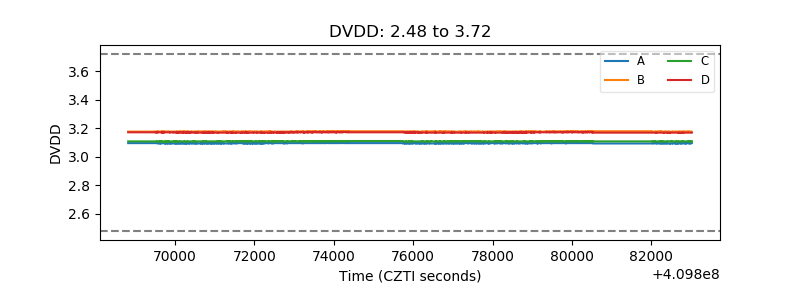 |
| Temperature 1 | 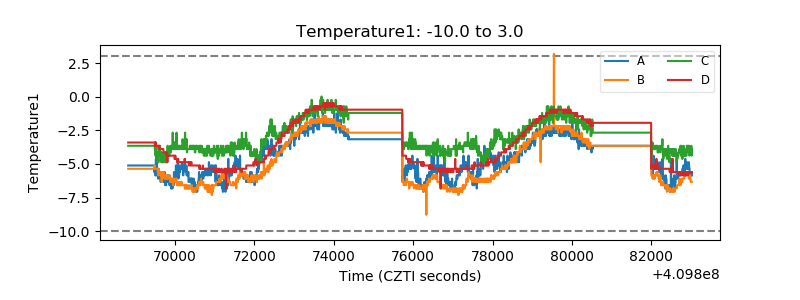 |
| Veto HV Monitor | 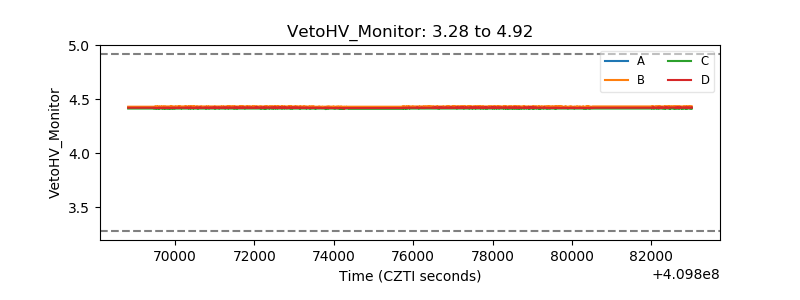 |
| Veto LLD | 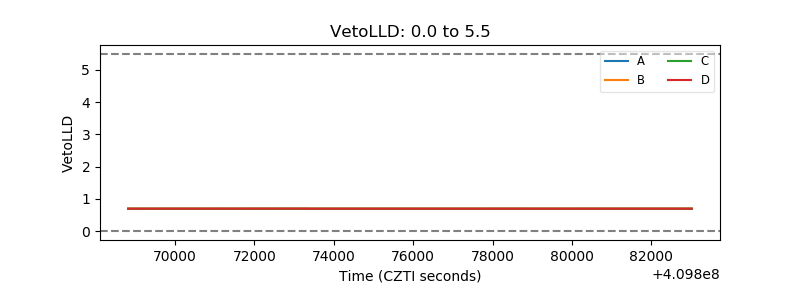 |
| Alpha Counter | 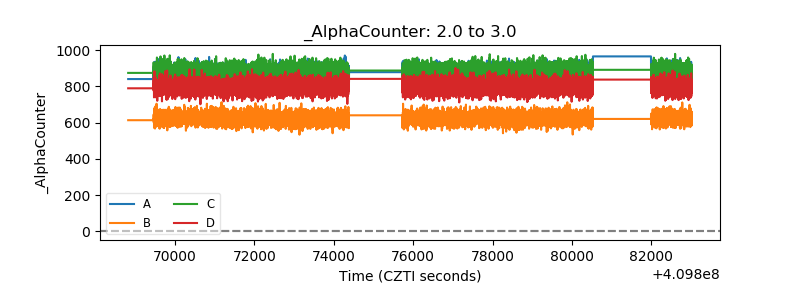 |
| _CPM_Rate | 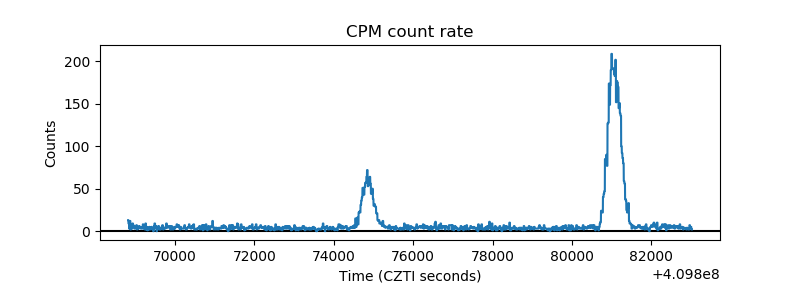 |
| CZT Counter | 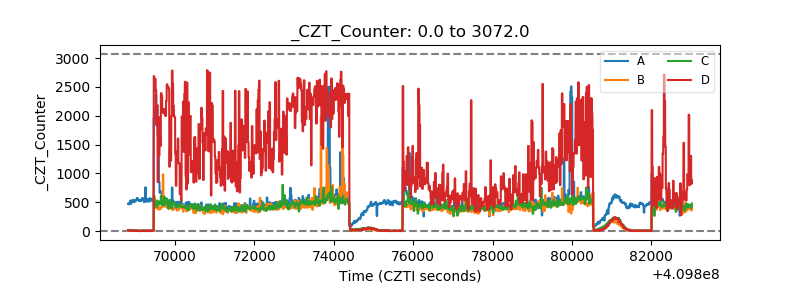 |
| +2.5 Volts monitor | 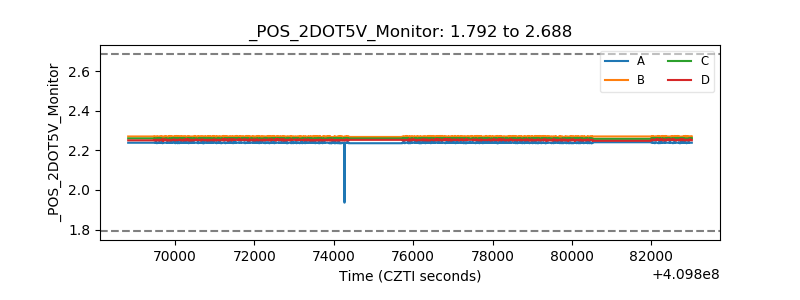 |
| +5 Volts monitor | 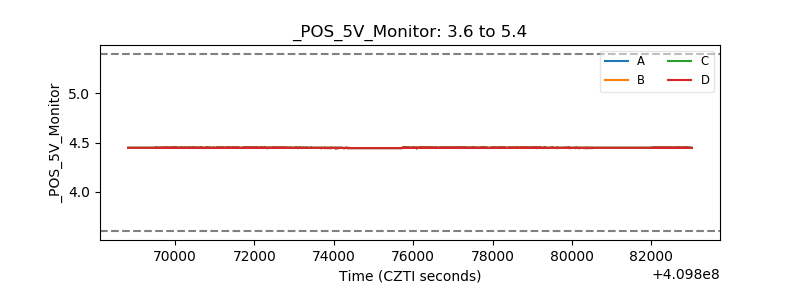 |
| _ROLL_ROT | 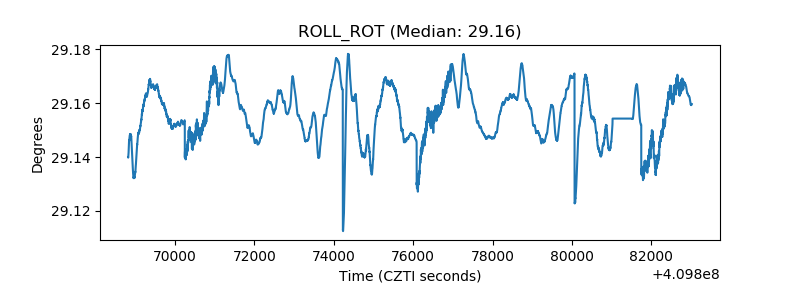 |
| _Roll_DEC | 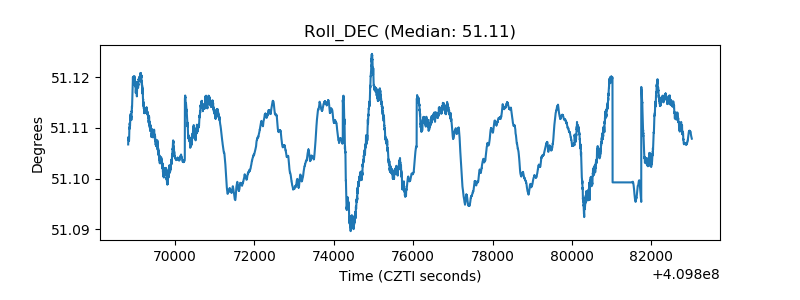 |
| _Roll_RA | 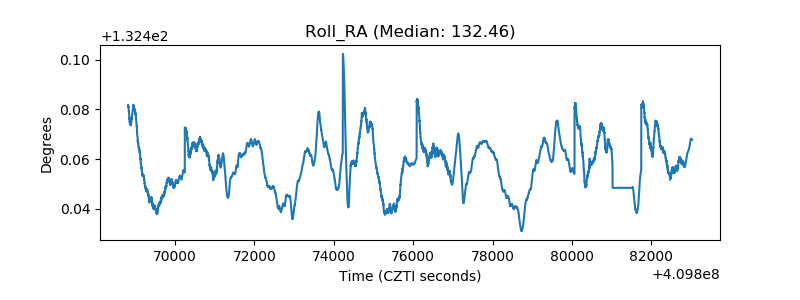 |
| Veto Counter | 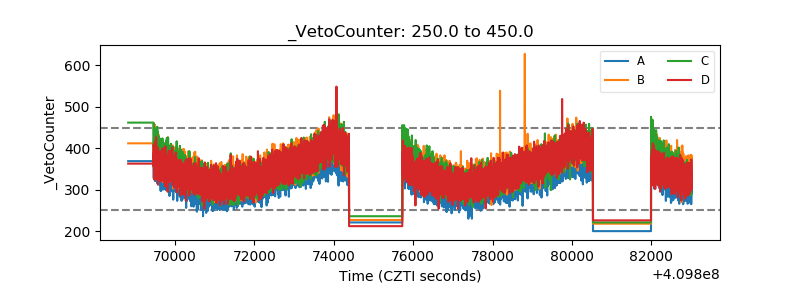 |