| Param | Original file | Final file |
|---|---|---|
| Filename | modeM0/AS1A12_054T02_9000005444_39195cztM0_level2.fits | modeM0/AS1A12_054T02_9000005444_39195cztM0_level2_quad_clean.evt |
| Size (bytes) | 410,993,280 | 93,314,880 |
| Size | 392.0 MB | 89.0 MB |
| Events in quadrant A | 3,060,532 | 640,307 |
| Events in quadrant B | 2,424,727 | 652,976 |
| Events in quadrant C | 2,599,184 | 616,234 |
| Events in quadrant D | 6,677,144 | 509,685 |
| Mode M9 | |||
|---|---|---|---|
| Quadrant | BADHDUFLAG | Total packets | Discarded packets |
| A | 0 | 25 | 0 |
| B | 0 | 25 | 0 |
| C | 0 | 25 | 0 |
| D | 0 | 26 | 0 |
| Mode M0 | |||
|---|---|---|---|
| Quadrant | BADHDUFLAG | Total packets | Discarded packets |
| A | 0 | 12806 | 3 |
| B | 0 | 11630 | 2 |
| C | 0 | 11701 | 2 |
| D | 0 | 23898 | 2 |
| Mode SS | |||
|---|---|---|---|
| Quadrant | BADHDUFLAG | Total packets | Discarded packets |
| A | 0 | 118 | 0 |
| B | 0 | 118 | 0 |
| C | 0 | 118 | 0 |
| D | 0 | 118 | 0 |
| Quadrant | Total seconds | Saturated seconds | Saturation percentage |
|---|---|---|---|
| A | 5810 | 41 | 0.705680% |
| B | 5810 | 6 | 0.103270% |
| C | 5810 | 5 | 0.086059% |
| D | 5810 | 890 | 15.318417% |
Noise dominated data is calculated using 1-second bins in cleaned event files. If a bin has >2000 counts, and if more than 50% of those come from <1% of pixels, then it is considered to be noise-dominated and hence unusable.
| Quadrant | # 1 sec bins | Bins with >0 counts | Bins with >2000 counts | High rate bins dominated by noise | Noise dominated (total time) | Noise dominated (detector-on time) | Marked lightcurve |
|---|---|---|---|---|---|---|---|
| A | 7392 | 5811 | 34 | 34 | 0.46% | 0.59% |  |
| B | 7392 | 5811 | 0 | 0 | 0.00% | 0.00% | 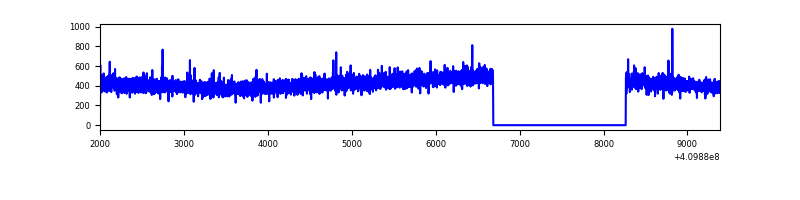 |
| C | 7392 | 5811 | 0 | 0 | 0.00% | 0.00% | 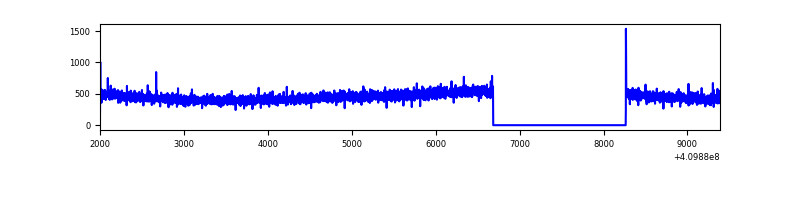 |
| D | 7392 | 5811 | 727 | 727 | 9.83% | 12.51% | 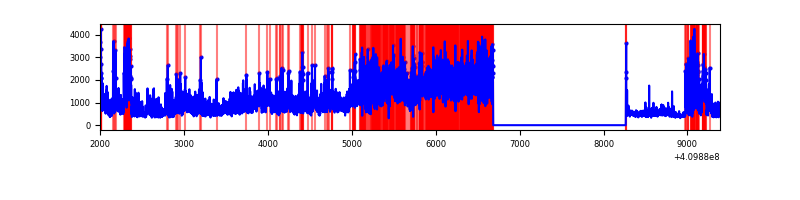 |
Top three noisy pixels from each quadrant. If the there are fewer than three noisy pixels in the level2.evt file, extra rows are filled as -1
| Pixel properties | Quadrant properties | ||||||
|---|---|---|---|---|---|---|---|
| Quadrant | DetID | PixID | Counts | Sigma | Mean | Median | Sigma |
| A | 10 | 83 | 451967 | 3580.46 | 618 | 607 | 126.1 |
| A | 9 | 143 | 172308 | 1362.04 | 618 | 607 | 126.1 |
| A | 2 | 79 | 28528 | 221.49 | 618 | 607 | 126.1 |
| B | 12 | 111 | 15069 | 121.05 | 615 | 599 | 119.5 |
| B | 11 | 111 | 13762 | 110.12 | 615 | 599 | 119.5 |
| B | 14 | 111 | 13295 | 106.21 | 615 | 599 | 119.5 |
| C | 15 | 214 | 244114 | 1727.59 | 601 | 603 | 141.0 |
| C | 0 | 10 | 5768 | 36.64 | 601 | 603 | 141.0 |
| C | 5 | 251 | 5101 | 31.91 | 601 | 603 | 141.0 |
| D | 12 | 235 | 3760034 | 26625.76 | 572 | 555 | 141.2 |
| D | 2 | 249 | 530829 | 3755.56 | 572 | 555 | 141.2 |
| D | 5 | 222 | 88908 | 625.74 | 572 | 555 | 141.2 |
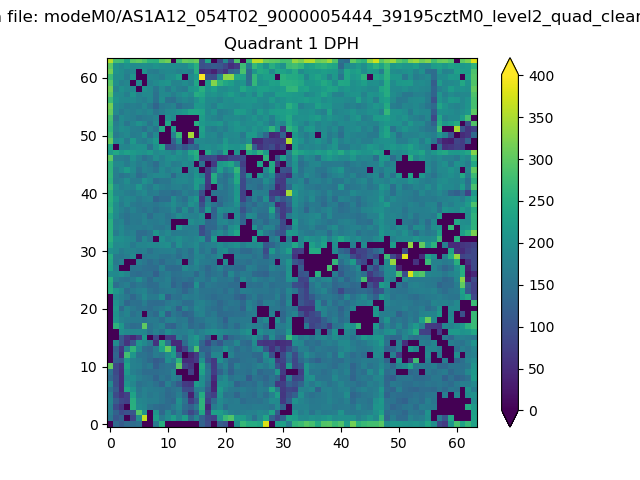
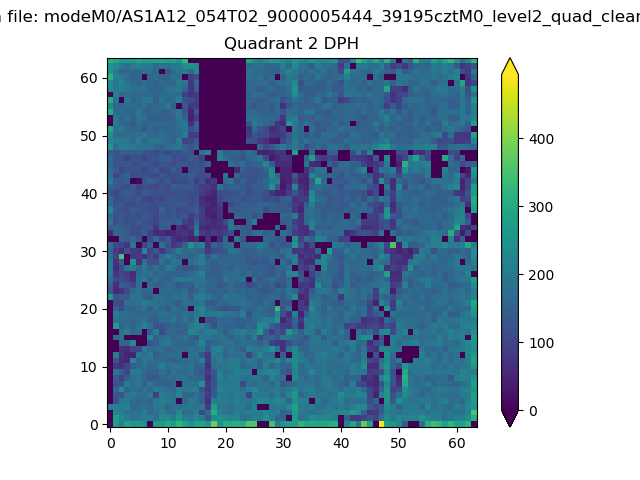
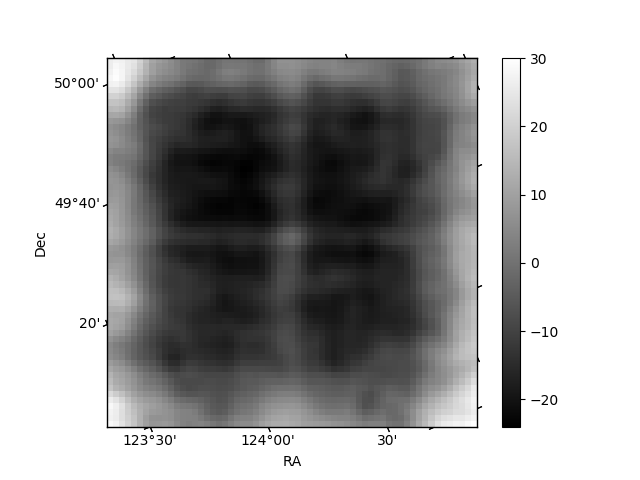
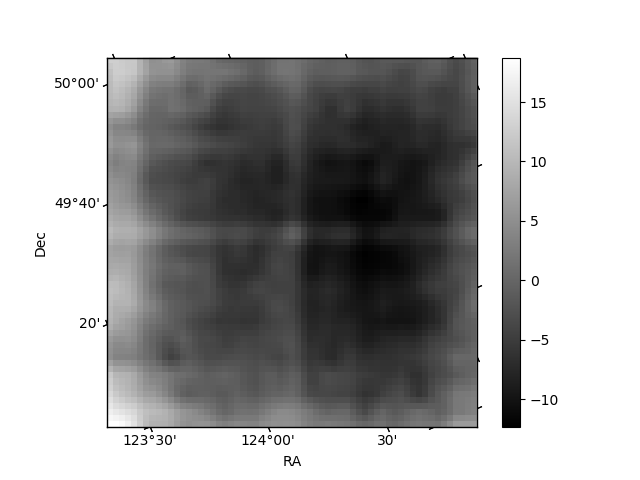
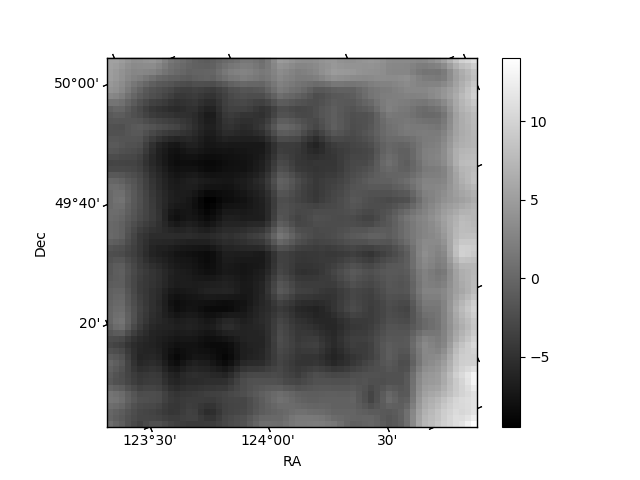
Histogram calculated using DETX and DETY for each event in the final _common_clean file
| Quadrant A | 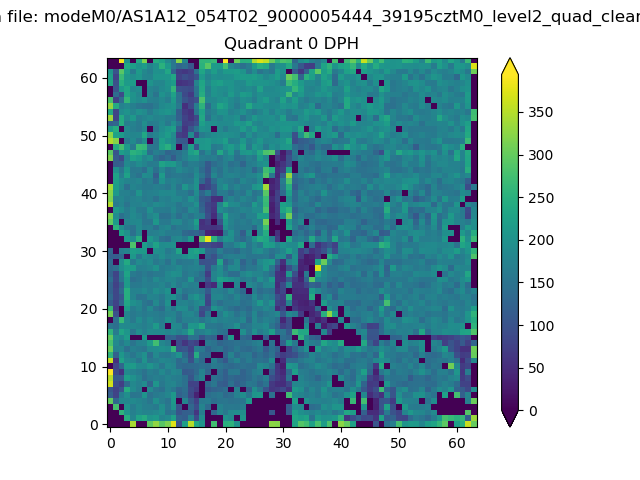 |
 |
Quadrant B |
|---|---|---|---|
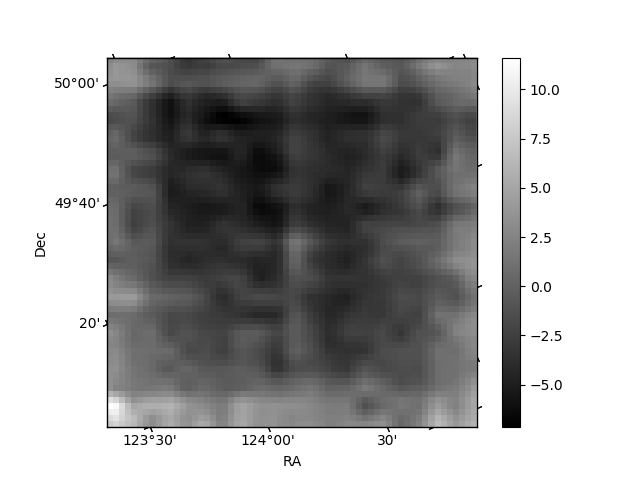
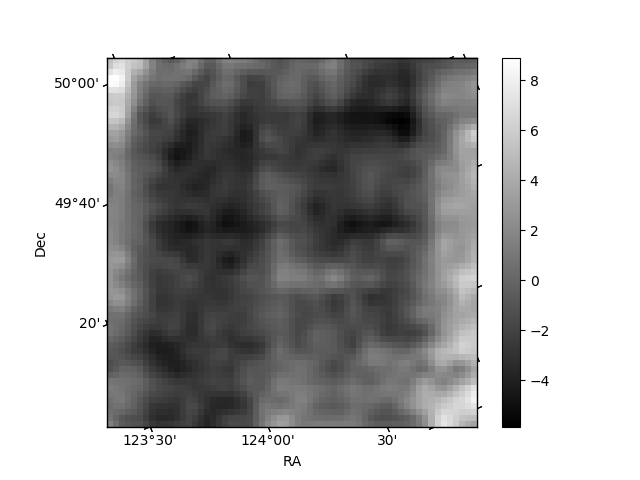
| Quadrant D | 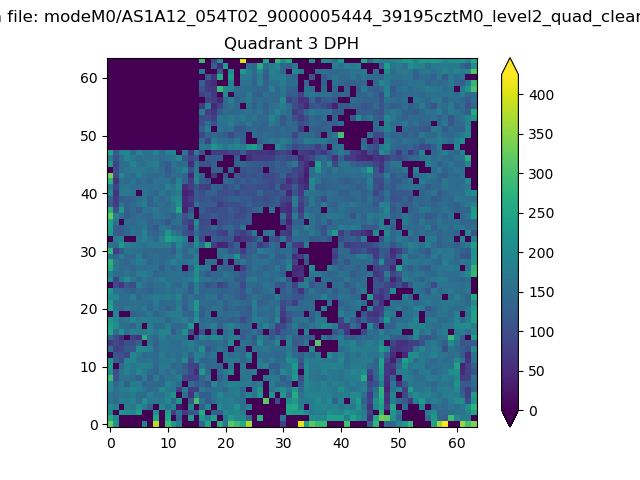 |
 |
Quadrant C |
| Plot type | Count rate plots | Images |
|---|---|---|
| Comparison with Poisson distribution Blue bars denote a histogram of data divided into 1 sec bins. Red curve is a Poisson curve with rate = median count rate of data. |
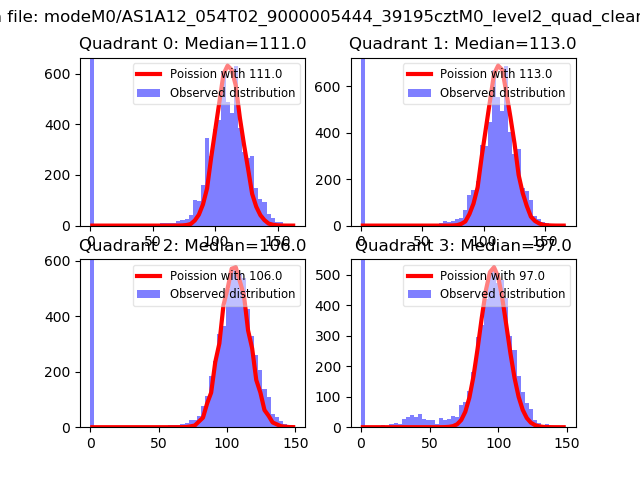 |
 |
| Quadrant-wise count rates Data is divided into 100 sec bins |
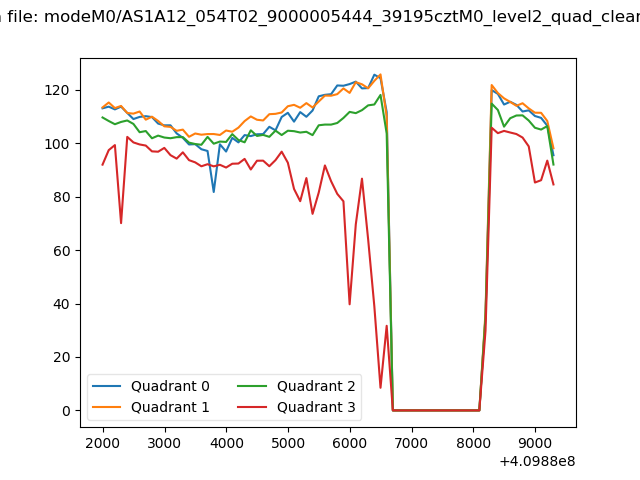 |
|
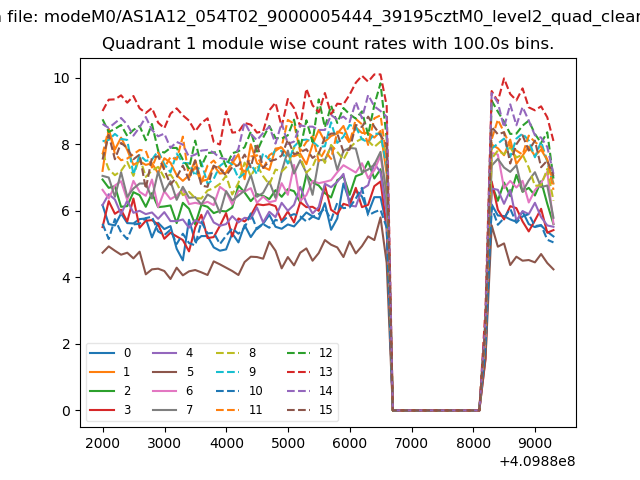
| Module-wise count rates for Quadrant A Data is divided into 100 sec bins |
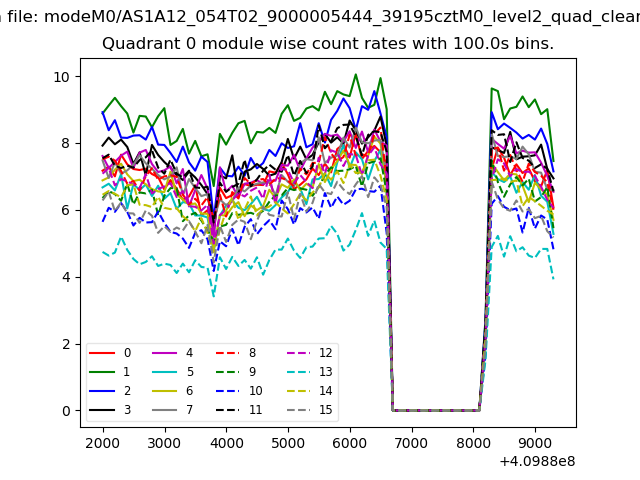 |
 |
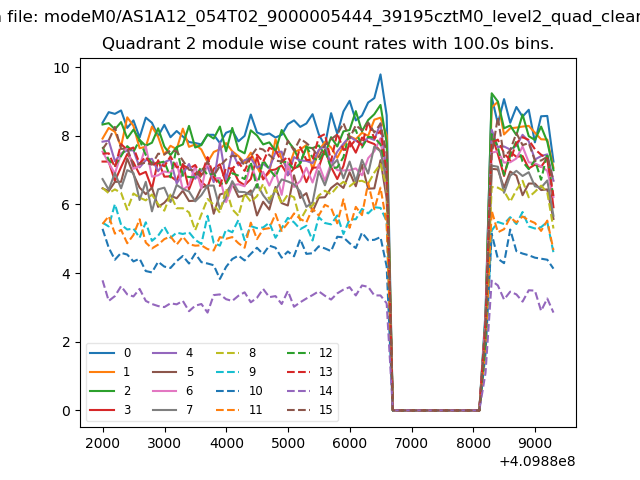
| Module-wise count rates for Quadrant B Data is divided into 100 sec bins |
 |
 |
| Module-wise count rates for Quadrant C Data is divided into 100 sec bins |
 |
 |
| Module-wise count rates for Quadrant D Data is divided into 100 sec bins |
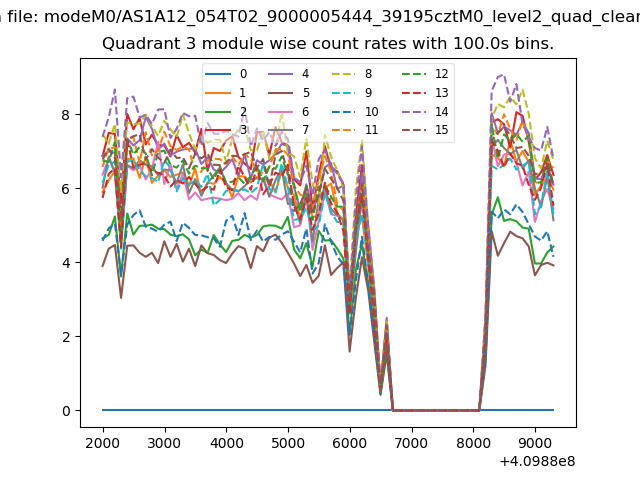 |
 |
| Parameter | Plot |
|---|---|
| CZT HV Monitor | 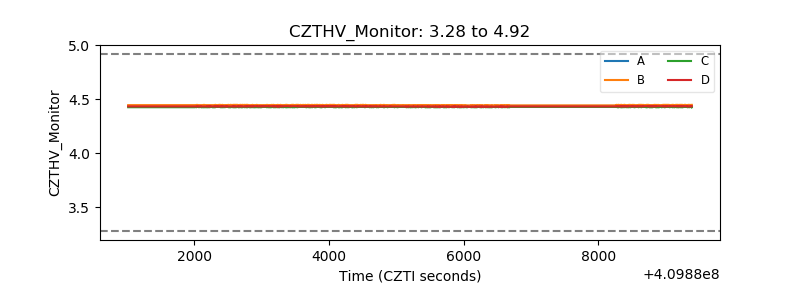 |
| D_VDD | 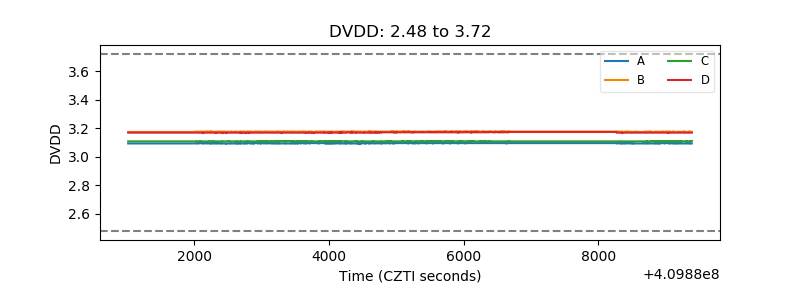 |
| Temperature 1 | 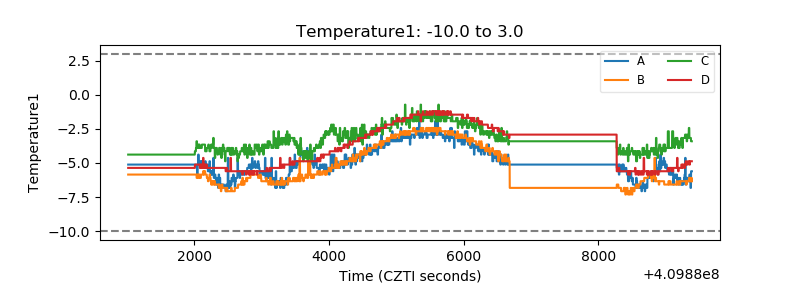 |
| Veto HV Monitor | 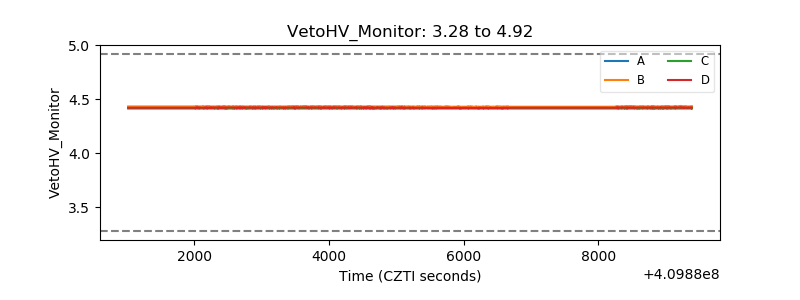 |
| Veto LLD | 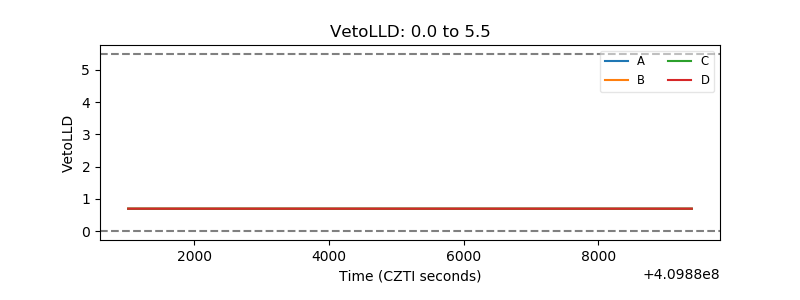 |
| Alpha Counter | 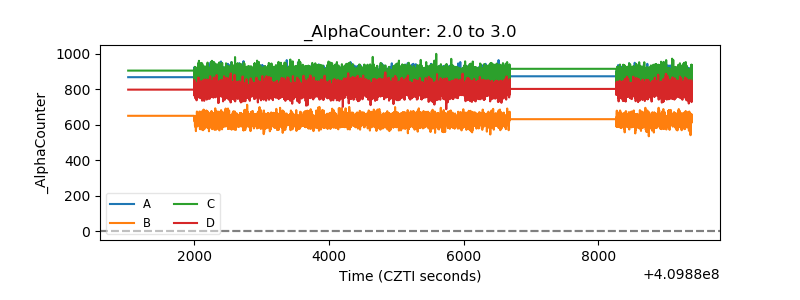 |
| _CPM_Rate | 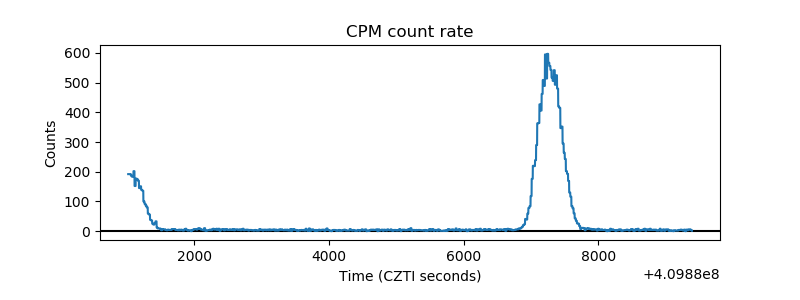 |
| CZT Counter |  |
| +2.5 Volts monitor | 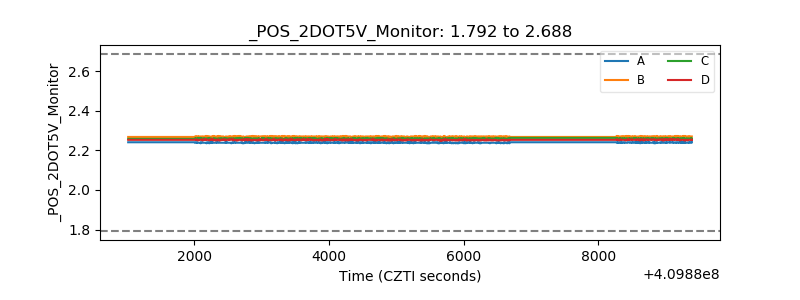 |
| +5 Volts monitor | 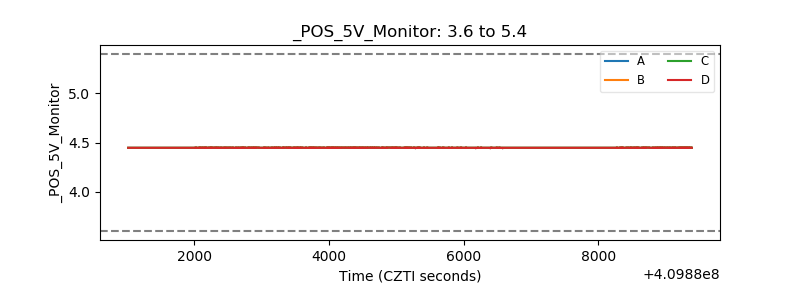 |
| _ROLL_ROT | 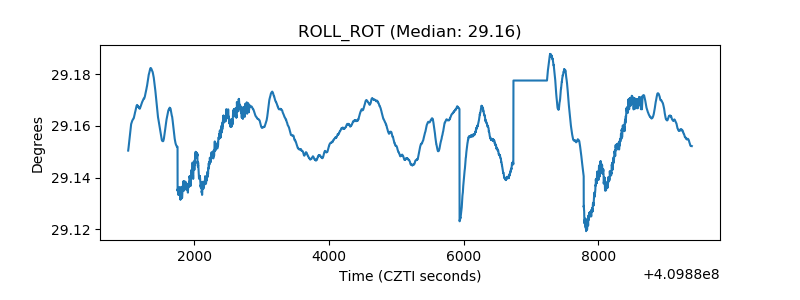 |
| _Roll_DEC | 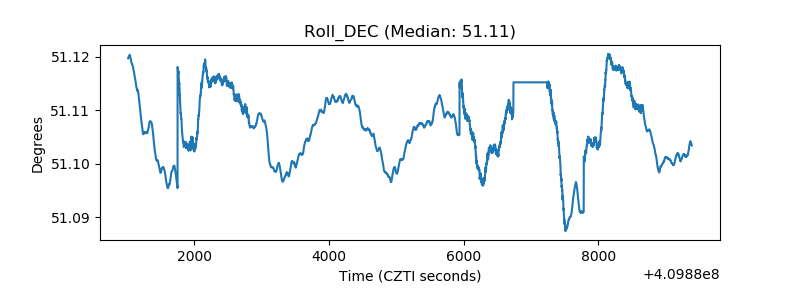 |
| _Roll_RA | 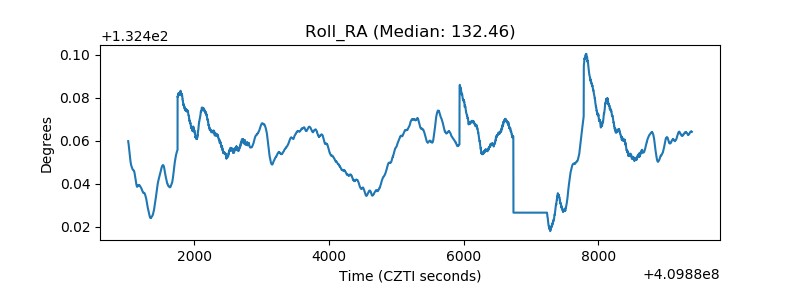 |
| Veto Counter | 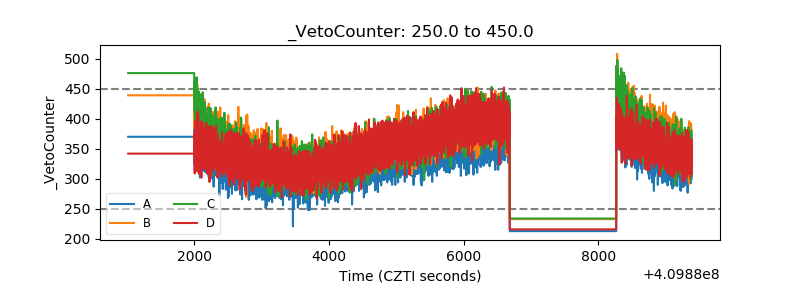 |