| Param | Original file | Final file |
|---|---|---|
| Filename | modeM0/AS1A12_054T02_9000005444_39196cztM0_level2.fits | modeM0/AS1A12_054T02_9000005444_39196cztM0_level2_quad_clean.evt |
| Size (bytes) | 308,491,200 | 93,349,440 |
| Size | 294.2 MB | 89.0 MB |
| Events in quadrant A | 2,873,175 | 630,084 |
| Events in quadrant B | 2,380,620 | 643,695 |
| Events in quadrant C | 2,524,845 | 603,435 |
| Events in quadrant D | 3,206,631 | 559,925 |
| Mode M9 | |||
|---|---|---|---|
| Quadrant | BADHDUFLAG | Total packets | Discarded packets |
| A | 0 | 26 | 0 |
| B | 0 | 26 | 0 |
| C | 0 | 26 | 0 |
| D | 0 | 27 | 0 |
| Mode M0 | |||
|---|---|---|---|
| Quadrant | BADHDUFLAG | Total packets | Discarded packets |
| A | 0 | 11992 | 3 |
| B | 0 | 11152 | 2 |
| C | 0 | 11183 | 2 |
| D | 0 | 13449 | 2 |
| Mode SS | |||
|---|---|---|---|
| Quadrant | BADHDUFLAG | Total packets | Discarded packets |
| A | 0 | 114 | 0 |
| B | 0 | 114 | 0 |
| C | 0 | 114 | 0 |
| D | 0 | 114 | 0 |
| Quadrant | Total seconds | Saturated seconds | Saturation percentage |
|---|---|---|---|
| A | 5566 | 16 | 0.287460% |
| B | 5566 | 4 | 0.071865% |
| C | 5566 | 4 | 0.071865% |
| D | 5566 | 89 | 1.598994% |
Noise dominated data is calculated using 1-second bins in cleaned event files. If a bin has >2000 counts, and if more than 50% of those come from <1% of pixels, then it is considered to be noise-dominated and hence unusable.
| Quadrant | # 1 sec bins | Bins with >0 counts | Bins with >2000 counts | High rate bins dominated by noise | Noise dominated (total time) | Noise dominated (detector-on time) | Marked lightcurve |
|---|---|---|---|---|---|---|---|
| A | 7269 | 5567 | 12 | 12 | 0.17% | 0.22% | 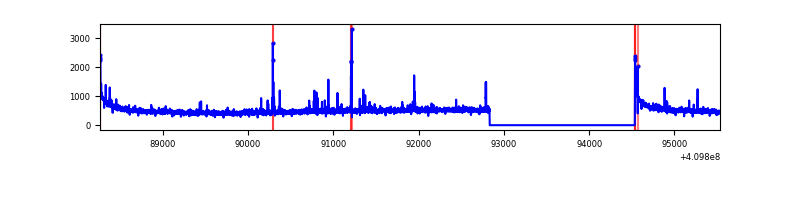 |
| B | 7269 | 5567 | 0 | 0 | 0.00% | 0.00% | 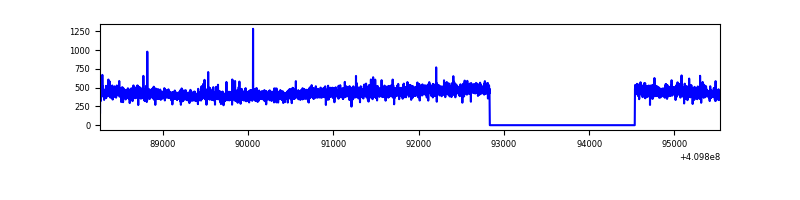 |
| C | 7269 | 5567 | 0 | 0 | 0.00% | 0.00% | 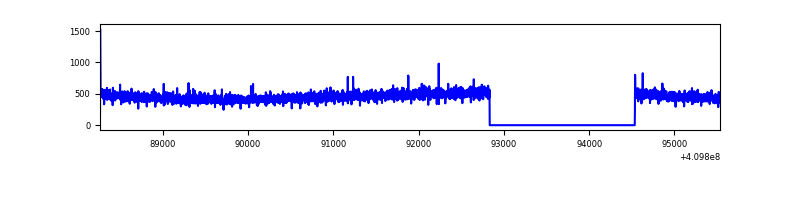 |
| D | 7269 | 5567 | 109 | 109 | 1.50% | 1.96% | 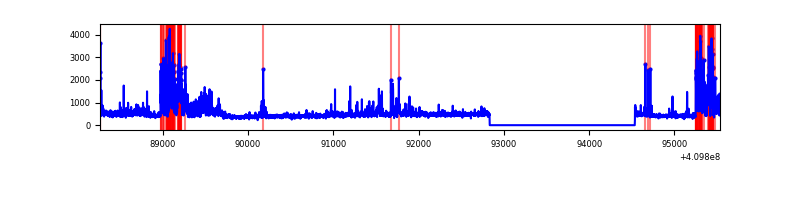 |
Top three noisy pixels from each quadrant. If the there are fewer than three noisy pixels in the level2.evt file, extra rows are filled as -1
| Pixel properties | Quadrant properties | ||||||
|---|---|---|---|---|---|---|---|
| Quadrant | DetID | PixID | Counts | Sigma | Mean | Median | Sigma |
| A | 10 | 83 | 438989 | 3569.73 | 606 | 594 | 122.8 |
| A | 9 | 143 | 79538 | 642.82 | 606 | 594 | 122.8 |
| A | 2 | 79 | 12464 | 96.65 | 606 | 594 | 122.8 |
| B | 12 | 111 | 14539 | 119.58 | 600 | 582 | 116.7 |
| B | 11 | 111 | 13195 | 108.06 | 600 | 582 | 116.7 |
| B | 14 | 111 | 12767 | 104.4 | 600 | 582 | 116.7 |
| C | 15 | 214 | 235707 | 1730.17 | 583 | 586 | 135.9 |
| C | 5 | 251 | 6406 | 42.83 | 583 | 586 | 135.9 |
| C | 0 | 10 | 4883 | 31.62 | 583 | 586 | 135.9 |
| D | 12 | 235 | 502930 | 3543.31 | 584 | 568 | 141.8 |
| D | 2 | 249 | 297870 | 2096.96 | 584 | 568 | 141.8 |
| D | 5 | 222 | 59432 | 415.19 | 584 | 568 | 141.8 |
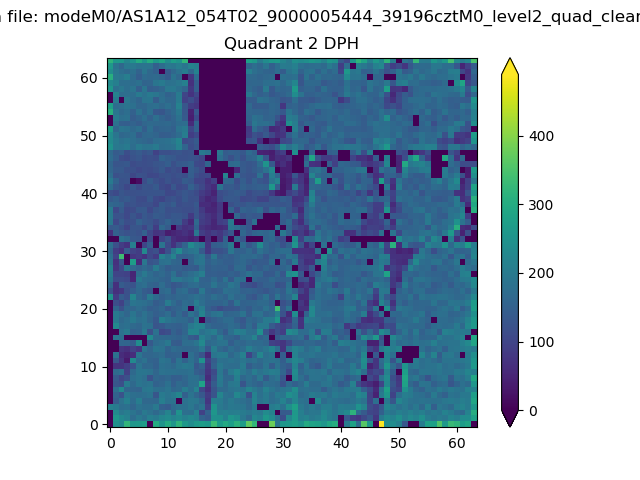
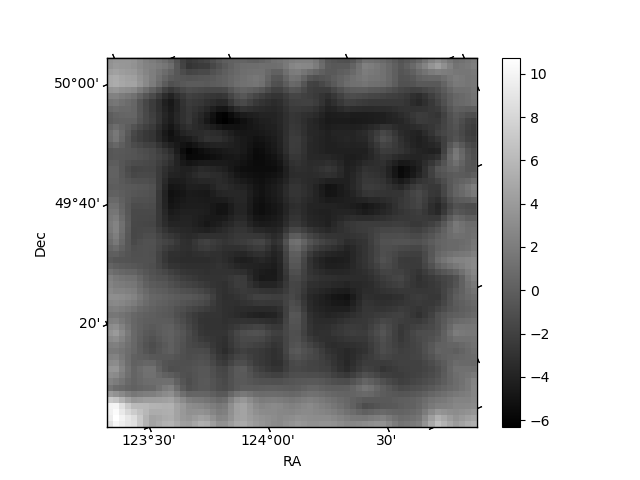
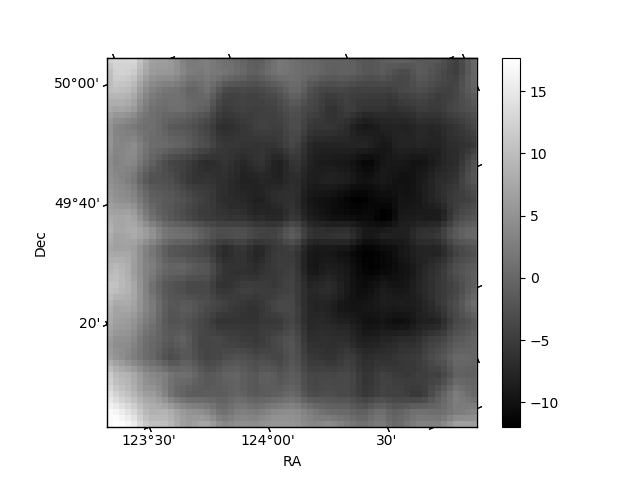
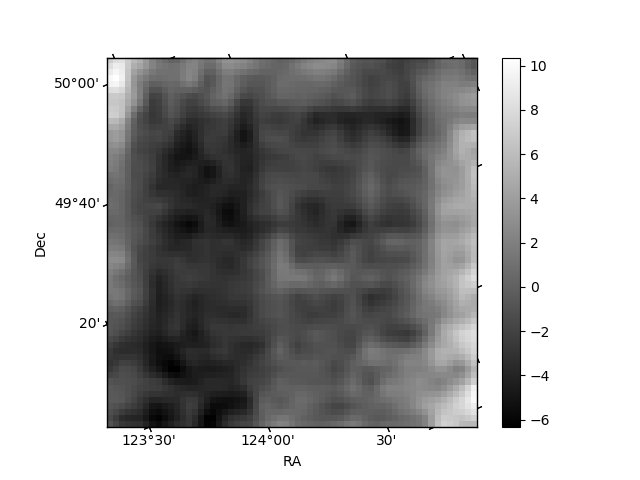
Histogram calculated using DETX and DETY for each event in the final _common_clean file
| Quadrant A | 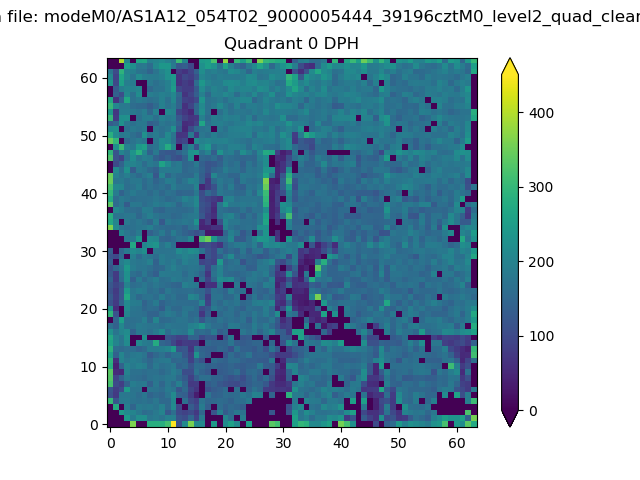 |
 |
Quadrant B |
|---|---|---|---|
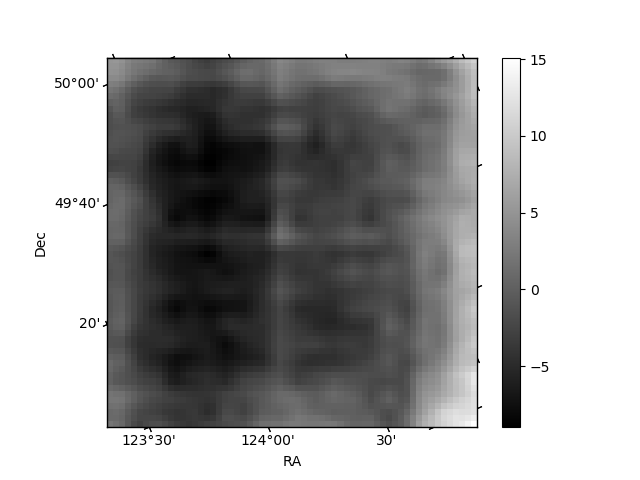
| Quadrant D |  |
 |
Quadrant C |
| Plot type | Count rate plots | Images |
|---|---|---|
| Comparison with Poisson distribution Blue bars denote a histogram of data divided into 1 sec bins. Red curve is a Poisson curve with rate = median count rate of data. |
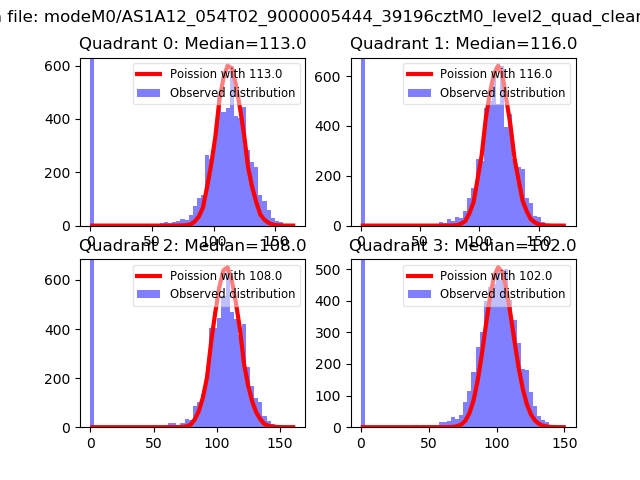 |
 |
| Quadrant-wise count rates Data is divided into 100 sec bins |
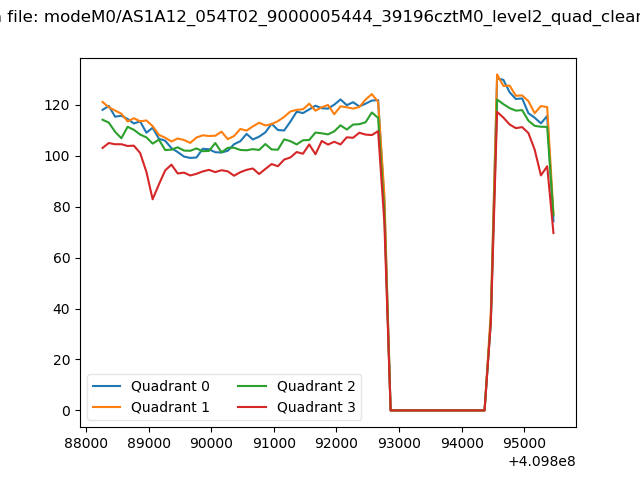 |
|
| Module-wise count rates for Quadrant A Data is divided into 100 sec bins |
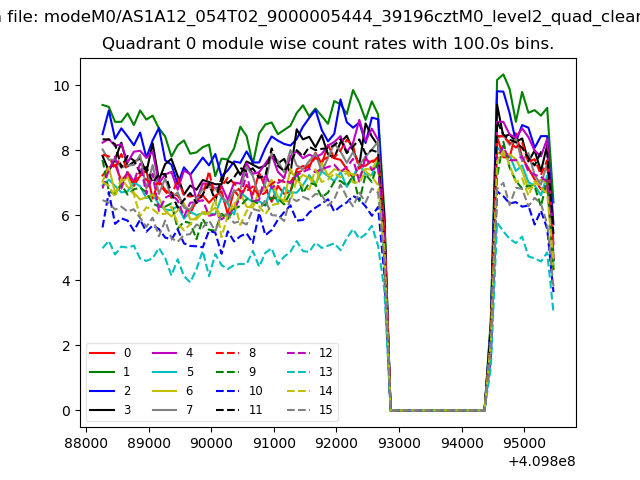 |
 |
| Module-wise count rates for Quadrant B Data is divided into 100 sec bins |
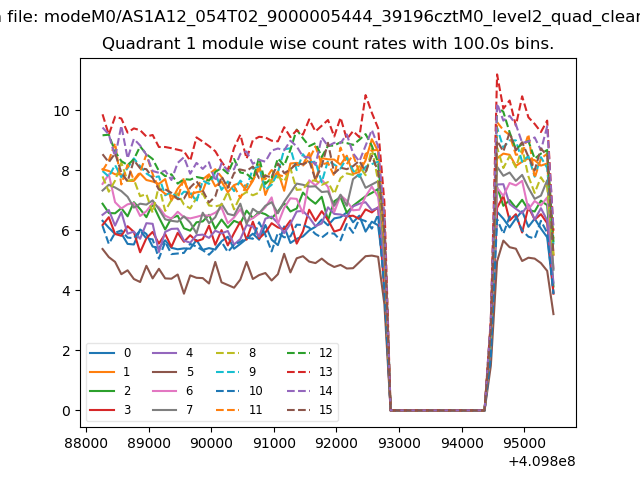 |
 |
| Module-wise count rates for Quadrant C Data is divided into 100 sec bins |
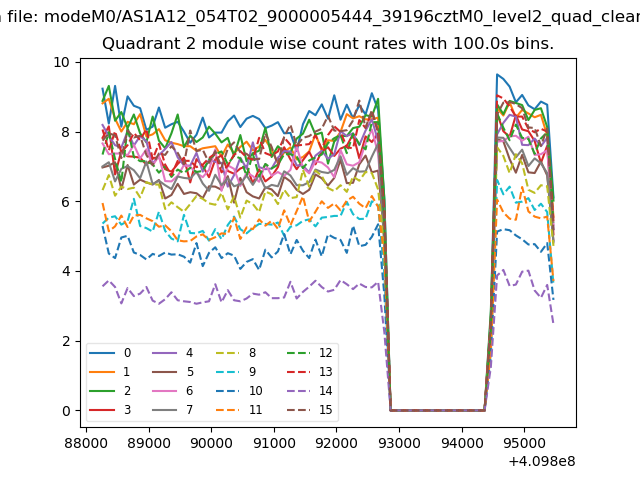 |
 |
| Module-wise count rates for Quadrant D Data is divided into 100 sec bins |
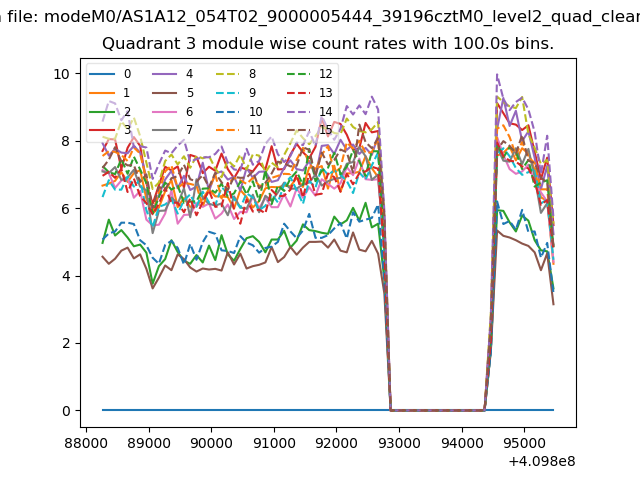 |
 |
| Parameter | Plot |
|---|---|
| CZT HV Monitor | 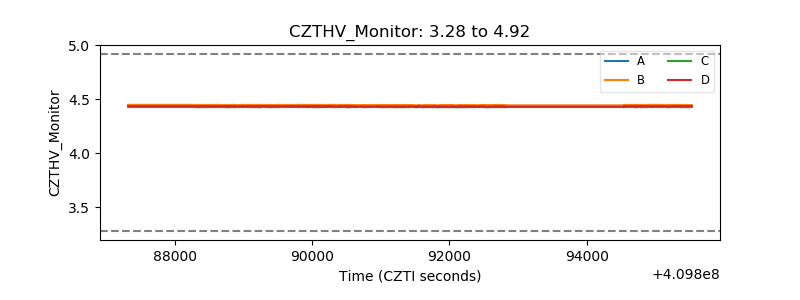 |
| D_VDD | 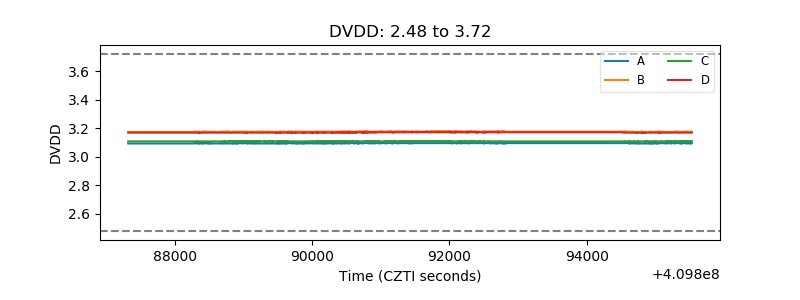 |
| Temperature 1 | 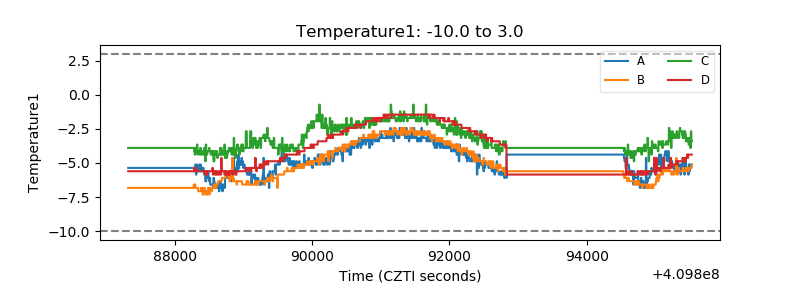 |
| Veto HV Monitor |  |
| Veto LLD | 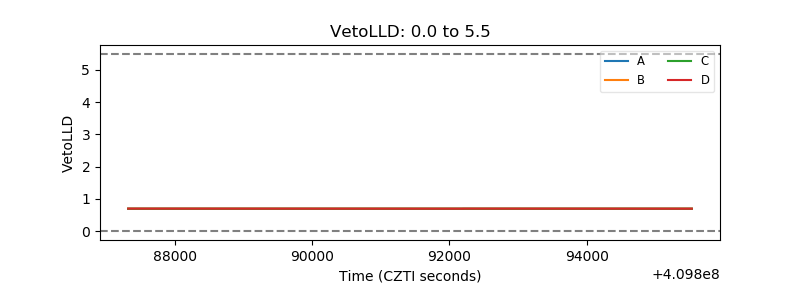 |
| Alpha Counter | 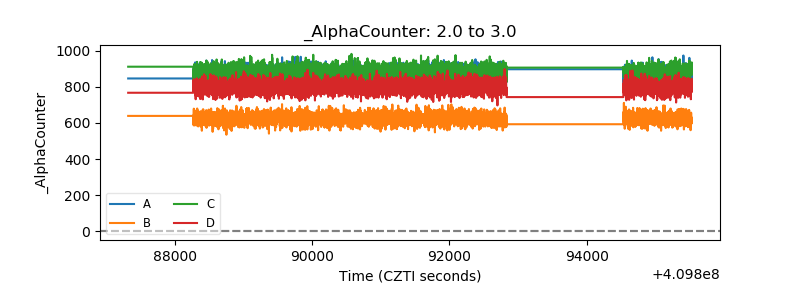 |
| _CPM_Rate | 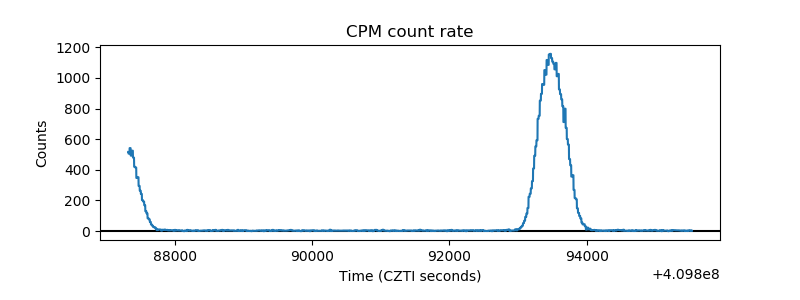 |
| CZT Counter | 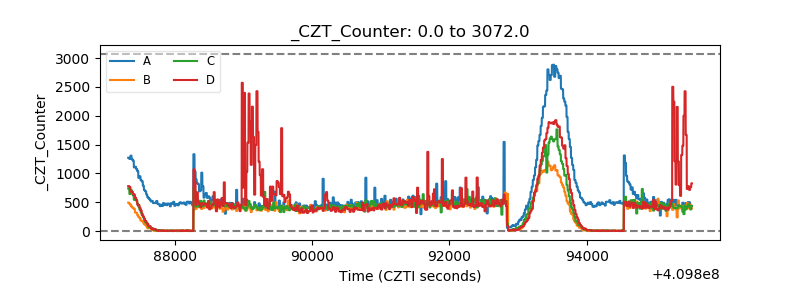 |
| +2.5 Volts monitor | 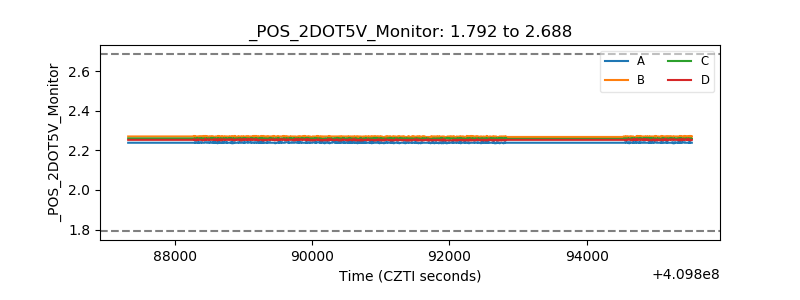 |
| +5 Volts monitor | 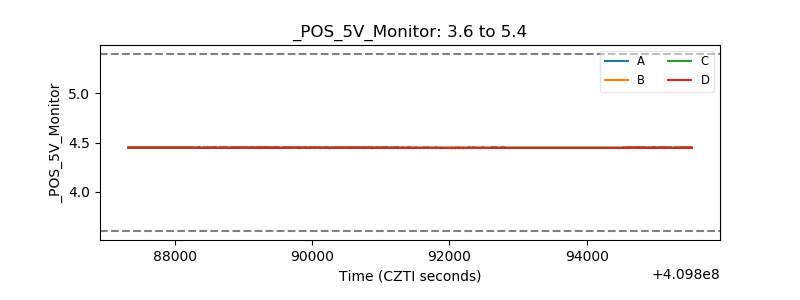 |
| _ROLL_ROT | 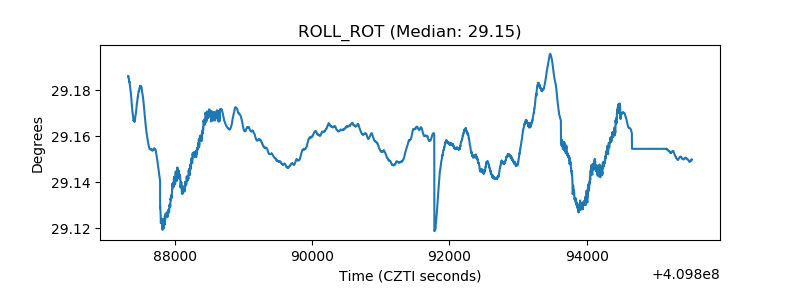 |
| _Roll_DEC | 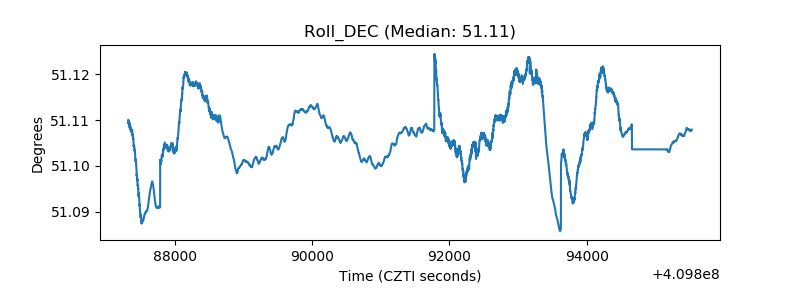 |
| _Roll_RA | 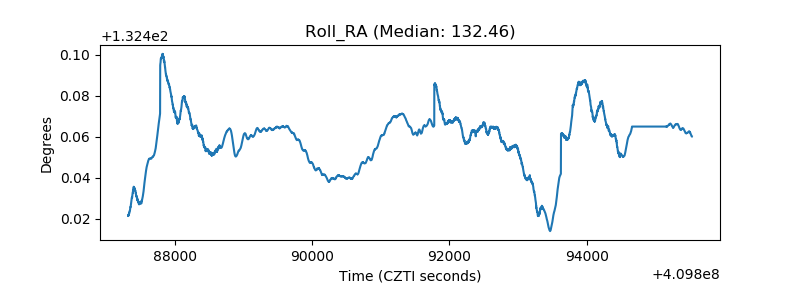 |
| Veto Counter | 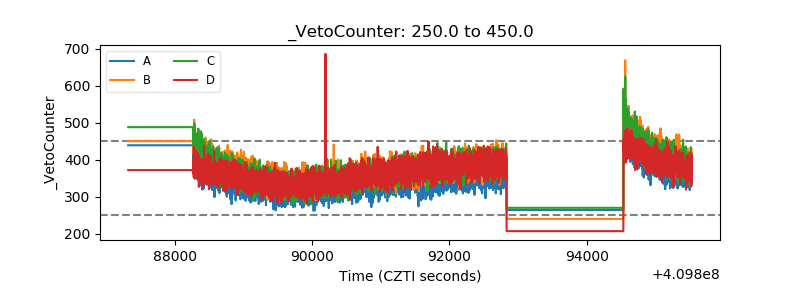 |