| Param | Original file | Final file |
|---|---|---|
| Filename | modeM0/AS1A12_054T02_9000005444_39199cztM0_level2.fits | modeM0/AS1A12_054T02_9000005444_39199cztM0_level2_quad_clean.evt |
| Size (bytes) | 815,158,080 | 144,069,120 |
| Size | 777.4 MB | 137.4 MB |
| Events in quadrant A | 4,662,462 | 1,094,409 |
| Events in quadrant B | 4,177,758 | 1,103,901 |
| Events in quadrant C | 4,279,502 | 1,025,790 |
| Events in quadrant D | 16,360,972 | 517,362 |
| Mode M9 | |||
|---|---|---|---|
| Quadrant | BADHDUFLAG | Total packets | Discarded packets |
| A | 0 | 38 | 0 |
| B | 0 | 38 | 0 |
| C | 0 | 38 | 0 |
| D | 0 | 38 | 0 |
| Mode M0 | |||
|---|---|---|---|
| Quadrant | BADHDUFLAG | Total packets | Discarded packets |
| A | 0 | 19023 | 3 |
| B | 0 | 18403 | 2 |
| C | 0 | 18185 | 2 |
| D | 0 | 54748 | 2 |
| Mode SS | |||
|---|---|---|---|
| Quadrant | BADHDUFLAG | Total packets | Discarded packets |
| A | 0 | 184 | 0 |
| B | 0 | 184 | 0 |
| C | 0 | 184 | 0 |
| D | 0 | 184 | 0 |
| Quadrant | Total seconds | Saturated seconds | Saturation percentage |
|---|---|---|---|
| A | 8941 | 22 | 0.246057% |
| B | 8941 | 53 | 0.592775% |
| C | 8941 | 6 | 0.067107% |
| D | 8941 | 4699 | 52.555643% |
Noise dominated data is calculated using 1-second bins in cleaned event files. If a bin has >2000 counts, and if more than 50% of those come from <1% of pixels, then it is considered to be noise-dominated and hence unusable.
| Quadrant | # 1 sec bins | Bins with >0 counts | Bins with >2000 counts | High rate bins dominated by noise | Noise dominated (total time) | Noise dominated (detector-on time) | Marked lightcurve |
|---|---|---|---|---|---|---|---|
| A | 12767 | 8943 | 12 | 12 | 0.09% | 0.13% | 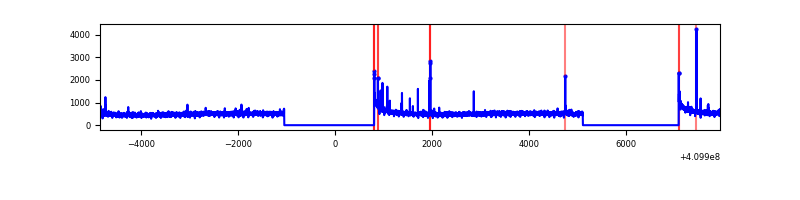 |
| B | 12767 | 8943 | 17 | 17 | 0.13% | 0.19% | 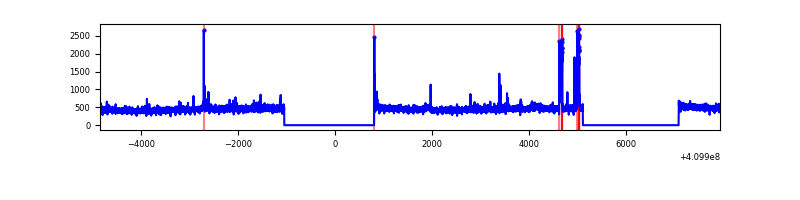 |
| C | 12767 | 8943 | 2 | 2 | 0.02% | 0.02% | 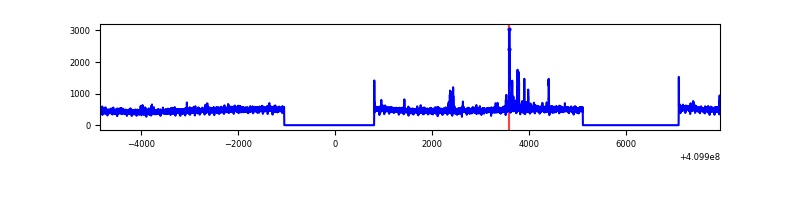 |
| D | 12767 | 8943 | 3780 | 3780 | 29.61% | 42.27% | 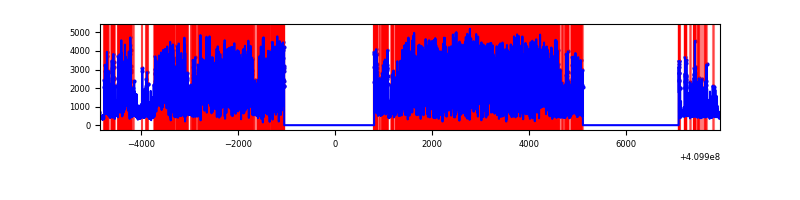 |
Top three noisy pixels from each quadrant. If the there are fewer than three noisy pixels in the level2.evt file, extra rows are filled as -1
| Pixel properties | Quadrant properties | ||||||
|---|---|---|---|---|---|---|---|
| Quadrant | DetID | PixID | Counts | Sigma | Mean | Median | Sigma |
| A | 10 | 83 | 606176 | 2947.22 | 1032 | 1015 | 205.3 |
| A | 9 | 143 | 66409 | 318.48 | 1032 | 1015 | 205.3 |
| A | 3 | 137 | 10656 | 46.95 | 1032 | 1015 | 205.3 |
| B | 5 | 184 | 177832 | 914.91 | 1013 | 989 | 193.3 |
| B | 12 | 111 | 23661 | 117.29 | 1013 | 989 | 193.3 |
| B | 11 | 111 | 21946 | 108.42 | 1013 | 989 | 193.3 |
| C | 15 | 214 | 369714 | 1638.98 | 981 | 986 | 225.0 |
| C | 9 | 187 | 62027 | 271.33 | 981 | 986 | 225.0 |
| C | 7 | 220 | 10073 | 40.39 | 981 | 986 | 225.0 |
| D | 12 | 235 | 12688045 | 68438.73 | 748 | 726 | 185.4 |
| D | 2 | 249 | 486915 | 2622.63 | 748 | 726 | 185.4 |
| D | 2 | 250 | 73105 | 390.43 | 748 | 726 | 185.4 |
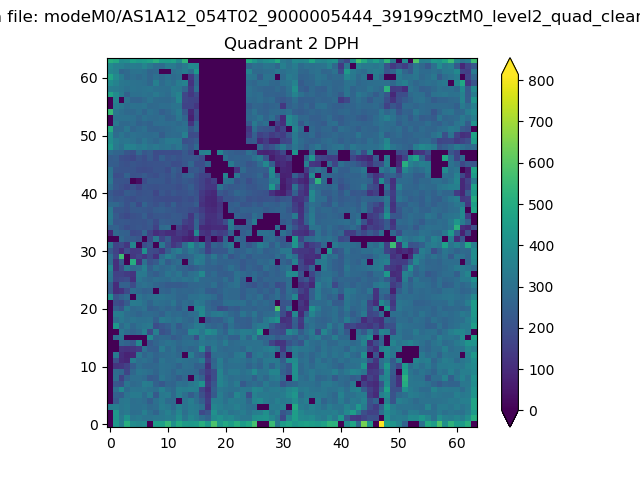
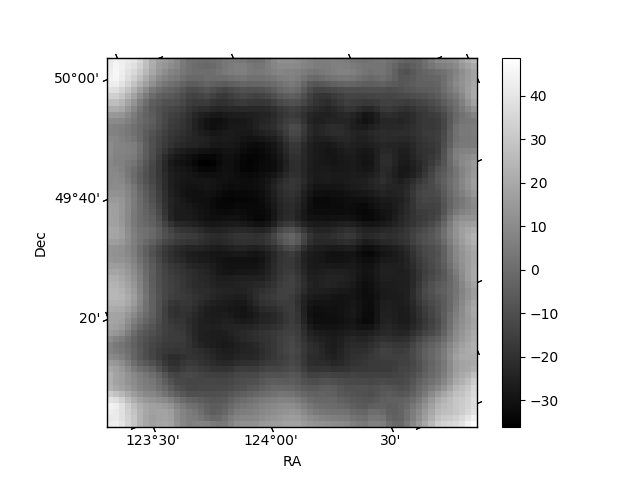
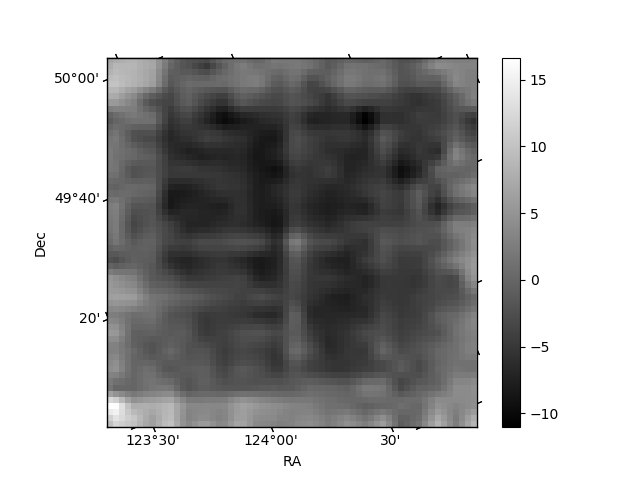
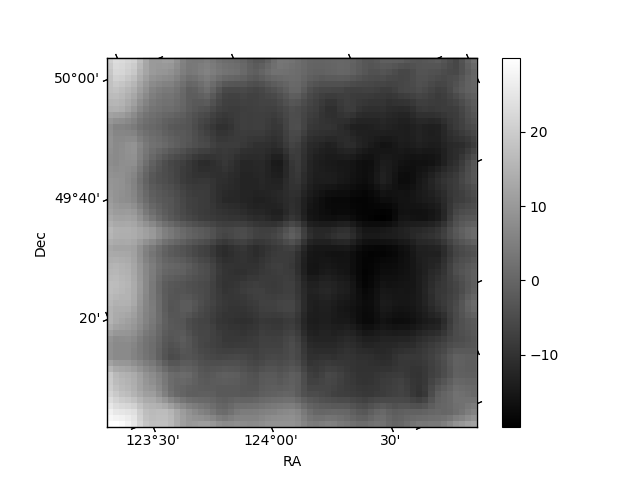
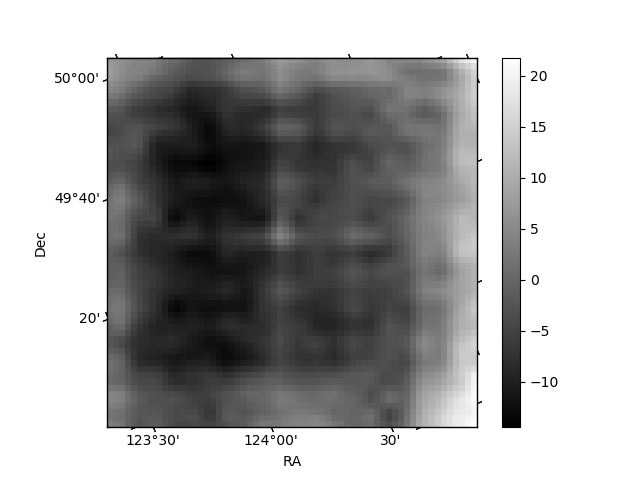
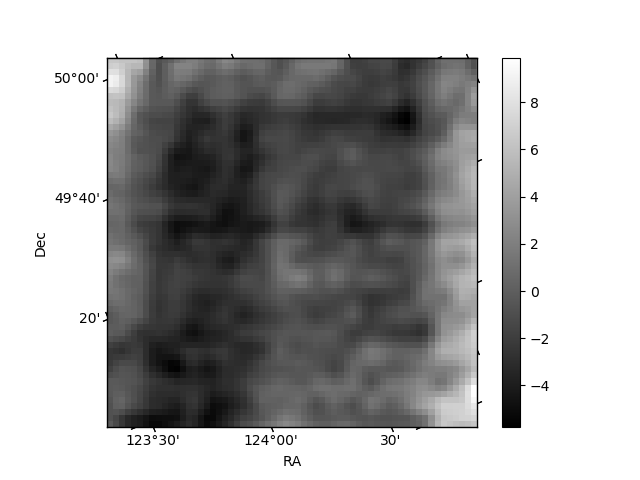
Histogram calculated using DETX and DETY for each event in the final _common_clean file
| Quadrant A | 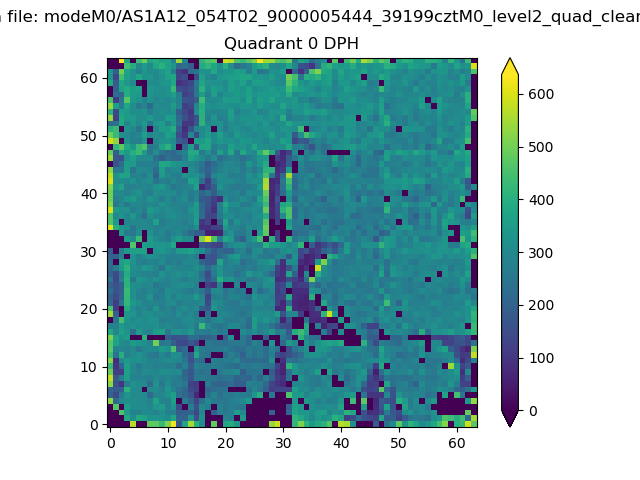 |
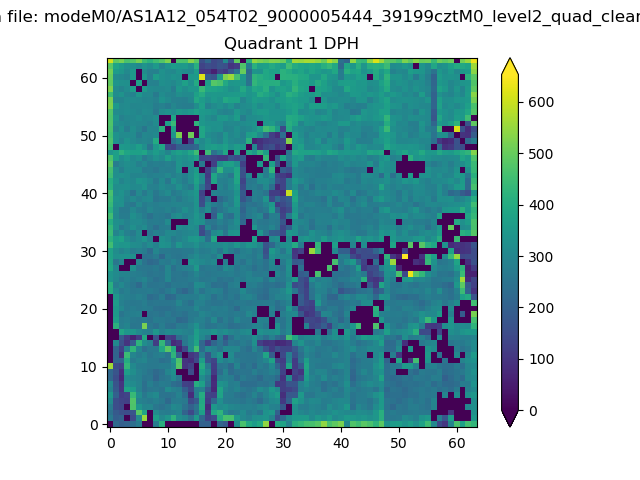 |
Quadrant B |
|---|---|---|---|
| Quadrant D | 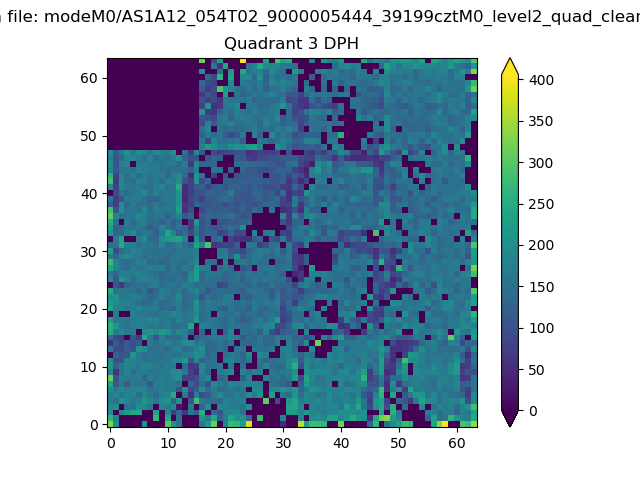 |
 |
Quadrant C |
| Plot type | Count rate plots | Images |
|---|---|---|
| Comparison with Poisson distribution Blue bars denote a histogram of data divided into 1 sec bins. Red curve is a Poisson curve with rate = median count rate of data. |
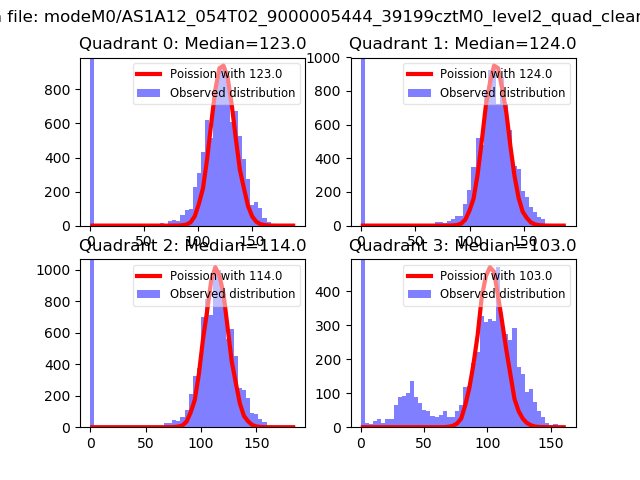 |
 |
| Quadrant-wise count rates Data is divided into 100 sec bins |
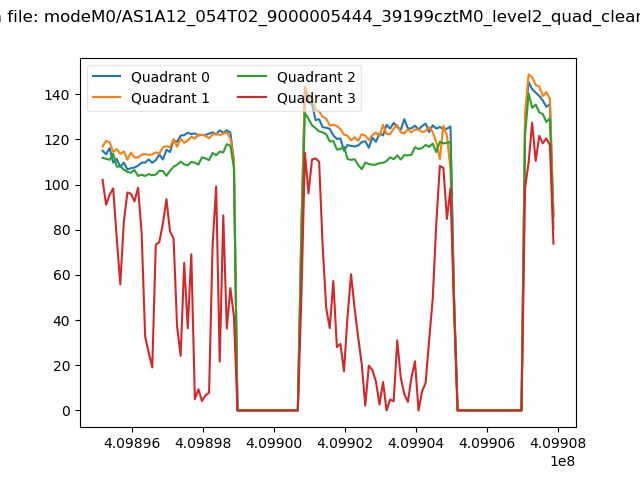 |
|
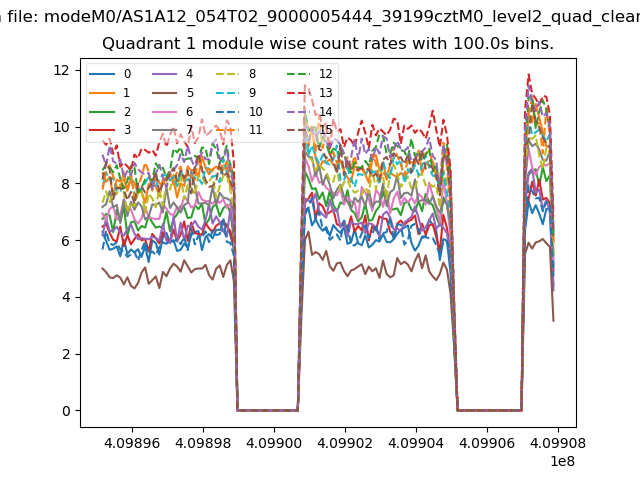
| Module-wise count rates for Quadrant A Data is divided into 100 sec bins |
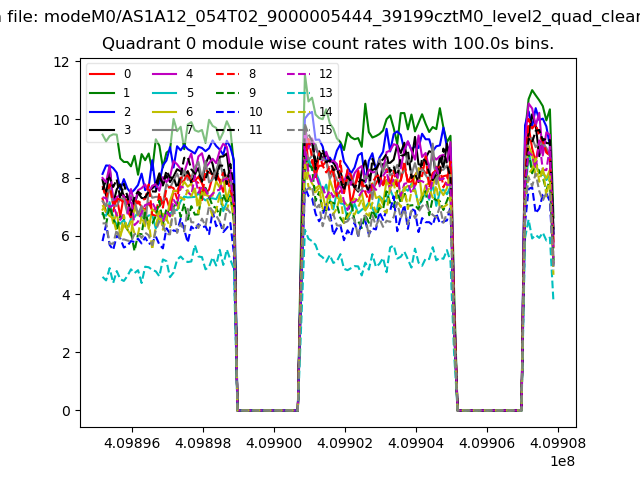 |
 |
| Module-wise count rates for Quadrant B Data is divided into 100 sec bins |
 |
 |
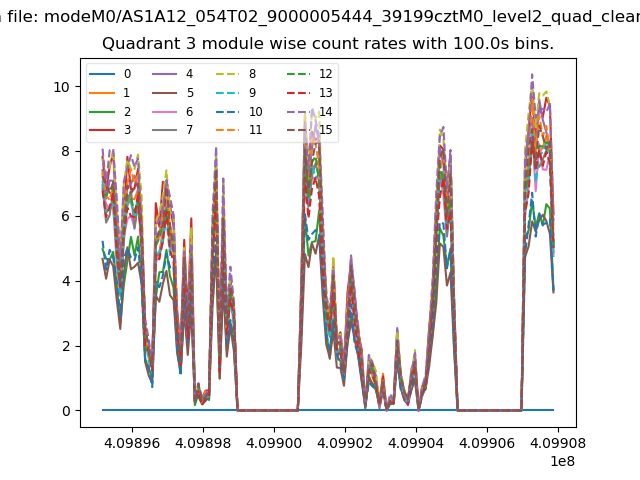
| Module-wise count rates for Quadrant C Data is divided into 100 sec bins |
 |
 |
| Module-wise count rates for Quadrant D Data is divided into 100 sec bins |
 |
 |
| Parameter | Plot |
|---|---|
| CZT HV Monitor | 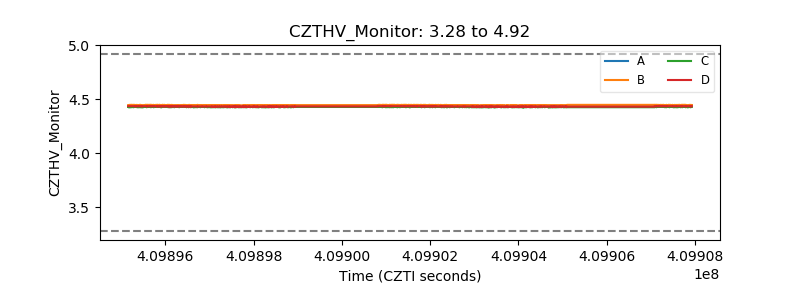 |
| D_VDD | 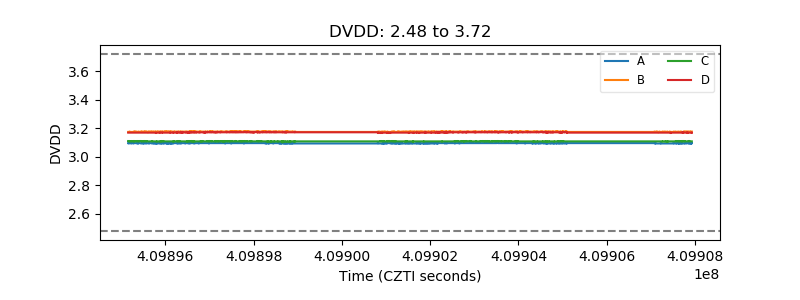 |
| Temperature 1 | 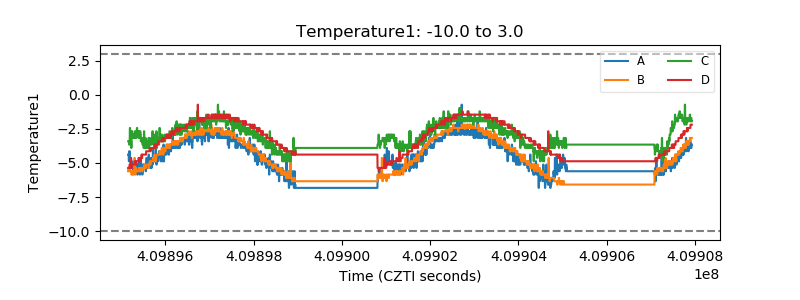 |
| Veto HV Monitor | 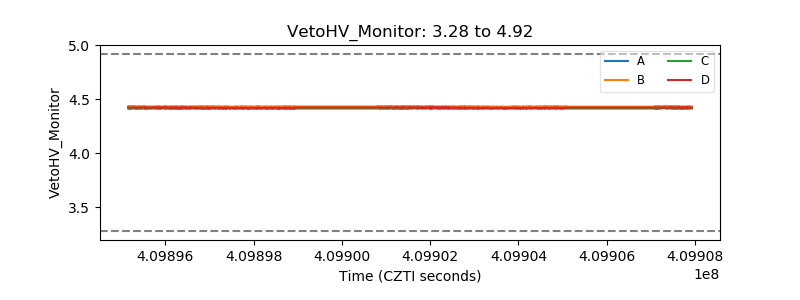 |
| Veto LLD | 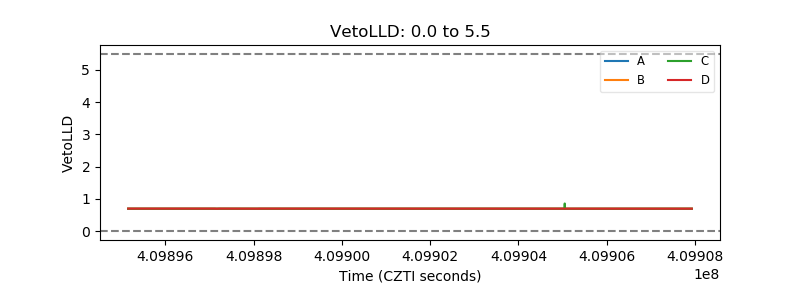 |
| Alpha Counter | 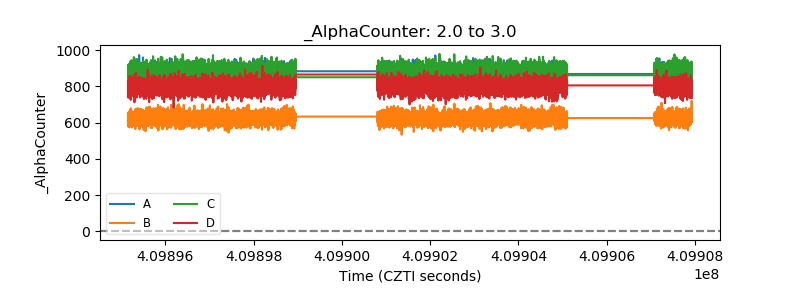 |
| _CPM_Rate | 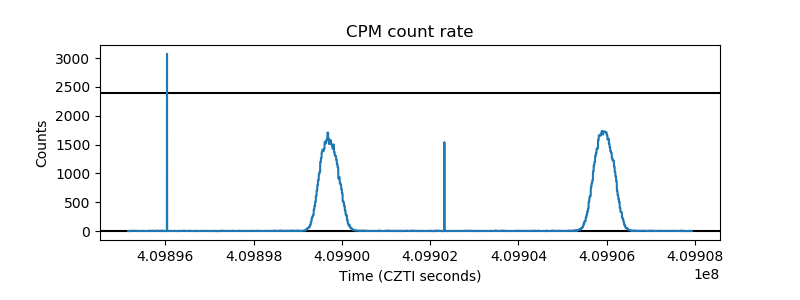 |
| CZT Counter | 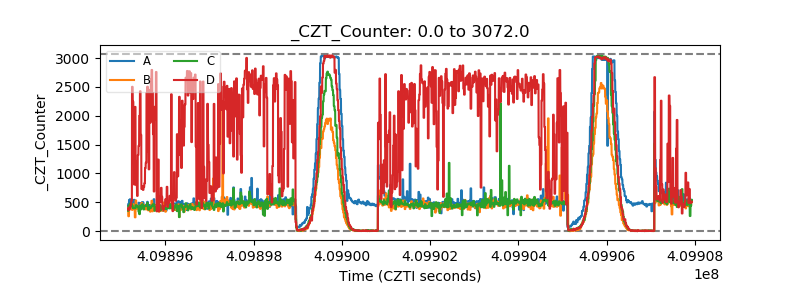 |
| +2.5 Volts monitor | 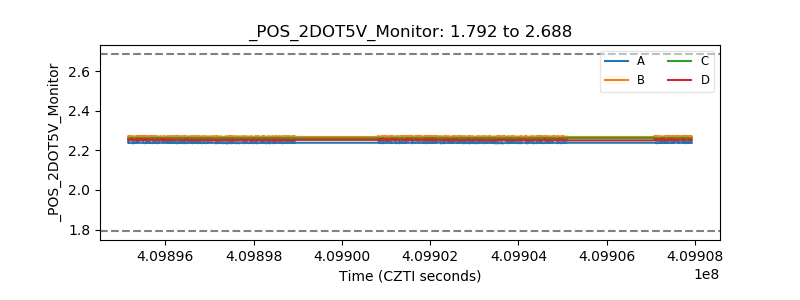 |
| +5 Volts monitor | 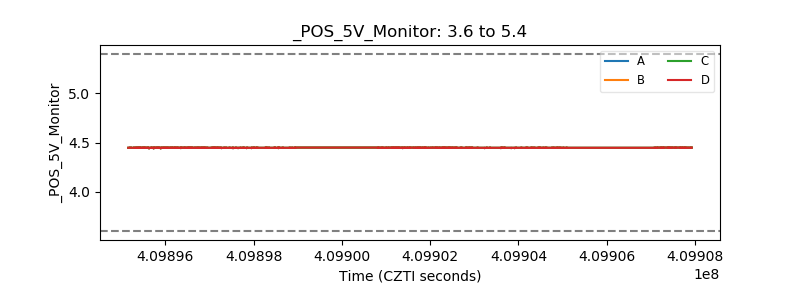 |
| _ROLL_ROT | 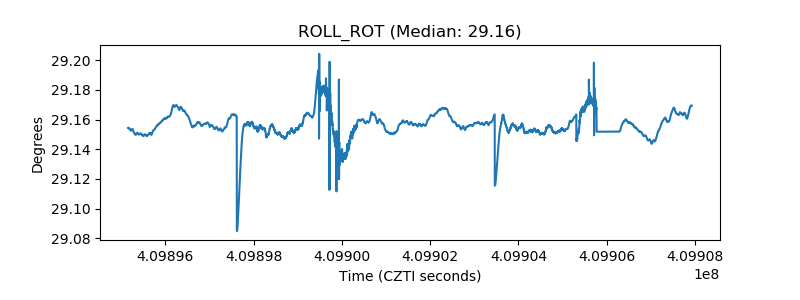 |
| _Roll_DEC | 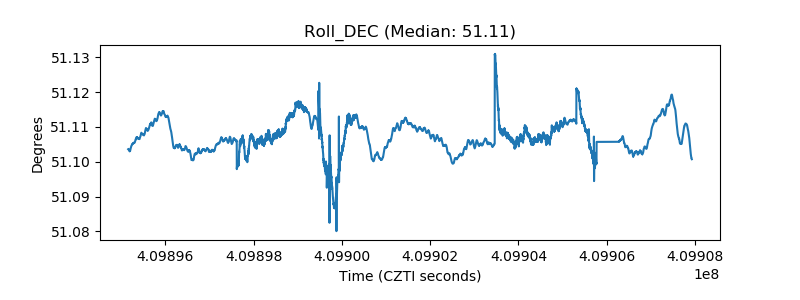 |
| _Roll_RA | 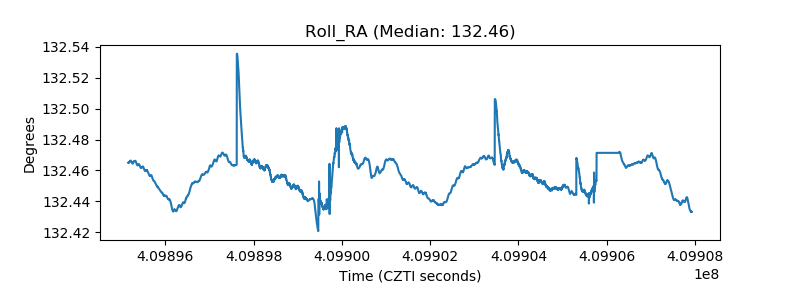 |
| Veto Counter | 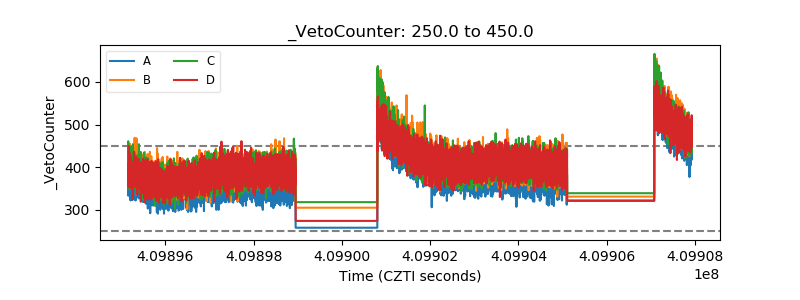 |