| Param | Original file | Final file |
|---|---|---|
| Filename | modeM0/AS1A12_054T02_9000005444_39200cztM0_level2.fits | modeM0/AS1A12_054T02_9000005444_39200cztM0_level2_quad_clean.evt |
| Size (bytes) | 397,212,480 | 88,793,280 |
| Size | 378.8 MB | 84.7 MB |
| Events in quadrant A | 3,131,169 | 634,772 |
| Events in quadrant B | 2,393,402 | 645,604 |
| Events in quadrant C | 2,412,449 | 598,975 |
| Events in quadrant D | 6,387,413 | 467,872 |
| Mode M9 | |||
|---|---|---|---|
| Quadrant | BADHDUFLAG | Total packets | Discarded packets |
| A | 0 | 28 | 0 |
| B | 0 | 28 | 0 |
| C | 0 | 28 | 0 |
| D | 0 | 29 | 0 |
| Mode M0 | |||
|---|---|---|---|
| Quadrant | BADHDUFLAG | Total packets | Discarded packets |
| A | 0 | 12227 | 3 |
| B | 0 | 10109 | 2 |
| C | 0 | 9878 | 2 |
| D | 0 | 22279 | 2 |
| Mode SS | |||
|---|---|---|---|
| Quadrant | BADHDUFLAG | Total packets | Discarded packets |
| A | 0 | 98 | 0 |
| B | 0 | 98 | 0 |
| C | 0 | 98 | 0 |
| D | 0 | 98 | 0 |
| Quadrant | Total seconds | Saturated seconds | Saturation percentage |
|---|---|---|---|
| A | 4872 | 111 | 2.278325% |
| B | 4872 | 41 | 0.841544% |
| C | 4872 | 3 | 0.061576% |
| D | 4872 | 1197 | 24.568966% |
Noise dominated data is calculated using 1-second bins in cleaned event files. If a bin has >2000 counts, and if more than 50% of those come from <1% of pixels, then it is considered to be noise-dominated and hence unusable.
| Quadrant | # 1 sec bins | Bins with >0 counts | Bins with >2000 counts | High rate bins dominated by noise | Noise dominated (total time) | Noise dominated (detector-on time) | Marked lightcurve |
|---|---|---|---|---|---|---|---|
| A | 6936 | 4873 | 81 | 81 | 1.17% | 1.66% | 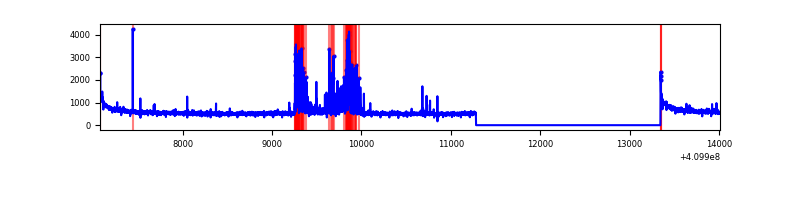 |
| B | 6936 | 4873 | 21 | 21 | 0.30% | 0.43% | 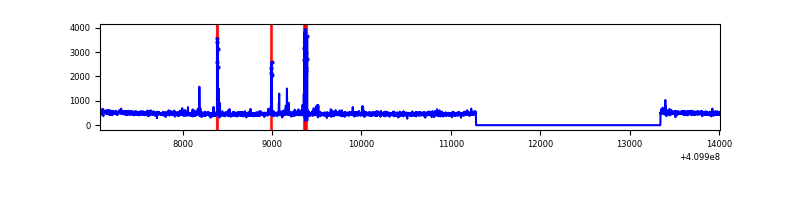 |
| C | 6936 | 4873 | 0 | 0 | 0.00% | 0.00% | 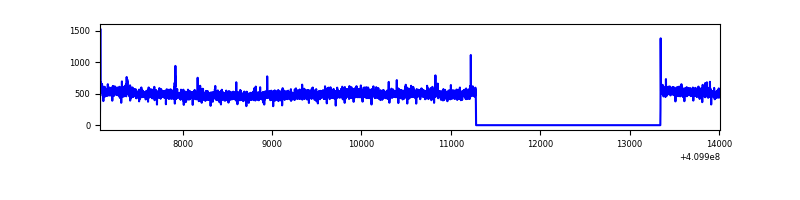 |
| D | 6936 | 4873 | 1013 | 1013 | 14.60% | 20.79% | 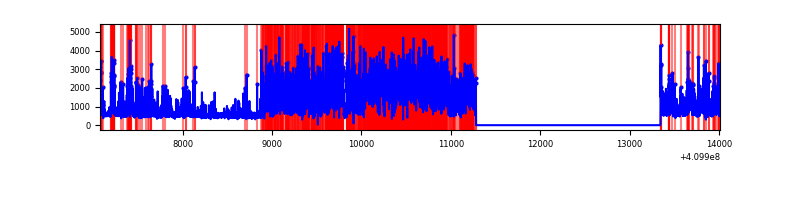 |
Top three noisy pixels from each quadrant. If the there are fewer than three noisy pixels in the level2.evt file, extra rows are filled as -1
| Pixel properties | Quadrant properties | ||||||
|---|---|---|---|---|---|---|---|
| Quadrant | DetID | PixID | Counts | Sigma | Mean | Median | Sigma |
| A | 13 | 248 | 415861 | 3521.36 | 587 | 576 | 117.9 |
| A | 10 | 83 | 402799 | 3410.6 | 587 | 576 | 117.9 |
| A | 9 | 143 | 35389 | 295.19 | 587 | 576 | 117.9 |
| B | 5 | 184 | 76433 | 694.14 | 575 | 560 | 109.3 |
| B | 5 | 172 | 49081 | 443.91 | 575 | 560 | 109.3 |
| B | 0 | 230 | 13703 | 120.24 | 575 | 560 | 109.3 |
| C | 15 | 214 | 208039 | 1601.25 | 560 | 564 | 129.6 |
| C | 0 | 10 | 7153 | 50.85 | 560 | 564 | 129.6 |
| C | 8 | 222 | 5129 | 35.23 | 560 | 564 | 129.6 |
| D | 12 | 235 | 3864486 | 30479.06 | 528 | 514 | 126.8 |
| D | 2 | 249 | 368525 | 2902.88 | 528 | 514 | 126.8 |
| D | 13 | 171 | 30708 | 238.17 | 528 | 514 | 126.8 |
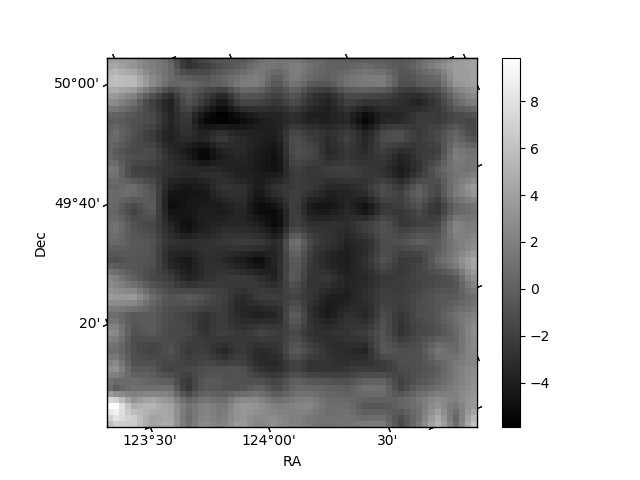
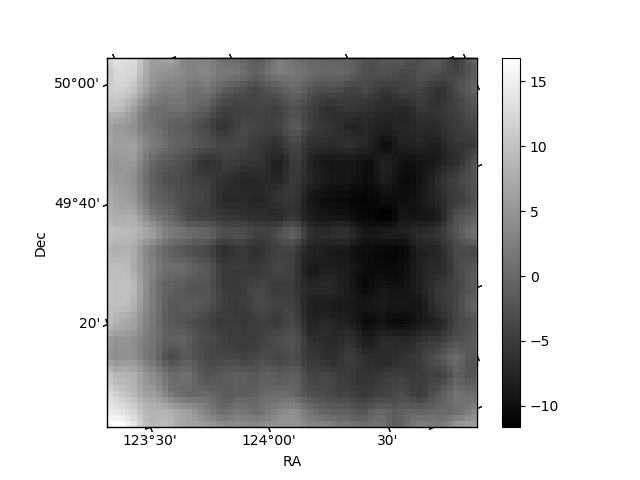
Histogram calculated using DETX and DETY for each event in the final _common_clean file
| Quadrant A | 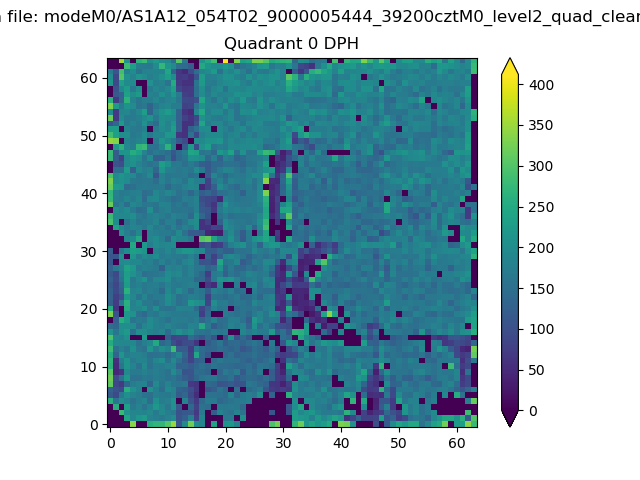 |
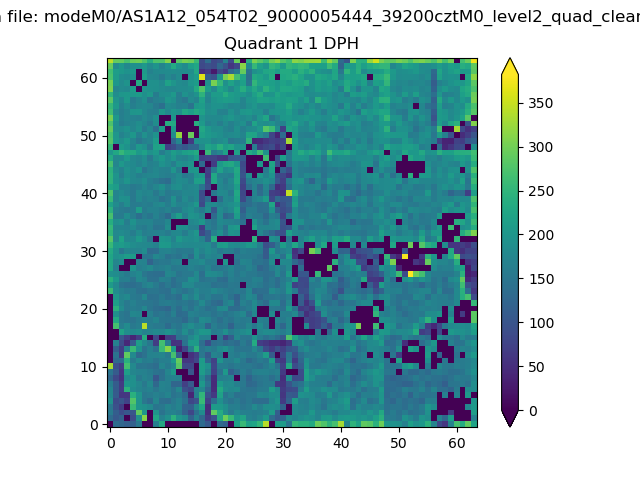 |
Quadrant B |
|---|---|---|---|
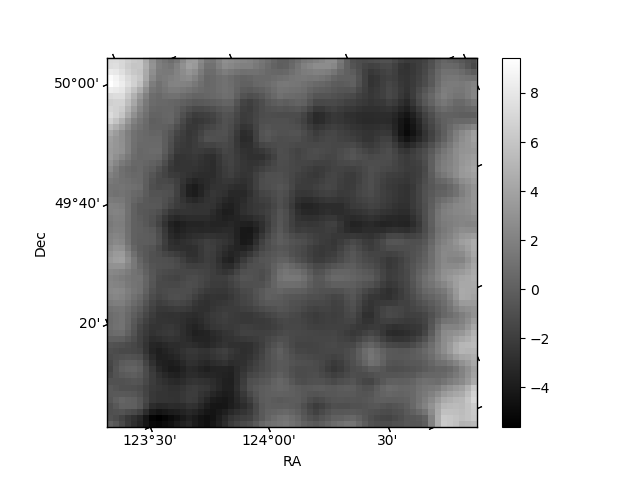
| Quadrant D | 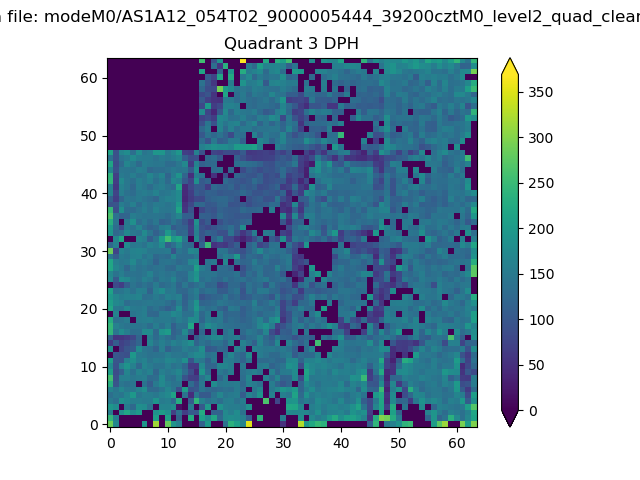 |
 |
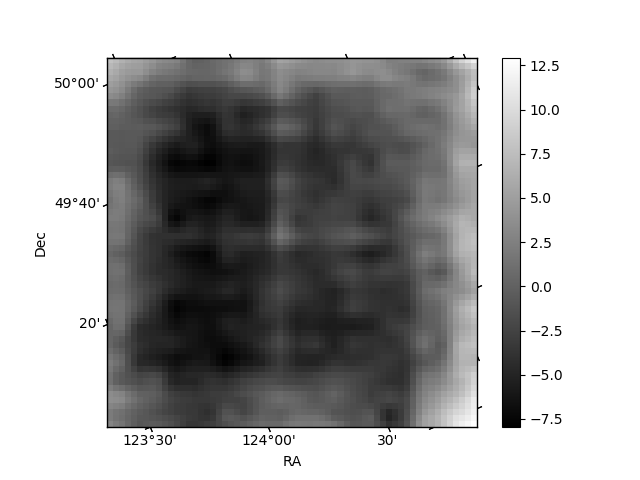
Quadrant C |
| Plot type | Count rate plots | Images |
|---|---|---|
| Comparison with Poisson distribution Blue bars denote a histogram of data divided into 1 sec bins. Red curve is a Poisson curve with rate = median count rate of data. |
 |
 |
| Quadrant-wise count rates Data is divided into 100 sec bins |
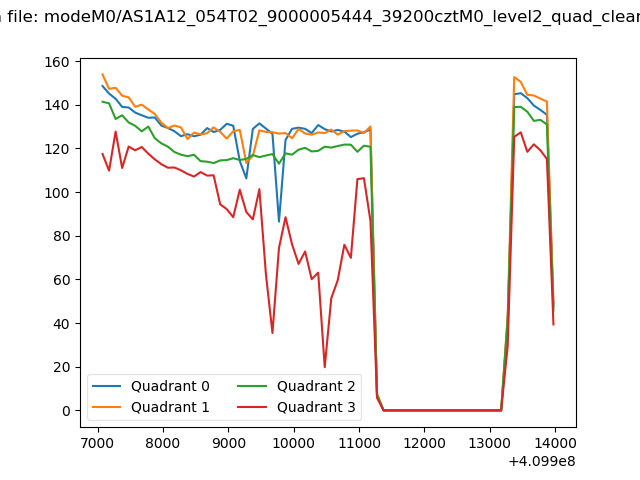 |
|
| Module-wise count rates for Quadrant A Data is divided into 100 sec bins |
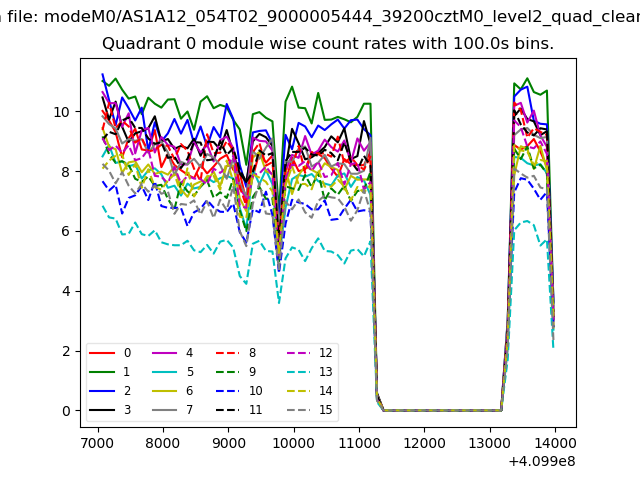 |
 |
| Module-wise count rates for Quadrant B Data is divided into 100 sec bins |
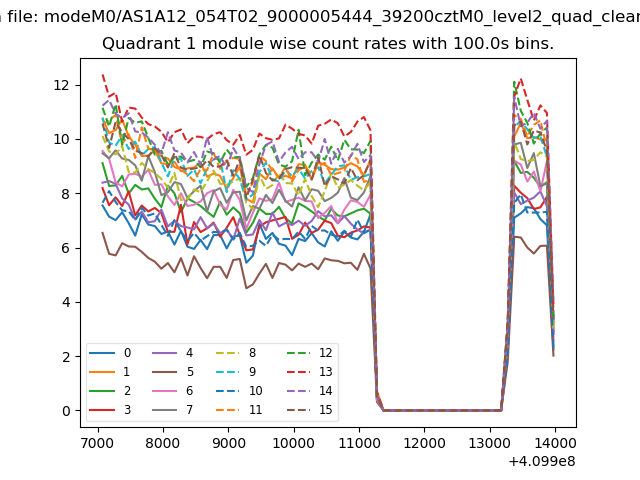 |
 |
| Module-wise count rates for Quadrant C Data is divided into 100 sec bins |
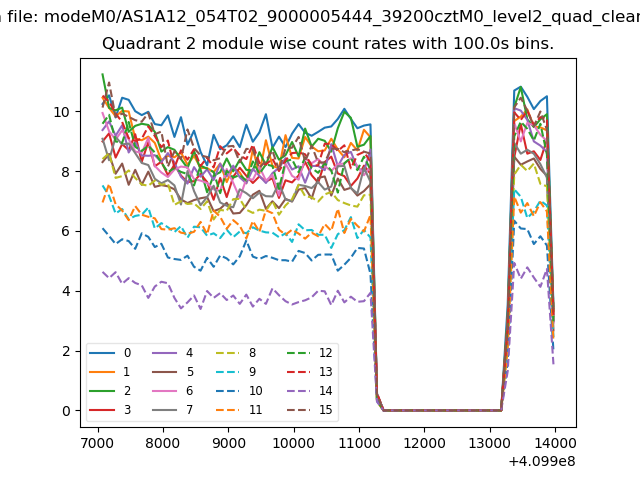 |
 |
| Module-wise count rates for Quadrant D Data is divided into 100 sec bins |
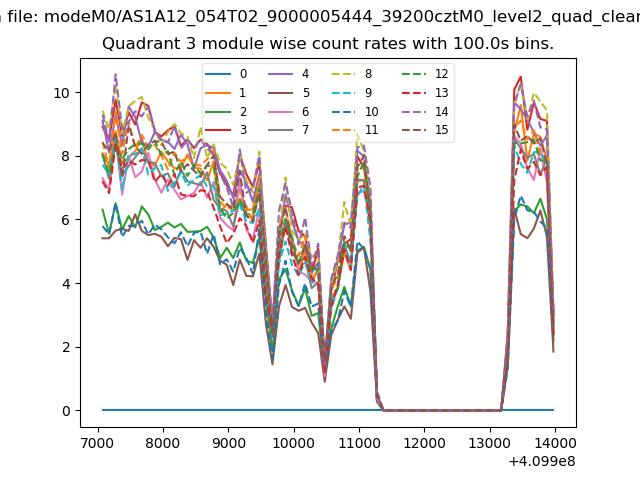 |
 |
| Parameter | Plot |
|---|---|
| CZT HV Monitor | 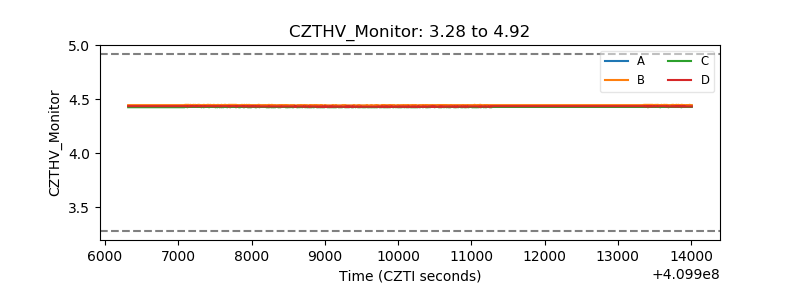 |
| D_VDD | 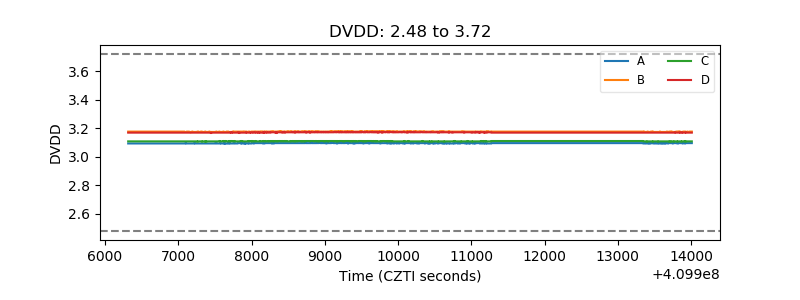 |
| Temperature 1 | 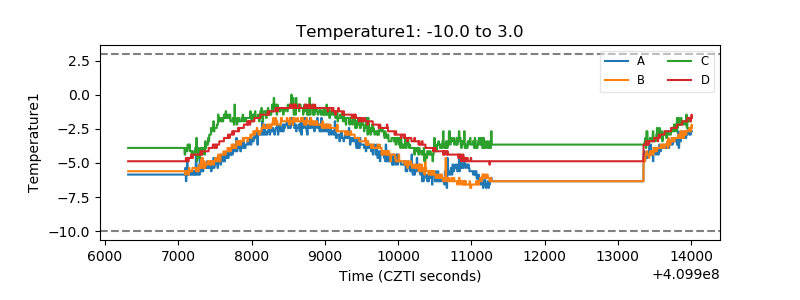 |
| Veto HV Monitor | 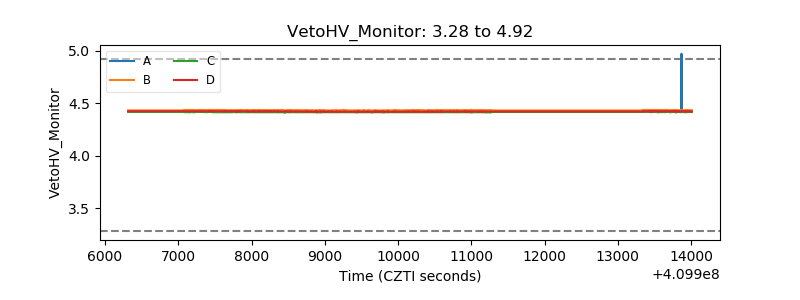 |
| Veto LLD | 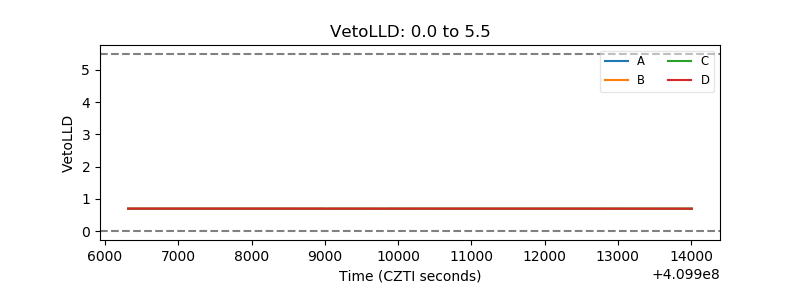 |
| Alpha Counter | 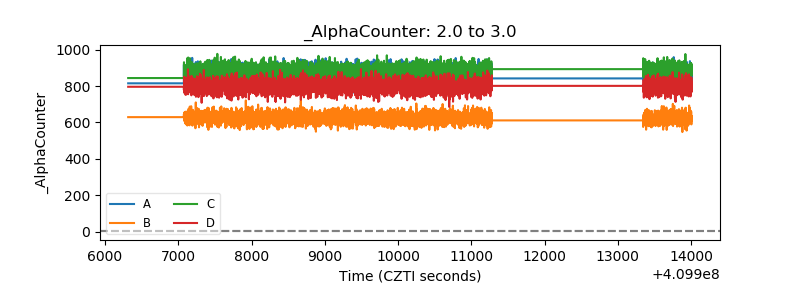 |
| _CPM_Rate | 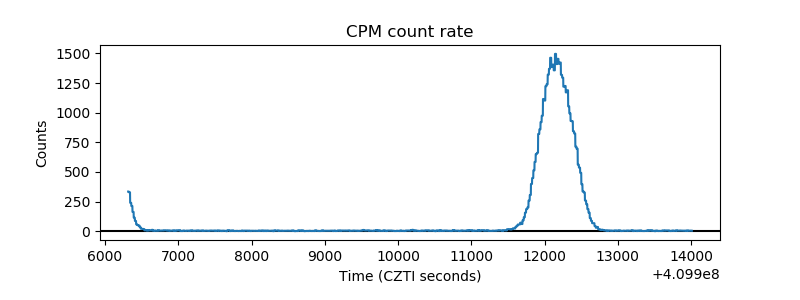 |
| CZT Counter | 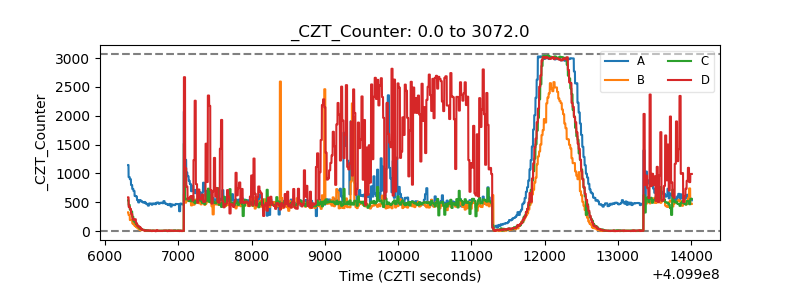 |
| +2.5 Volts monitor |  |
| +5 Volts monitor |  |
| _ROLL_ROT | 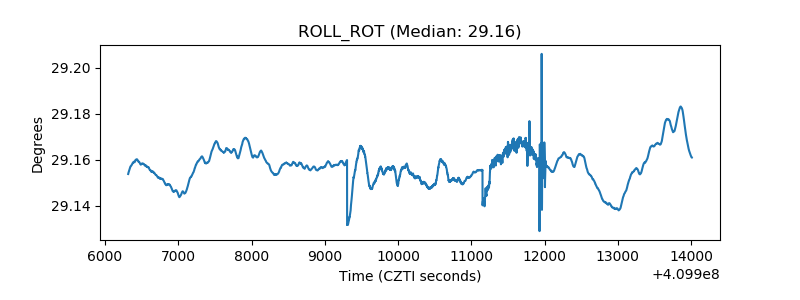 |
| _Roll_DEC |  |
| _Roll_RA | 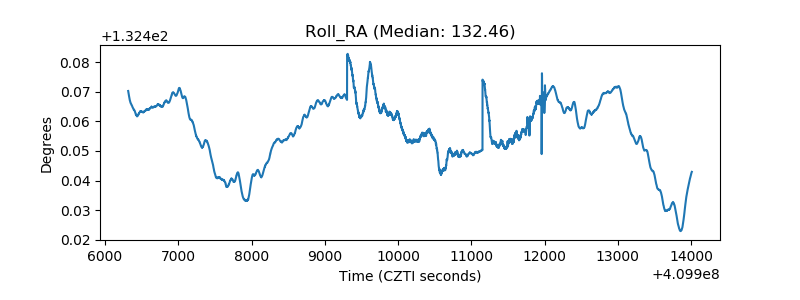 |
| Veto Counter | 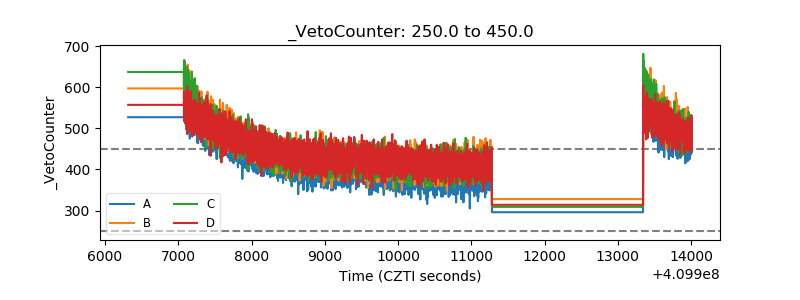 |