| Param | Original file | Final file |
|---|---|---|
| Filename | modeM0/AS1A12_054T02_9000005444_39201cztM0_level2.fits | modeM0/AS1A12_054T02_9000005444_39201cztM0_level2_quad_clean.evt |
| Size (bytes) | 355,714,560 | 69,664,320 |
| Size | 339.2 MB | 66.4 MB |
| Events in quadrant A | 2,304,958 | 521,739 |
| Events in quadrant B | 1,866,294 | 524,155 |
| Events in quadrant C | 1,932,991 | 483,383 |
| Events in quadrant D | 6,753,847 | 300,960 |
| Mode M9 | |||
|---|---|---|---|
| Quadrant | BADHDUFLAG | Total packets | Discarded packets |
| A | 0 | 10 | 0 |
| B | 0 | 10 | 0 |
| C | 0 | 10 | 0 |
| D | 0 | 11 | 0 |
| Mode M0 | |||
|---|---|---|---|
| Quadrant | BADHDUFLAG | Total packets | Discarded packets |
| A | 0 | 9149 | 1 |
| B | 0 | 8074 | 1 |
| C | 0 | 7991 | 1 |
| D | 0 | 22801 | 1 |
| Mode SS | |||
|---|---|---|---|
| Quadrant | BADHDUFLAG | Total packets | Discarded packets |
| A | 0 | 78 | 0 |
| B | 0 | 78 | 0 |
| C | 0 | 78 | 0 |
| D | 0 | 78 | 0 |
| Quadrant | Total seconds | Saturated seconds | Saturation percentage |
|---|---|---|---|
| A | 3964 | 32 | 0.807265% |
| B | 3964 | 4 | 0.100908% |
| C | 3964 | 1 | 0.025227% |
| D | 3964 | 1641 | 41.397578% |
Noise dominated data is calculated using 1-second bins in cleaned event files. If a bin has >2000 counts, and if more than 50% of those come from <1% of pixels, then it is considered to be noise-dominated and hence unusable.
| Quadrant | # 1 sec bins | Bins with >0 counts | Bins with >2000 counts | High rate bins dominated by noise | Noise dominated (total time) | Noise dominated (detector-on time) | Marked lightcurve |
|---|---|---|---|---|---|---|---|
| A | 3964 | 3964 | 26 | 26 | 0.66% | 0.66% | 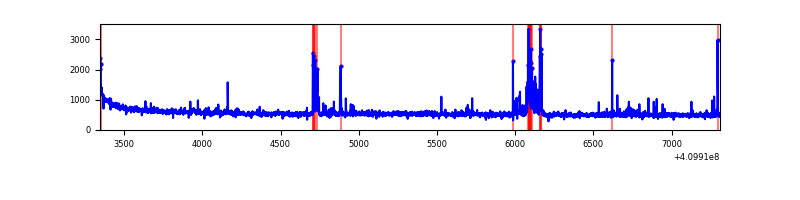 |
| B | 3964 | 3964 | 3 | 3 | 0.08% | 0.08% | 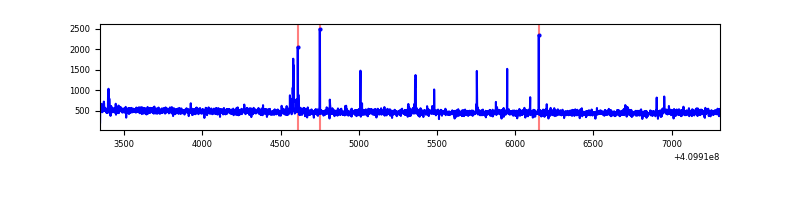 |
| C | 3964 | 3964 | 0 | 0 | 0.00% | 0.00% | 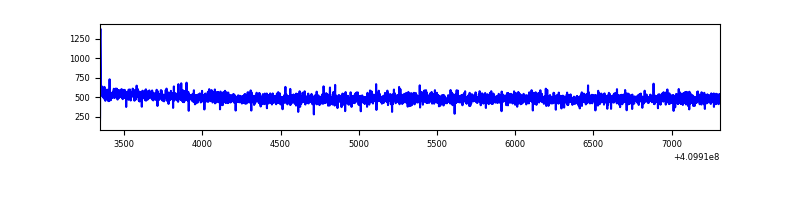 |
| D | 3964 | 3964 | 1375 | 1375 | 34.69% | 34.69% | 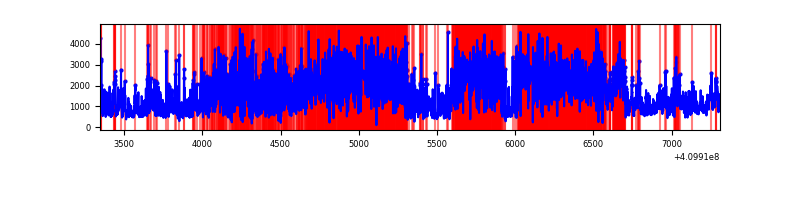 |
Top three noisy pixels from each quadrant. If the there are fewer than three noisy pixels in the level2.evt file, extra rows are filled as -1
| Pixel properties | Quadrant properties | ||||||
|---|---|---|---|---|---|---|---|
| Quadrant | DetID | PixID | Counts | Sigma | Mean | Median | Sigma |
| A | 10 | 83 | 291166 | 3047.44 | 473 | 465 | 95.4 |
| A | 13 | 248 | 141452 | 1477.98 | 473 | 465 | 95.4 |
| A | 9 | 143 | 27905 | 287.66 | 473 | 465 | 95.4 |
| B | 5 | 172 | 35565 | 394.3 | 464 | 454 | 89.0 |
| B | 12 | 111 | 10345 | 111.08 | 464 | 454 | 89.0 |
| B | 11 | 111 | 9523 | 101.85 | 464 | 454 | 89.0 |
| C | 15 | 214 | 162993 | 1564.37 | 451 | 454 | 103.9 |
| C | 3 | 233 | 3842 | 32.61 | 451 | 454 | 103.9 |
| C | 0 | 10 | 3287 | 27.27 | 451 | 454 | 103.9 |
| D | 12 | 235 | 4774225 | 50152.42 | 388 | 377 | 95.2 |
| D | 2 | 249 | 360799 | 3786.47 | 388 | 377 | 95.2 |
| D | 13 | 171 | 34896 | 362.64 | 388 | 377 | 95.2 |
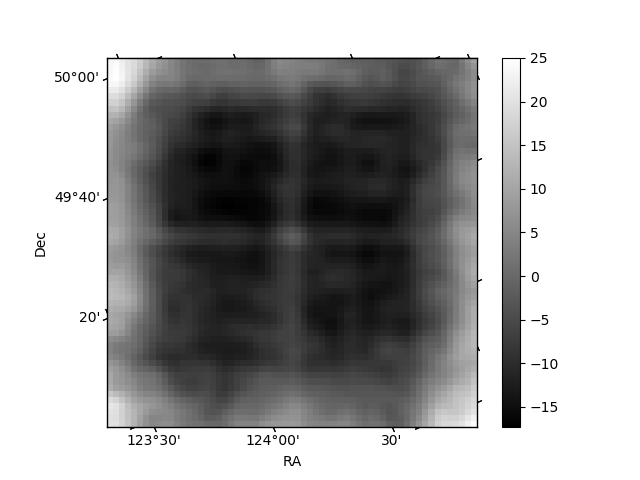
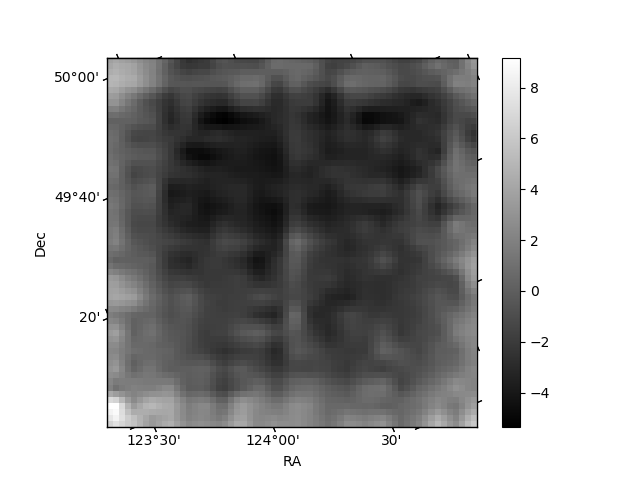
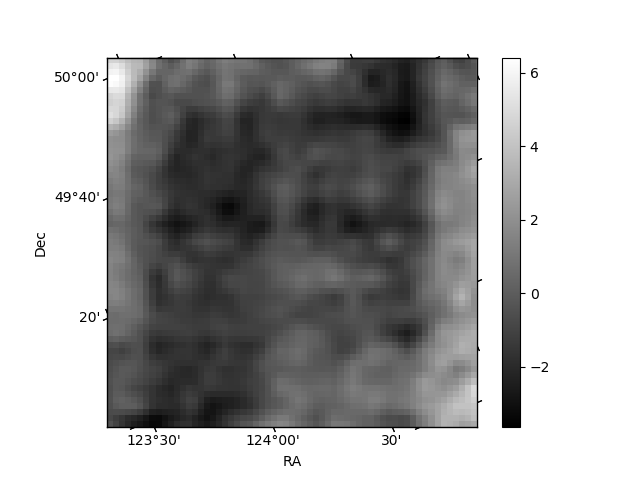
Histogram calculated using DETX and DETY for each event in the final _common_clean file
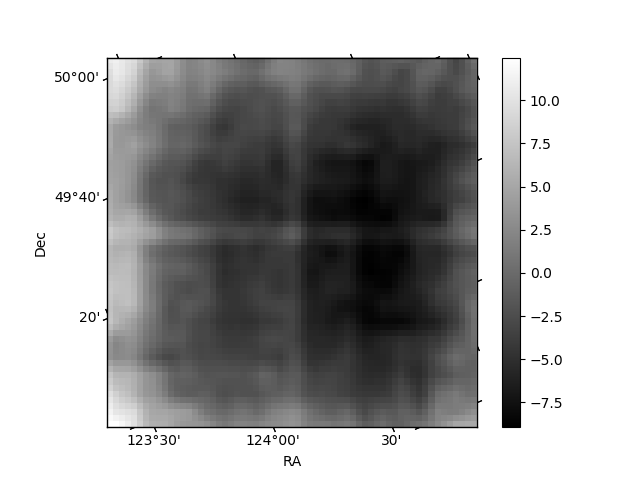
| Quadrant A | 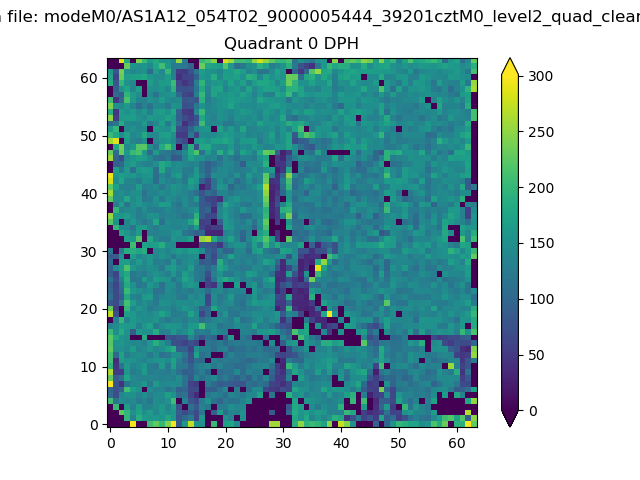 |
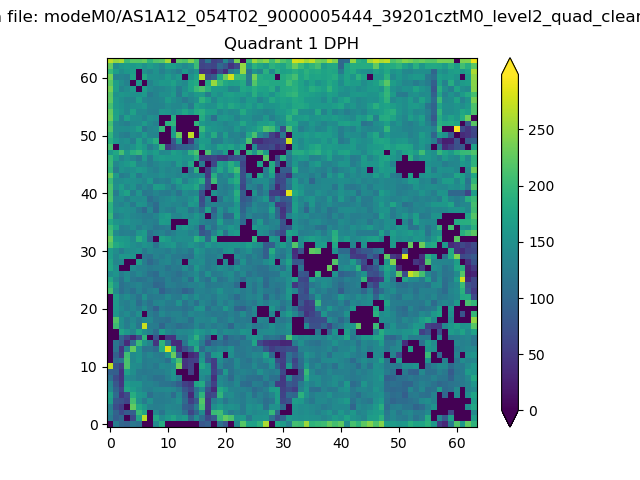 |
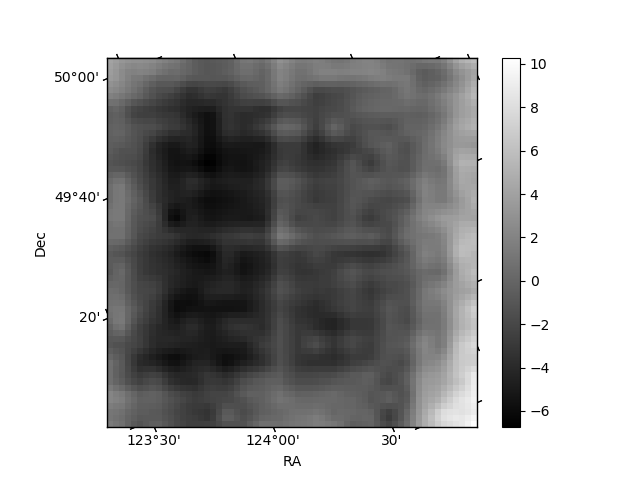
Quadrant B |
|---|---|---|---|
| Quadrant D | 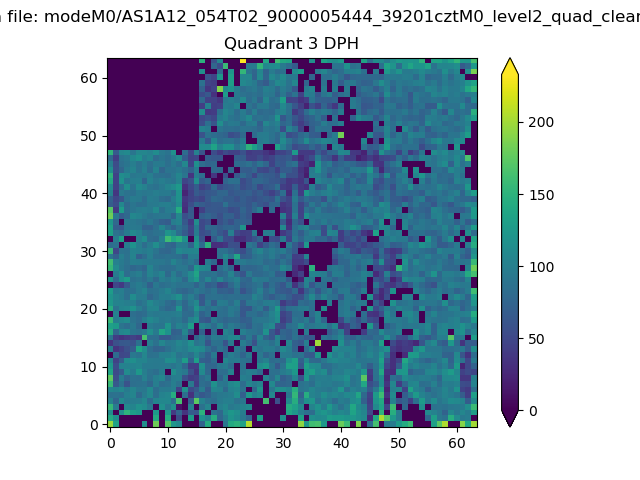 |
 |
Quadrant C |
| Plot type | Count rate plots | Images |
|---|---|---|
| Comparison with Poisson distribution Blue bars denote a histogram of data divided into 1 sec bins. Red curve is a Poisson curve with rate = median count rate of data. |
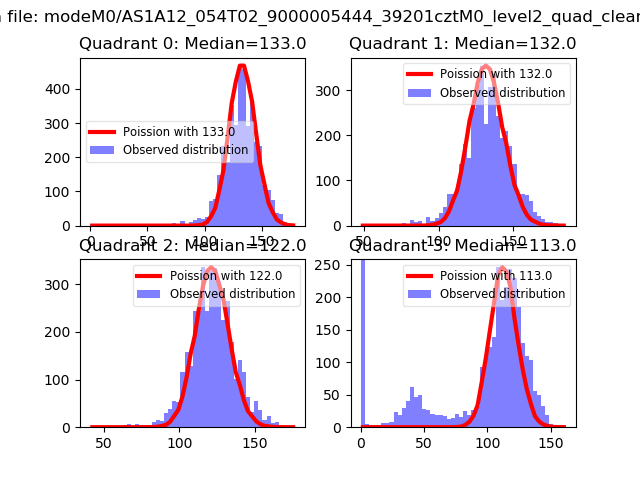 |
 |
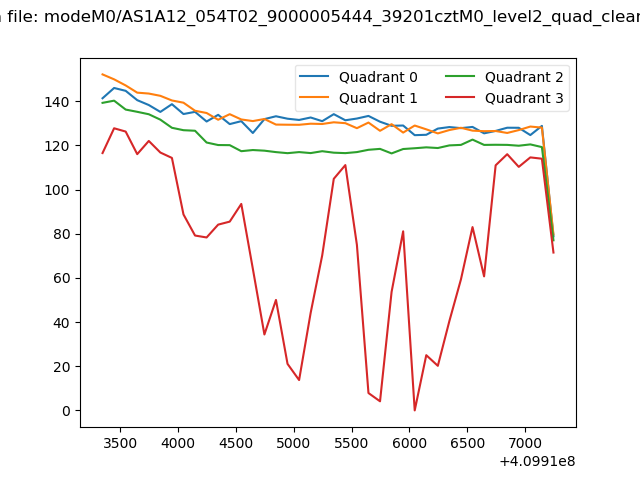
| Quadrant-wise count rates Data is divided into 100 sec bins |
 |
|
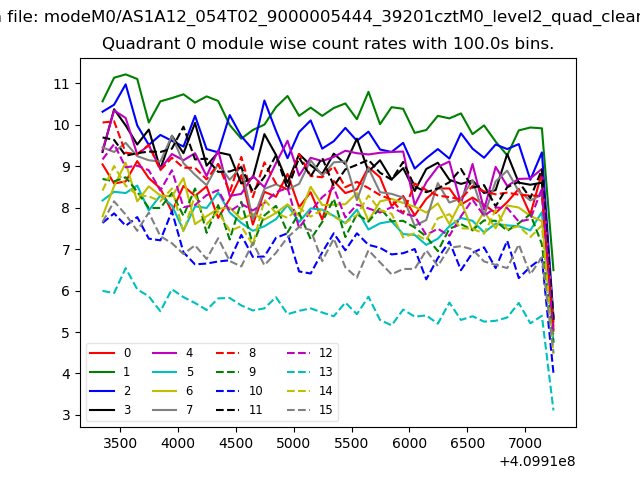
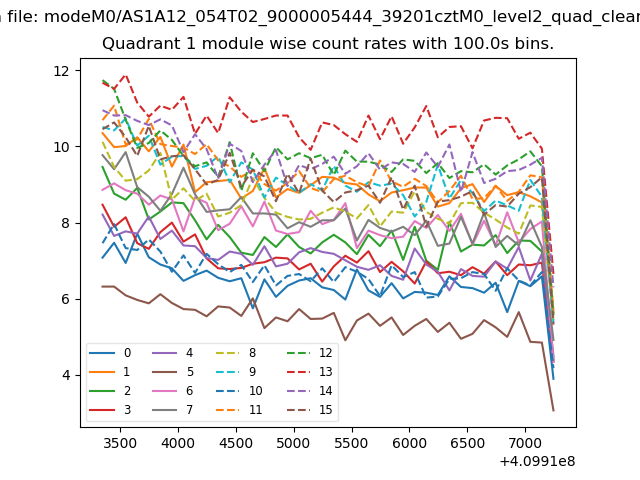
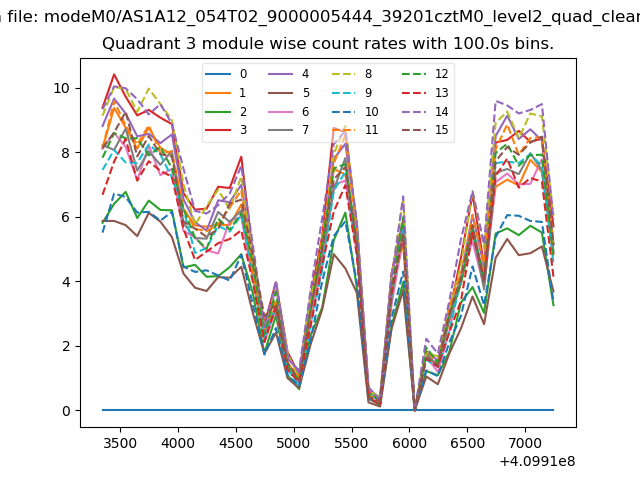
| Module-wise count rates for Quadrant A Data is divided into 100 sec bins |
 |
 |
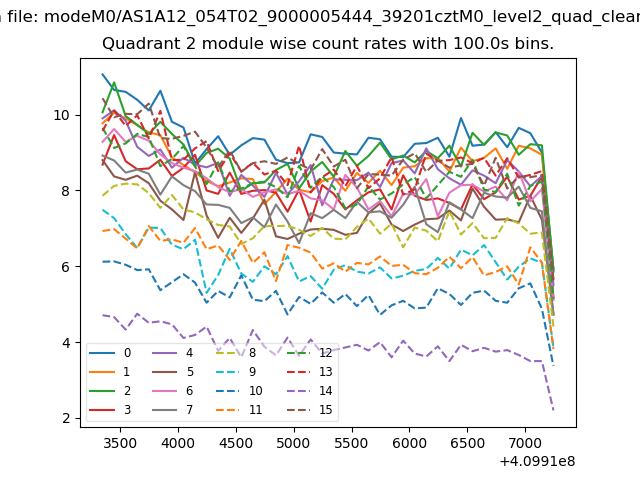
| Module-wise count rates for Quadrant B Data is divided into 100 sec bins |
 |
 |
| Module-wise count rates for Quadrant C Data is divided into 100 sec bins |
 |
 |
| Module-wise count rates for Quadrant D Data is divided into 100 sec bins |
 |
 |
| Parameter | Plot |
|---|---|
| CZT HV Monitor | 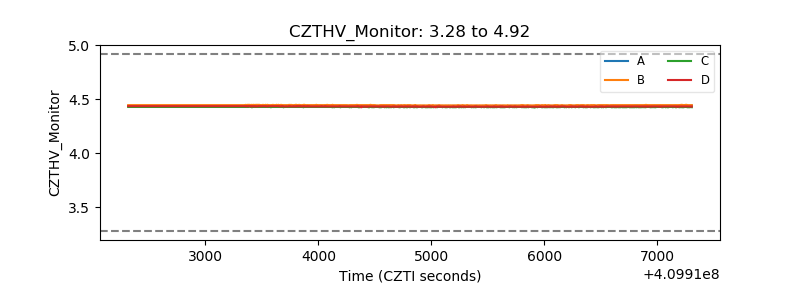 |
| D_VDD | 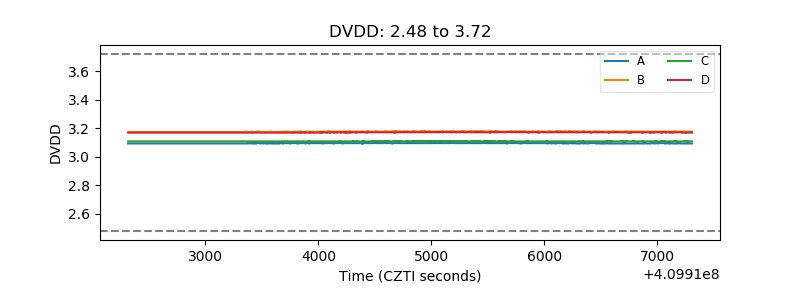 |
| Temperature 1 | 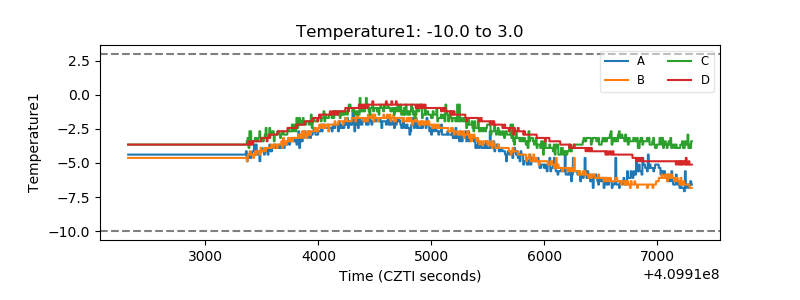 |
| Veto HV Monitor |  |
| Veto LLD | 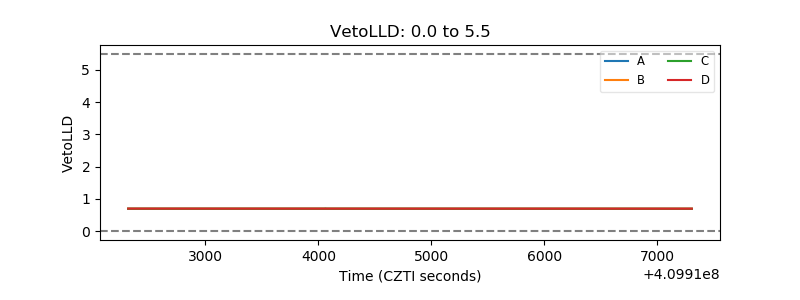 |
| Alpha Counter | 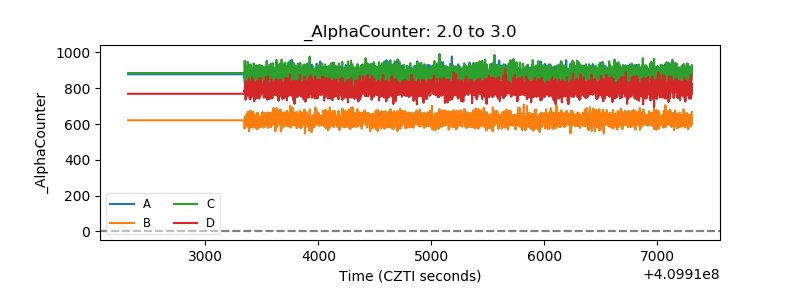 |
| _CPM_Rate | 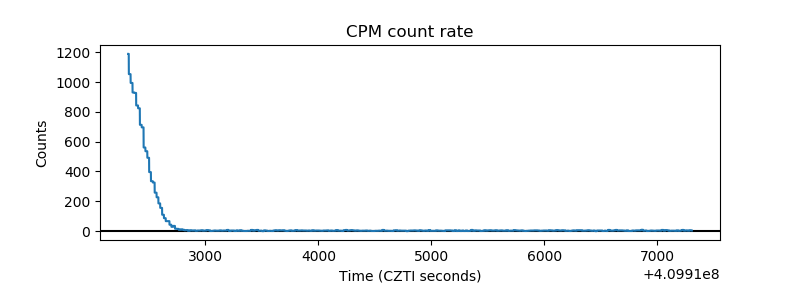 |
| CZT Counter | 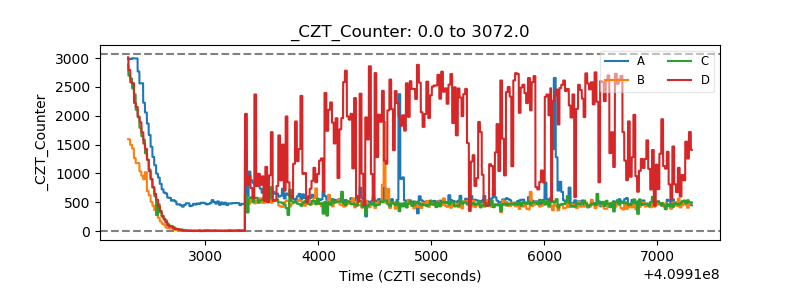 |
| +2.5 Volts monitor |  |
| +5 Volts monitor | 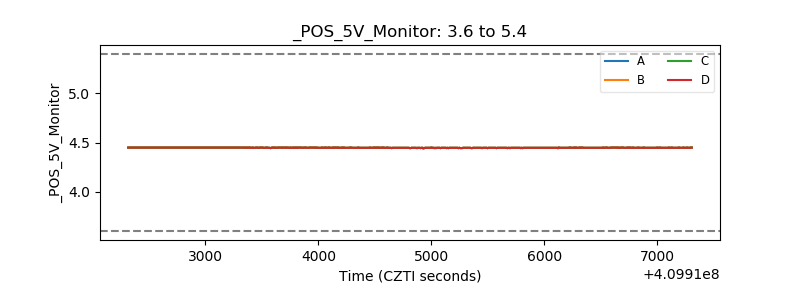 |
| _ROLL_ROT | 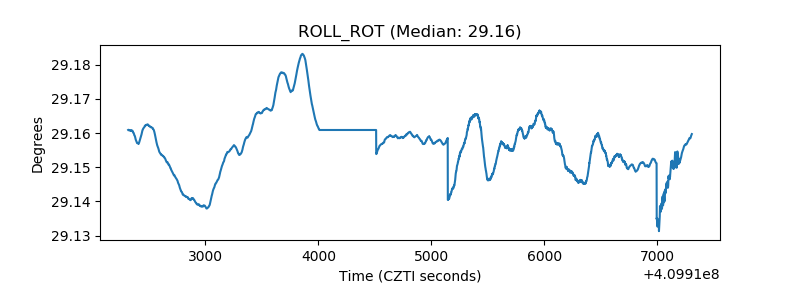 |
| _Roll_DEC | 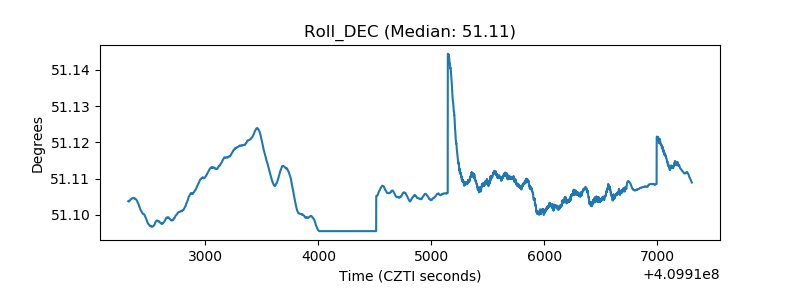 |
| _Roll_RA | 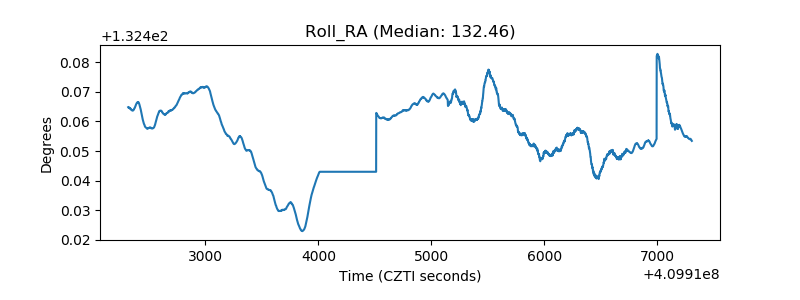 |
| Veto Counter | 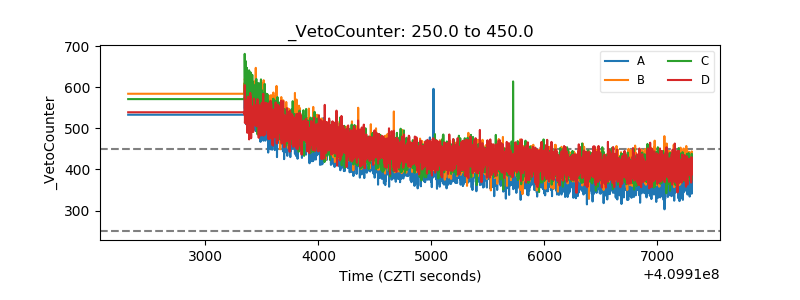 |