| Param | Original file | Final file |
|---|---|---|
| Filename | modeM0/AS1A12_054T04_9000005446_39201cztM0_level2.fits | modeM0/AS1A12_054T04_9000005446_39201cztM0_level2_quad_clean.evt |
| Size (bytes) | 74,943,360 | 18,213,120 |
| Size | 71.5 MB | 17.4 MB |
| Events in quadrant A | 613,930 | 127,594 |
| Events in quadrant B | 503,421 | 131,572 |
| Events in quadrant C | 502,710 | 120,289 |
| Events in quadrant D | 1,074,637 | 96,906 |
| Mode M9 | |||
|---|---|---|---|
| Quadrant | BADHDUFLAG | Total packets | Discarded packets |
| A | 0 | 20 | 0 |
| B | 0 | 20 | 0 |
| C | 0 | 20 | 0 |
| D | 0 | 20 | 0 |
| Mode M0 | |||
|---|---|---|---|
| Quadrant | BADHDUFLAG | Total packets | Discarded packets |
| A | 0 | 2441 | 2 |
| B | 0 | 2100 | 1 |
| C | 0 | 2028 | 1 |
| D | 0 | 3882 | 1 |
| Mode SS | |||
|---|---|---|---|
| Quadrant | BADHDUFLAG | Total packets | Discarded packets |
| A | 0 | 18 | 0 |
| B | 0 | 18 | 0 |
| C | 0 | 18 | 0 |
| D | 0 | 18 | 0 |
| Quadrant | Total seconds | Saturated seconds | Saturation percentage |
|---|---|---|---|
| A | 983 | 5 | 0.508647% |
| B | 983 | 3 | 0.305188% |
| C | 983 | 4 | 0.406918% |
| D | 983 | 165 | 16.785351% |
Noise dominated data is calculated using 1-second bins in cleaned event files. If a bin has >2000 counts, and if more than 50% of those come from <1% of pixels, then it is considered to be noise-dominated and hence unusable.
| Quadrant | # 1 sec bins | Bins with >0 counts | Bins with >2000 counts | High rate bins dominated by noise | Noise dominated (total time) | Noise dominated (detector-on time) | Marked lightcurve |
|---|---|---|---|---|---|---|---|
| A | 983 | 983 | 1 | 1 | 0.10% | 0.10% | 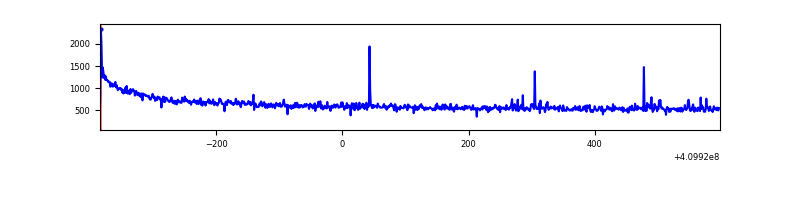 |
| B | 983 | 983 | 1 | 1 | 0.10% | 0.10% | 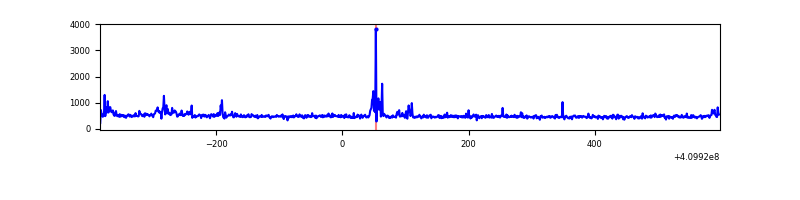 |
| C | 983 | 983 | 2 | 2 | 0.20% | 0.20% | 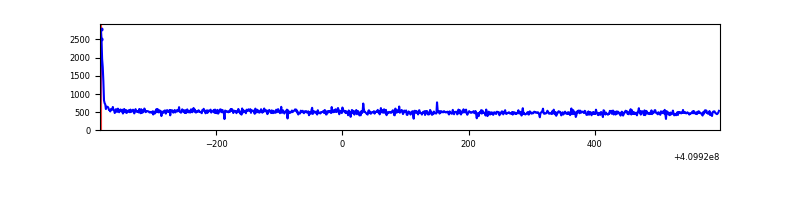 |
| D | 983 | 983 | 127 | 127 | 12.92% | 12.92% | 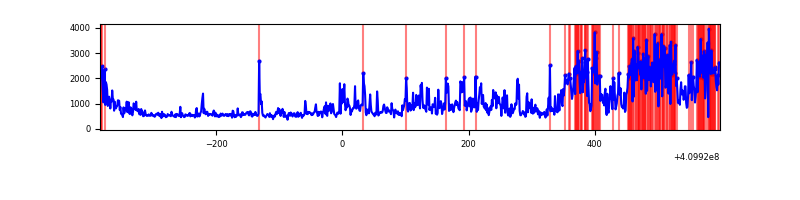 |
Top three noisy pixels from each quadrant. If the there are fewer than three noisy pixels in the level2.evt file, extra rows are filled as -1
| Pixel properties | Quadrant properties | ||||||
|---|---|---|---|---|---|---|---|
| Quadrant | DetID | PixID | Counts | Sigma | Mean | Median | Sigma |
| A | 10 | 83 | 133731 | 5055.48 | 121 | 118 | 26.4 |
| A | 9 | 143 | 5716 | 211.81 | 121 | 118 | 26.4 |
| A | 13 | 248 | 3977 | 146.01 | 121 | 118 | 26.4 |
| B | 5 | 172 | 21971 | 868.64 | 119 | 116 | 25.2 |
| B | 5 | 184 | 15516 | 612.08 | 119 | 116 | 25.2 |
| B | 12 | 111 | 2660 | 101.11 | 119 | 116 | 25.2 |
| C | 15 | 214 | 45498 | 1630.9 | 113 | 114 | 27.8 |
| C | 0 | 10 | 10235 | 363.7 | 113 | 114 | 27.8 |
| C | 1 | 241 | 1970 | 66.7 | 113 | 114 | 27.8 |
| D | 12 | 235 | 338263 | 12064.38 | 108 | 104 | 28.0 |
| D | 2 | 249 | 275327 | 9819.03 | 108 | 104 | 28.0 |
| D | 5 | 171 | 7388 | 259.87 | 108 | 104 | 28.0 |
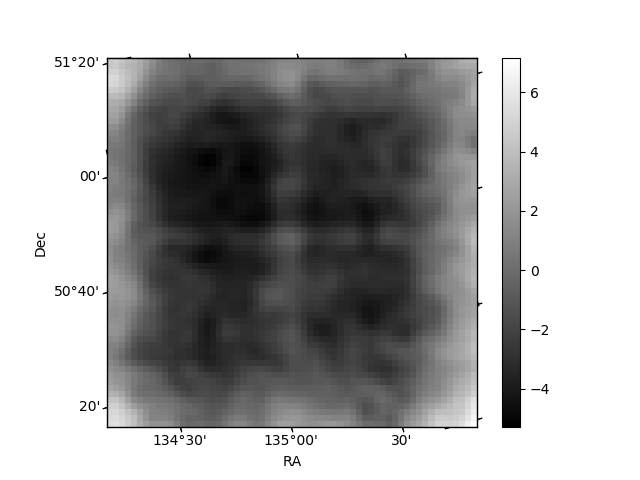
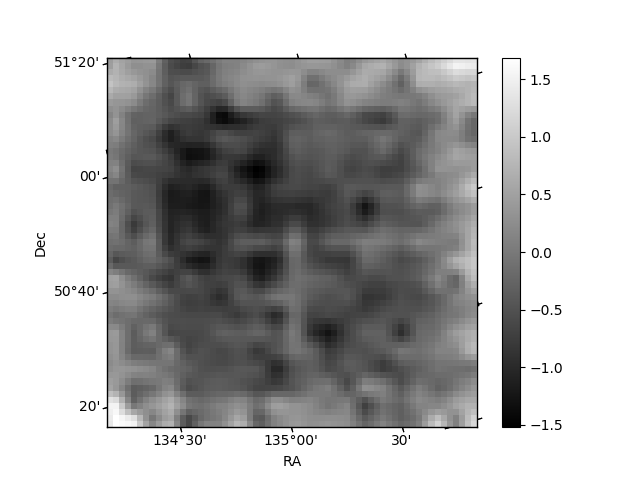
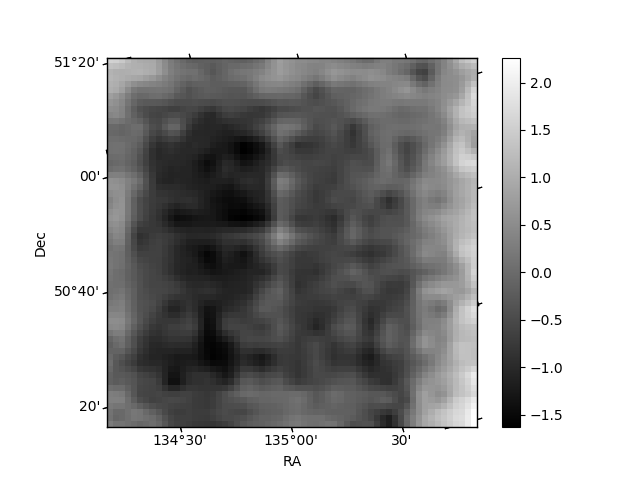
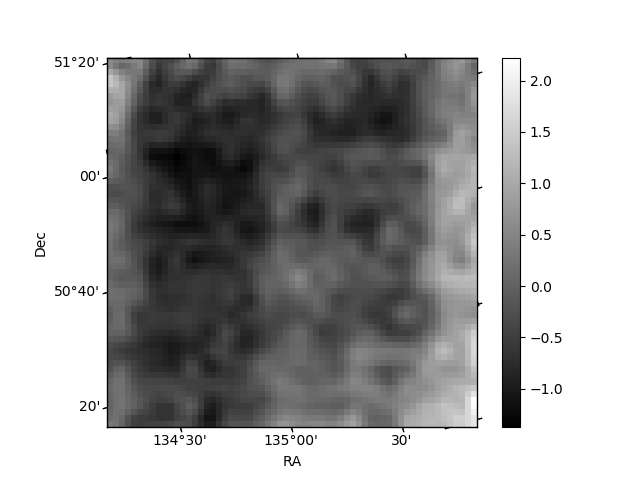
Histogram calculated using DETX and DETY for each event in the final _common_clean file
| Quadrant A | 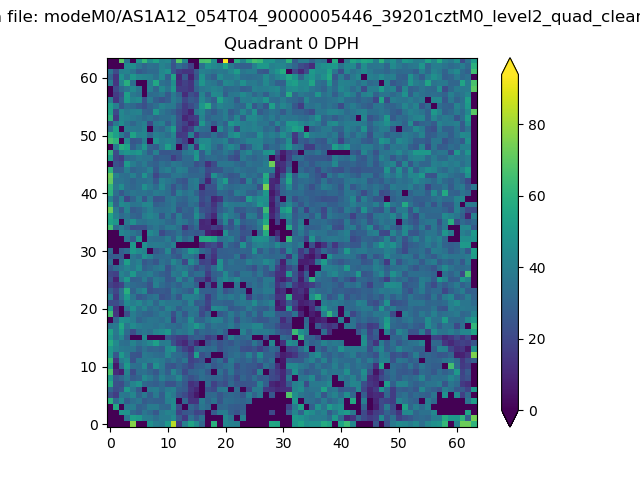 |
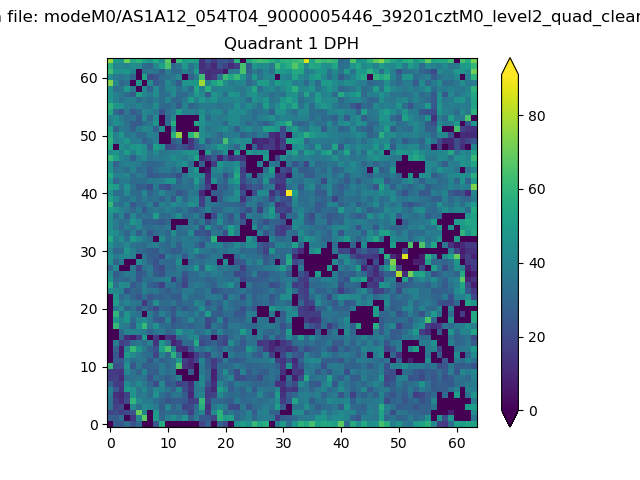 |
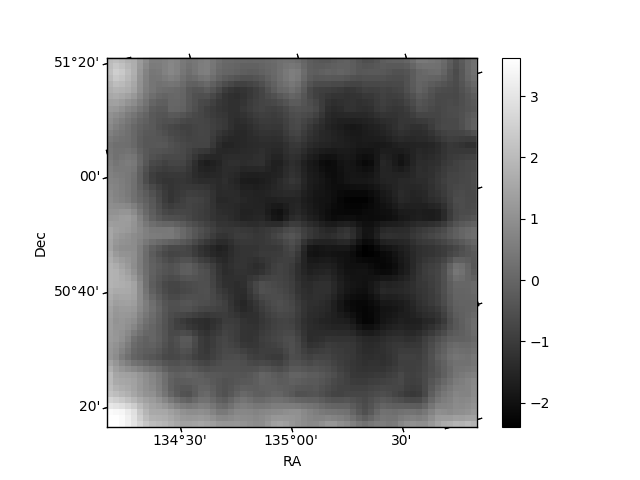
Quadrant B |
|---|---|---|---|
| Quadrant D | 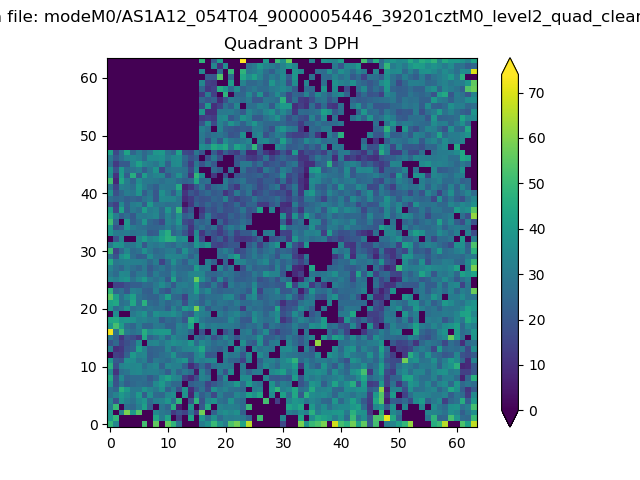 |
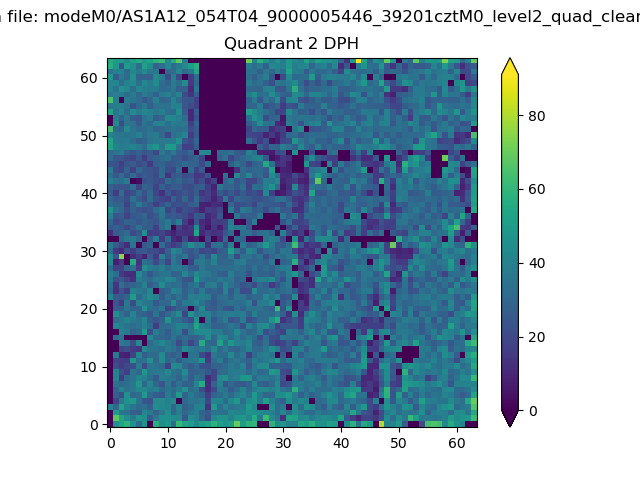 |
Quadrant C |
| Plot type | Count rate plots | Images |
|---|---|---|
| Comparison with Poisson distribution Blue bars denote a histogram of data divided into 1 sec bins. Red curve is a Poisson curve with rate = median count rate of data. |
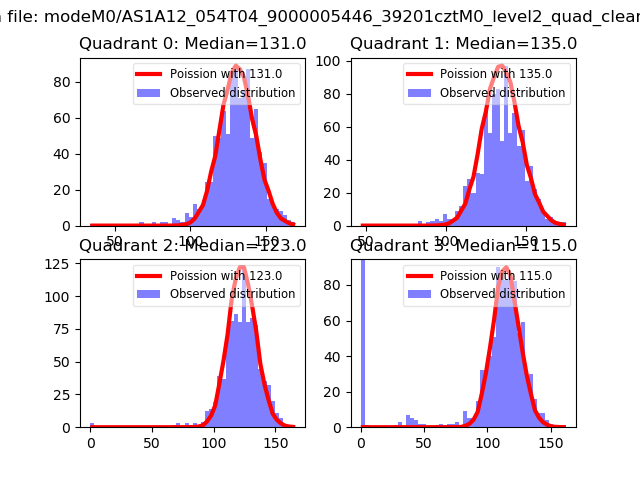 |
 |
| Quadrant-wise count rates Data is divided into 100 sec bins |
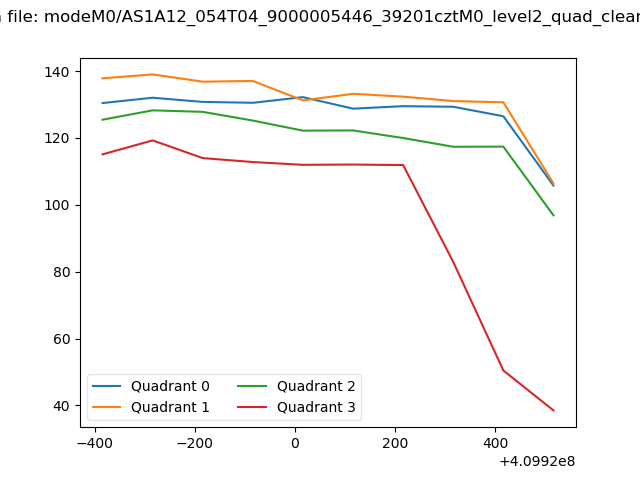 |
|
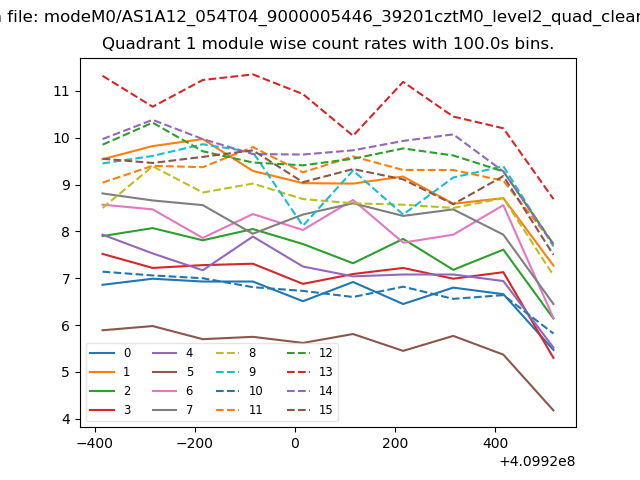
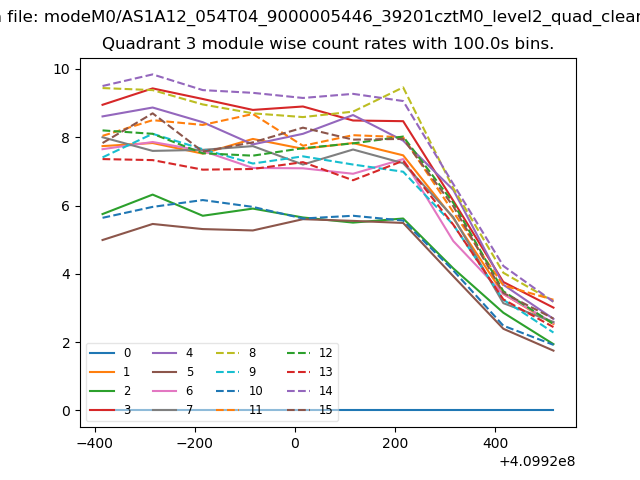
| Module-wise count rates for Quadrant A Data is divided into 100 sec bins |
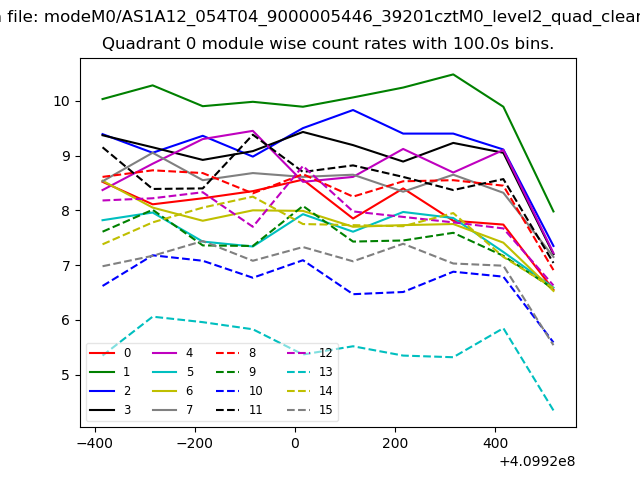 |
 |
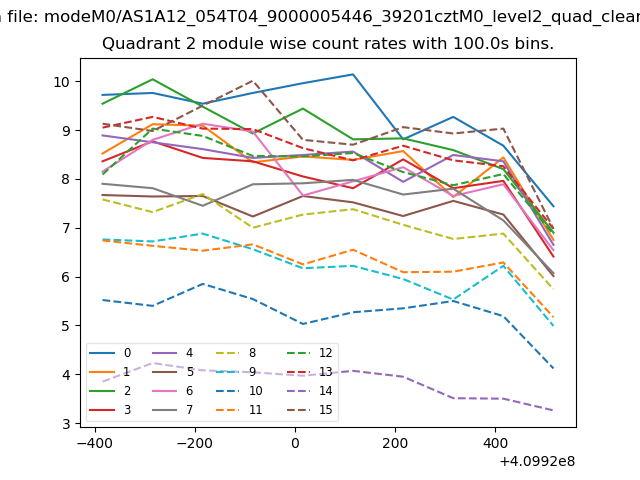
| Module-wise count rates for Quadrant B Data is divided into 100 sec bins |
 |
 |
| Module-wise count rates for Quadrant C Data is divided into 100 sec bins |
 |
 |
| Module-wise count rates for Quadrant D Data is divided into 100 sec bins |
 |
 |
| Parameter | Plot |
|---|---|
| CZT HV Monitor | 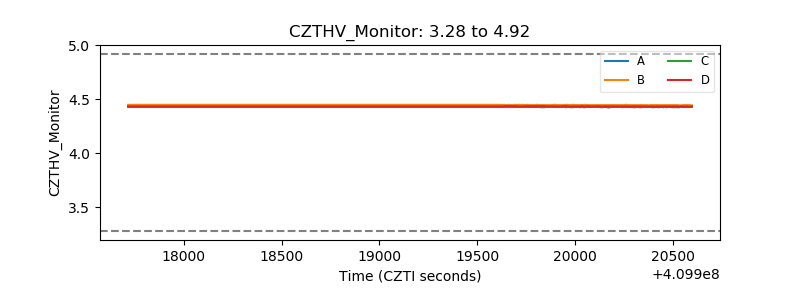 |
| D_VDD | 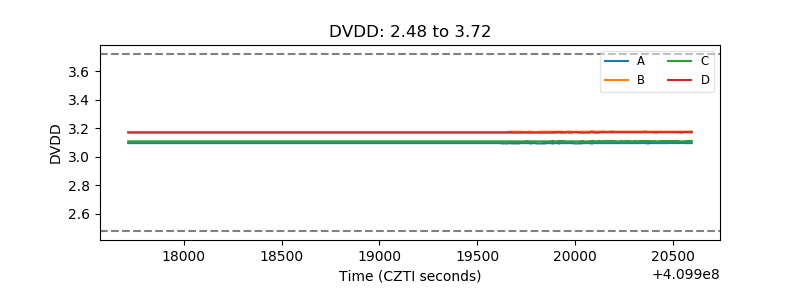 |
| Temperature 1 | 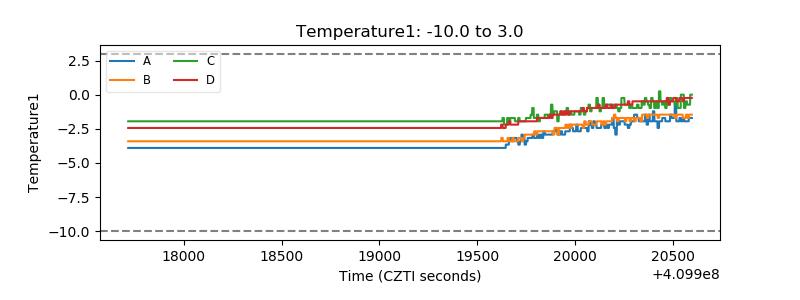 |
| Veto HV Monitor | 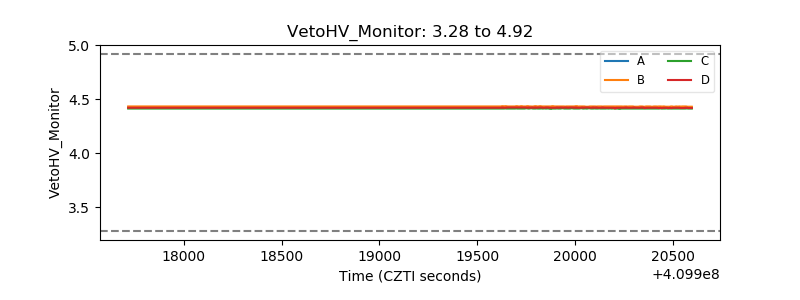 |
| Veto LLD | 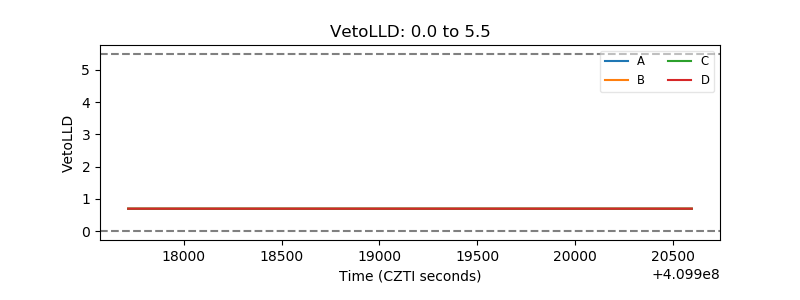 |
| Alpha Counter | 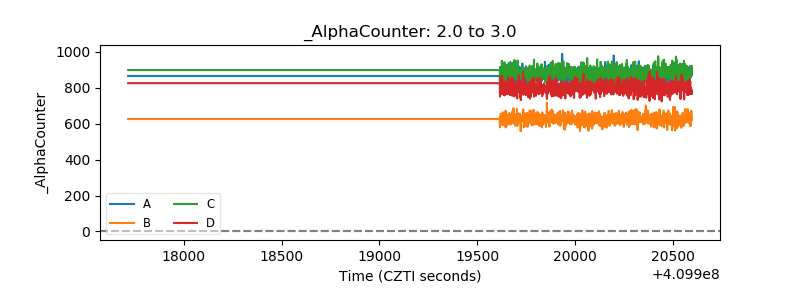 |
| _CPM_Rate | 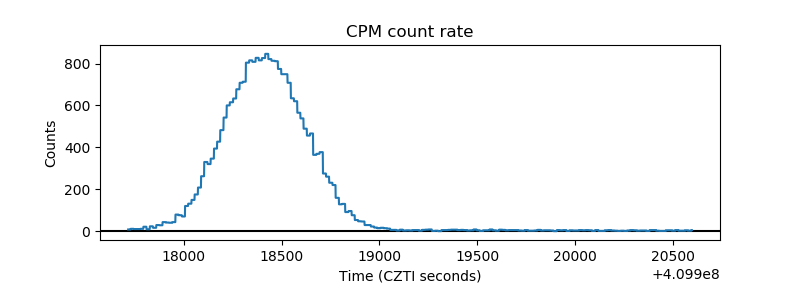 |
| CZT Counter | 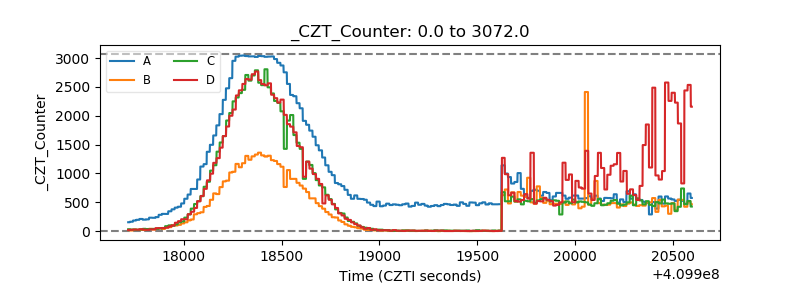 |
| +2.5 Volts monitor | 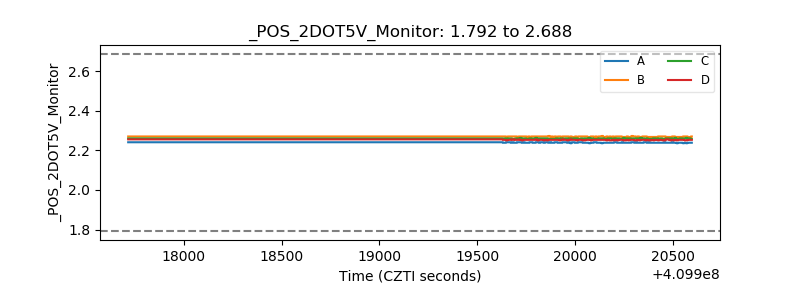 |
| +5 Volts monitor |  |
| _ROLL_ROT | 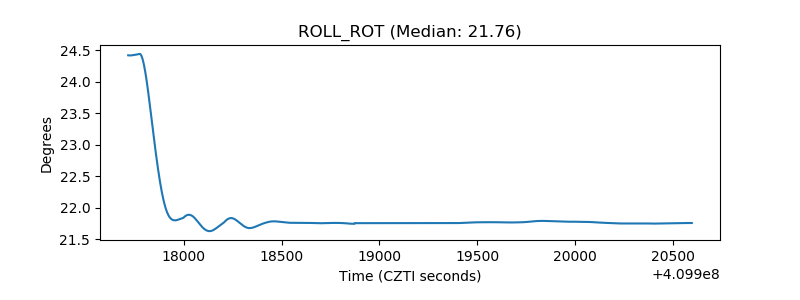 |
| _Roll_DEC | 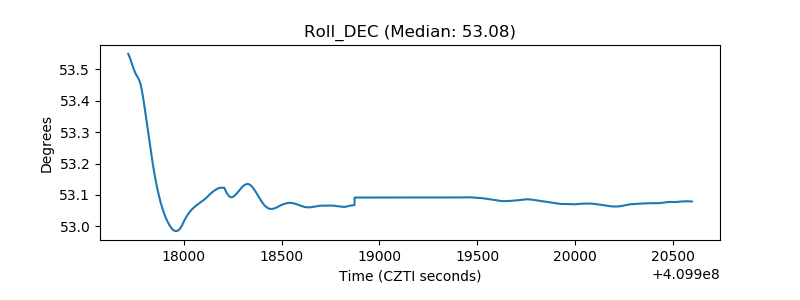 |
| _Roll_RA | 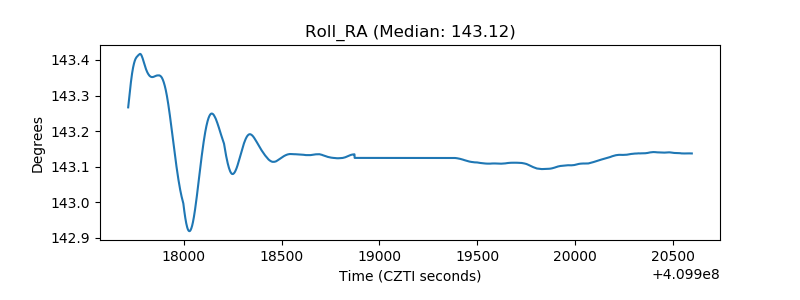 |
| Veto Counter | 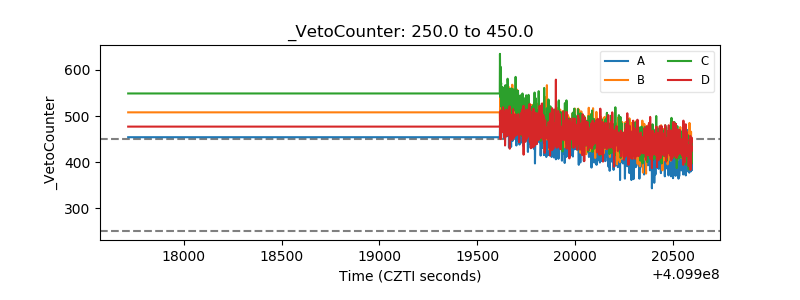 |