| Param | Original file | Final file |
|---|---|---|
| Filename | modeM0/AS1A12_054T04_9000005446_39202cztM0_level2.fits | modeM0/AS1A12_054T04_9000005446_39202cztM0_level2_quad_clean.evt |
| Size (bytes) | 503,280,000 | 83,185,920 |
| Size | 480.0 MB | 79.3 MB |
| Events in quadrant A | 2,943,973 | 643,199 |
| Events in quadrant B | 2,652,502 | 642,980 |
| Events in quadrant C | 2,477,729 | 599,224 |
| Events in quadrant D | 10,154,721 | 272,830 |
| Mode M9 | |||
|---|---|---|---|
| Quadrant | BADHDUFLAG | Total packets | Discarded packets |
| A | 0 | 23 | 0 |
| B | 0 | 23 | 0 |
| C | 0 | 23 | 0 |
| D | 0 | 24 | 0 |
| Mode M0 | |||
|---|---|---|---|
| Quadrant | BADHDUFLAG | Total packets | Discarded packets |
| A | 0 | 11739 | 3 |
| B | 0 | 11306 | 2 |
| C | 0 | 10405 | 2 |
| D | 0 | 33721 | 2 |
| Mode SS | |||
|---|---|---|---|
| Quadrant | BADHDUFLAG | Total packets | Discarded packets |
| A | 0 | 104 | 0 |
| B | 0 | 104 | 0 |
| C | 0 | 104 | 0 |
| D | 0 | 104 | 0 |
| Quadrant | Total seconds | Saturated seconds | Saturation percentage |
|---|---|---|---|
| A | 5150 | 34 | 0.660194% |
| B | 5150 | 72 | 1.398058% |
| C | 5150 | 6 | 0.116505% |
| D | 5150 | 3015 | 58.543689% |
Noise dominated data is calculated using 1-second bins in cleaned event files. If a bin has >2000 counts, and if more than 50% of those come from <1% of pixels, then it is considered to be noise-dominated and hence unusable.
| Quadrant | # 1 sec bins | Bins with >0 counts | Bins with >2000 counts | High rate bins dominated by noise | Noise dominated (total time) | Noise dominated (detector-on time) | Marked lightcurve |
|---|---|---|---|---|---|---|---|
| A | 7273 | 5151 | 22 | 22 | 0.30% | 0.43% | 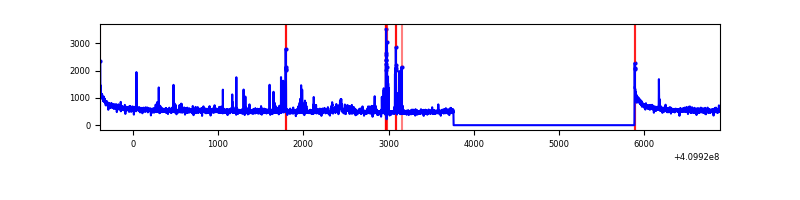 |
| B | 7273 | 5151 | 46 | 46 | 0.63% | 0.89% | 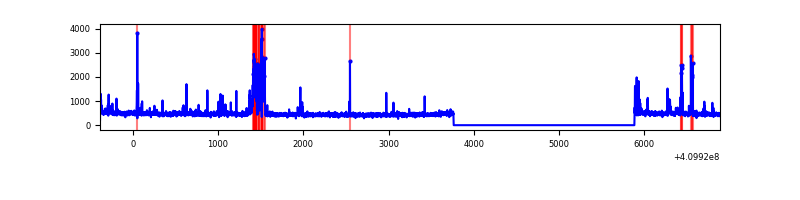 |
| C | 7273 | 5151 | 2 | 2 | 0.03% | 0.04% | 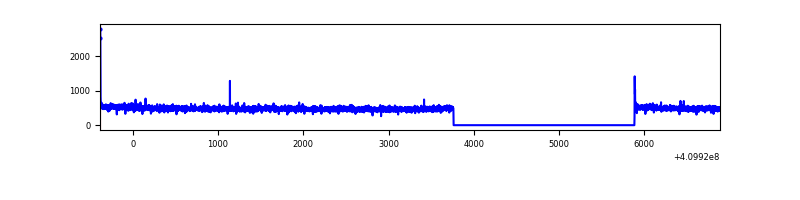 |
| D | 7272 | 5150 | 2538 | 2538 | 34.90% | 49.28% | 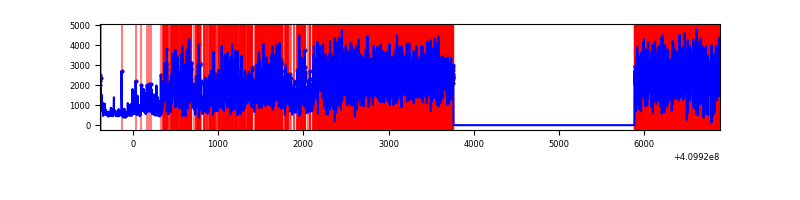 |
Top three noisy pixels from each quadrant. If the there are fewer than three noisy pixels in the level2.evt file, extra rows are filled as -1
| Pixel properties | Quadrant properties | ||||||
|---|---|---|---|---|---|---|---|
| Quadrant | DetID | PixID | Counts | Sigma | Mean | Median | Sigma |
| A | 10 | 83 | 437683 | 3604.67 | 596 | 586 | 121.3 |
| A | 9 | 143 | 148465 | 1219.53 | 596 | 586 | 121.3 |
| A | 13 | 248 | 48906 | 398.49 | 596 | 586 | 121.3 |
| B | 5 | 172 | 252238 | 2254.36 | 586 | 571 | 111.6 |
| B | 5 | 184 | 83700 | 744.64 | 586 | 571 | 111.6 |
| B | 12 | 111 | 13233 | 113.42 | 586 | 571 | 111.6 |
| C | 15 | 214 | 218845 | 1650.32 | 572 | 575 | 132.3 |
| C | 0 | 10 | 15998 | 116.61 | 572 | 575 | 132.3 |
| C | 13 | 61 | 3842 | 24.7 | 572 | 575 | 132.3 |
| D | 12 | 235 | 7120836 | 65722.34 | 441 | 429 | 108.3 |
| D | 2 | 249 | 1033237 | 9532.96 | 441 | 429 | 108.3 |
| D | 13 | 171 | 44827 | 409.8 | 441 | 429 | 108.3 |
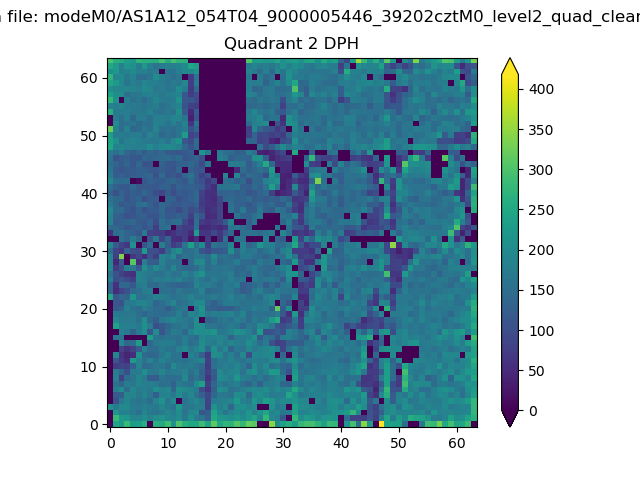
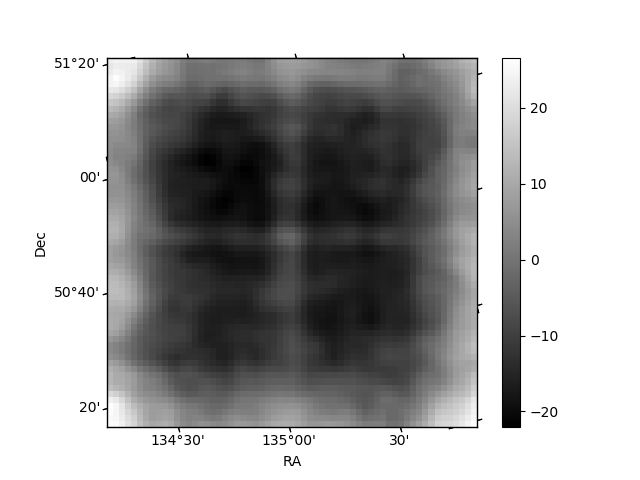
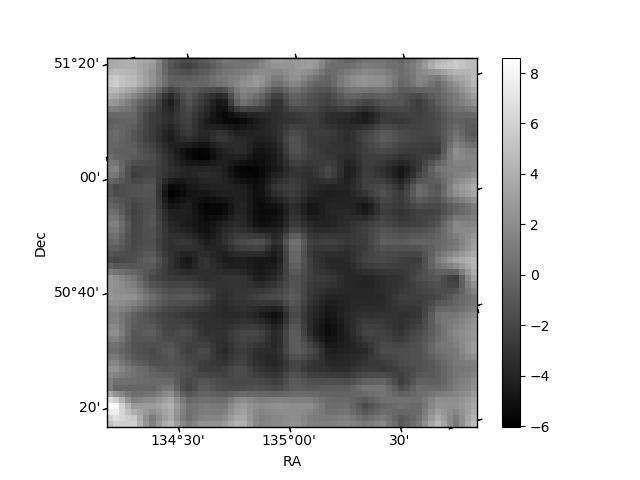
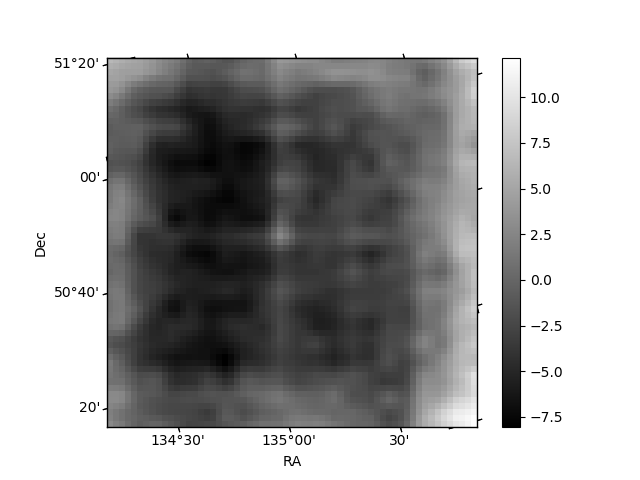
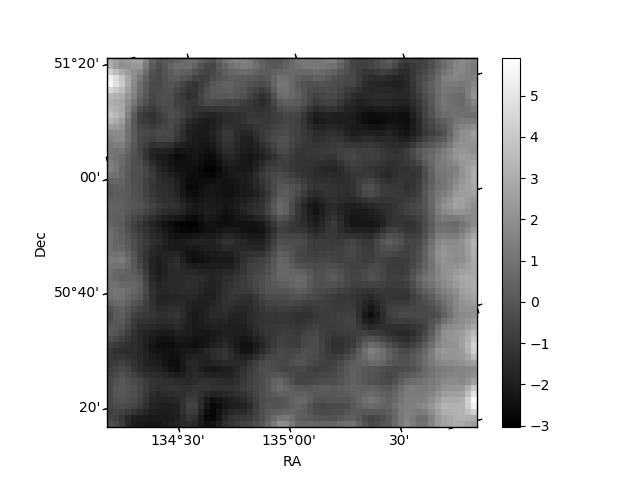
Histogram calculated using DETX and DETY for each event in the final _common_clean file
| Quadrant A | 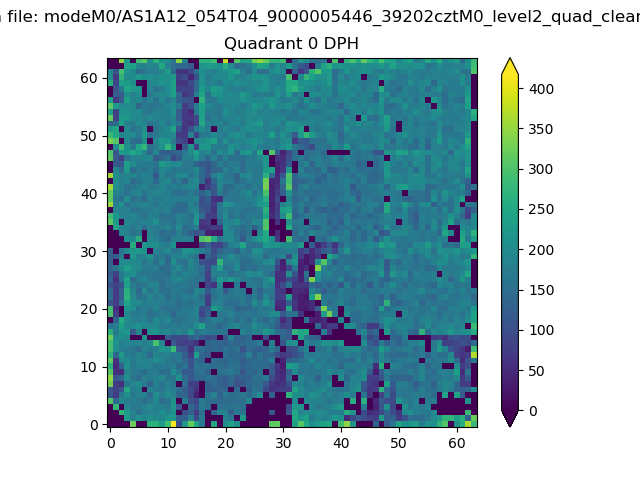 |
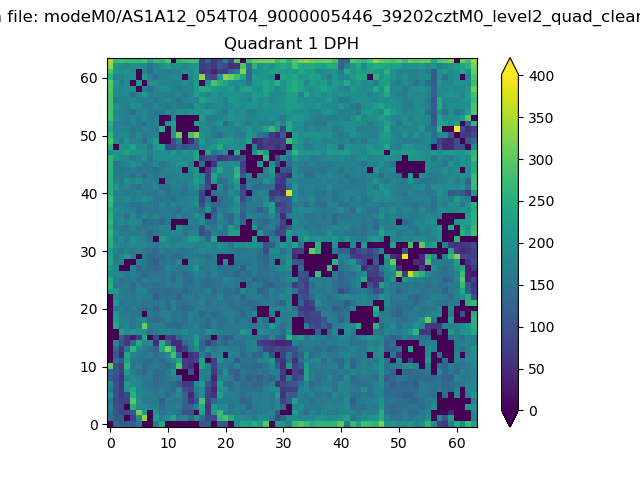 |
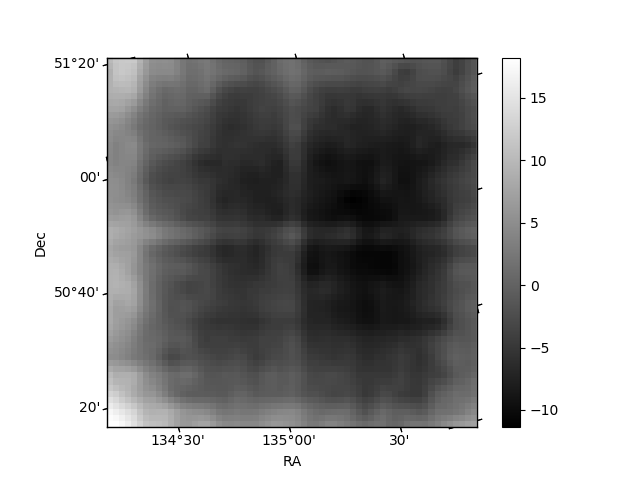
Quadrant B |
|---|---|---|---|
| Quadrant D | 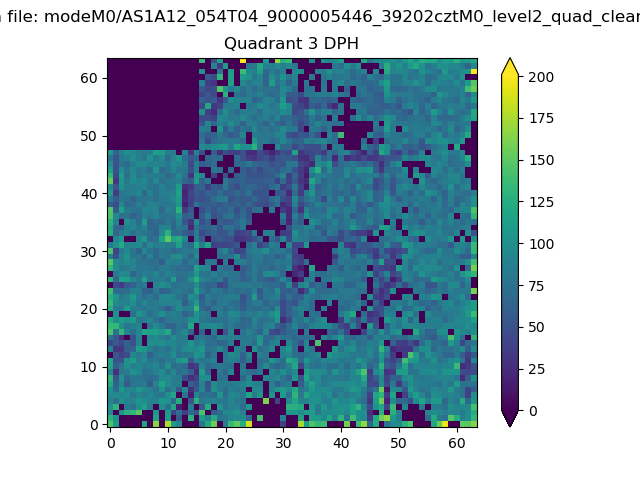 |
 |
Quadrant C |
| Plot type | Count rate plots | Images |
|---|---|---|
| Comparison with Poisson distribution Blue bars denote a histogram of data divided into 1 sec bins. Red curve is a Poisson curve with rate = median count rate of data. |
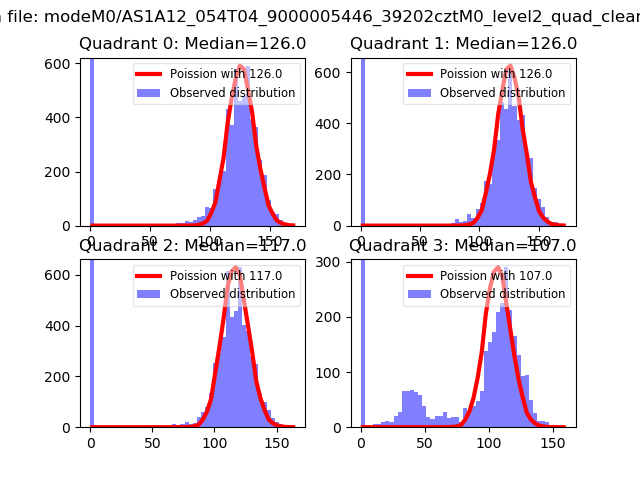 |
 |
| Quadrant-wise count rates Data is divided into 100 sec bins |
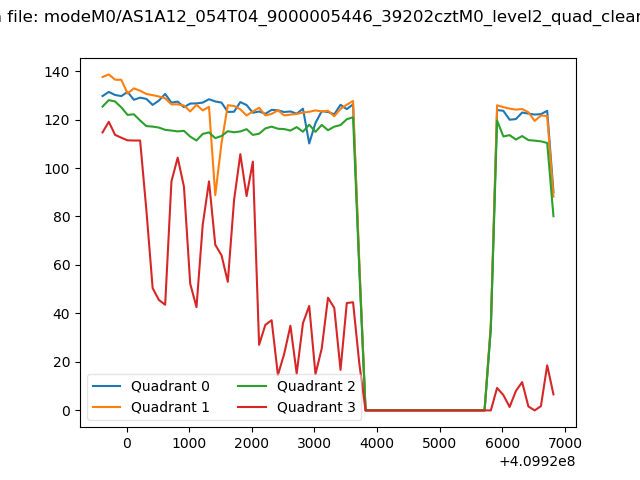 |
|
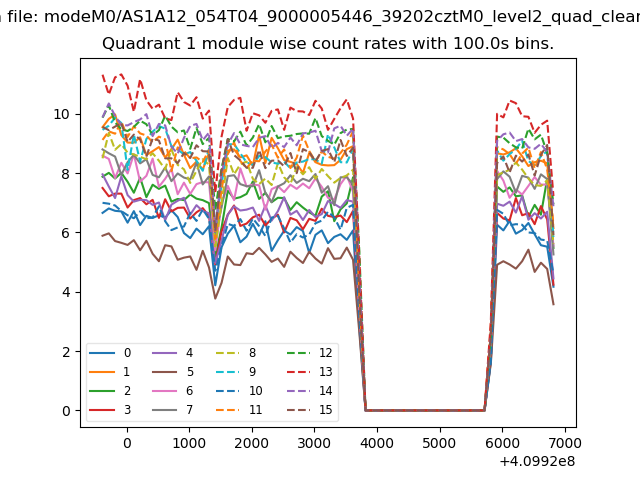
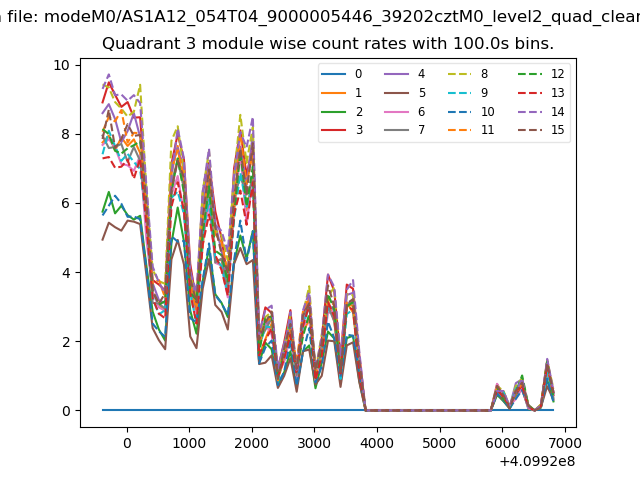
| Module-wise count rates for Quadrant A Data is divided into 100 sec bins |
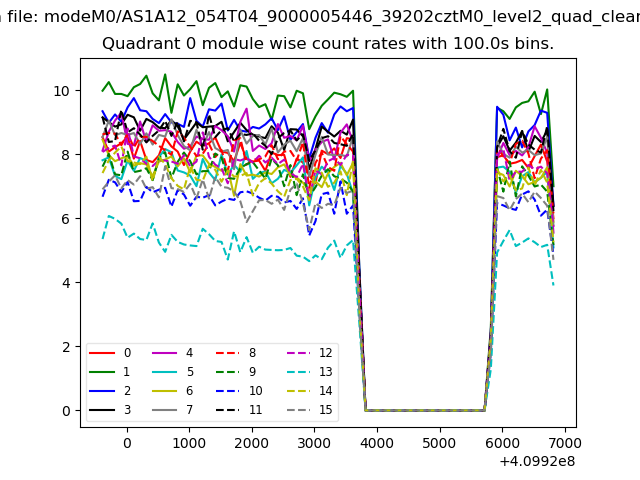 |
 |
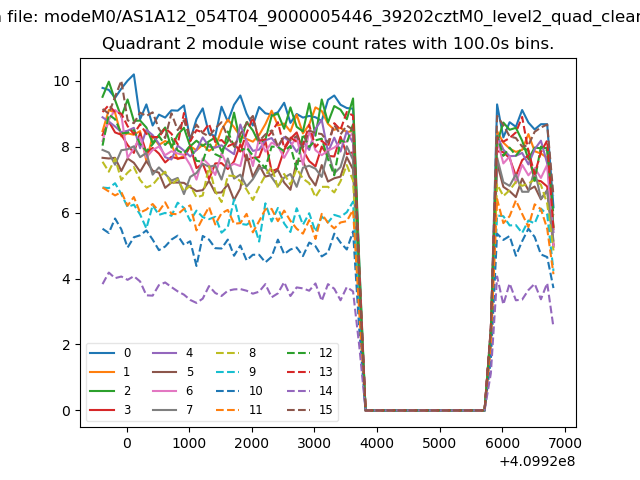
| Module-wise count rates for Quadrant B Data is divided into 100 sec bins |
 |
 |
| Module-wise count rates for Quadrant C Data is divided into 100 sec bins |
 |
 |
| Module-wise count rates for Quadrant D Data is divided into 100 sec bins |
 |
 |
| Parameter | Plot |
|---|---|
| CZT HV Monitor |  |
| D_VDD | 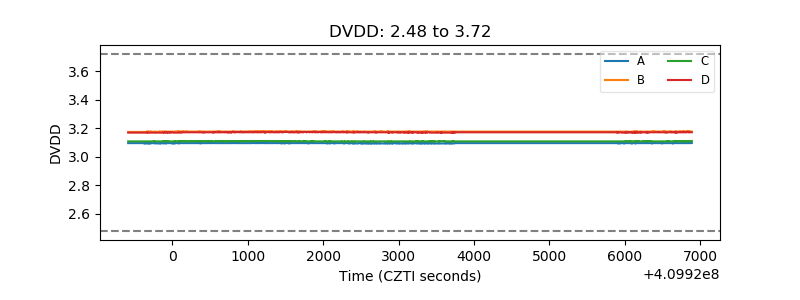 |
| Temperature 1 | 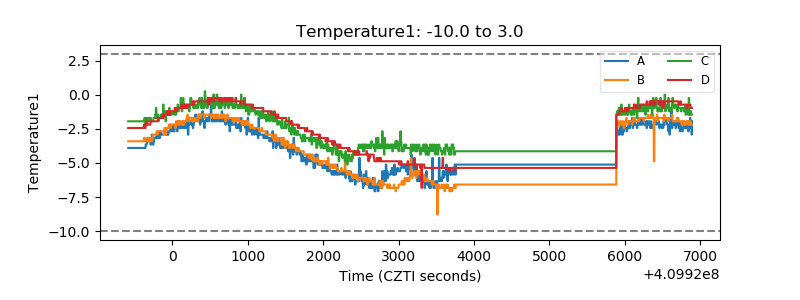 |
| Veto HV Monitor | 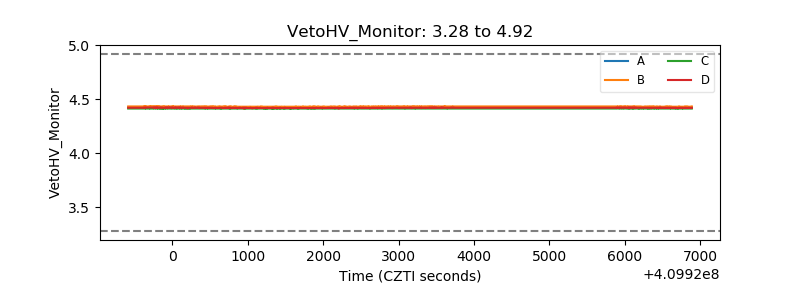 |
| Veto LLD | 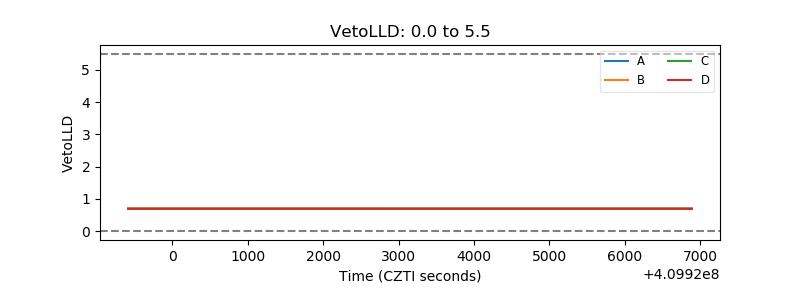 |
| Alpha Counter | 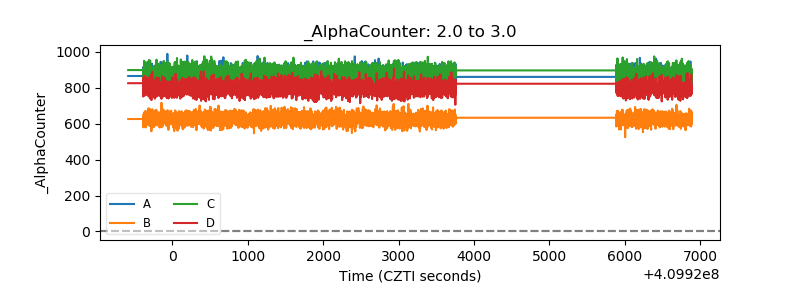 |
| _CPM_Rate | 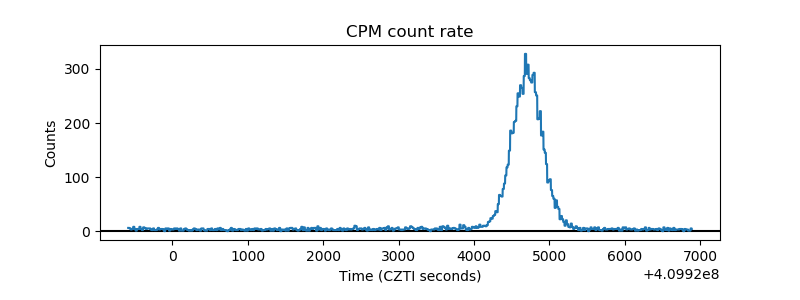 |
| CZT Counter | 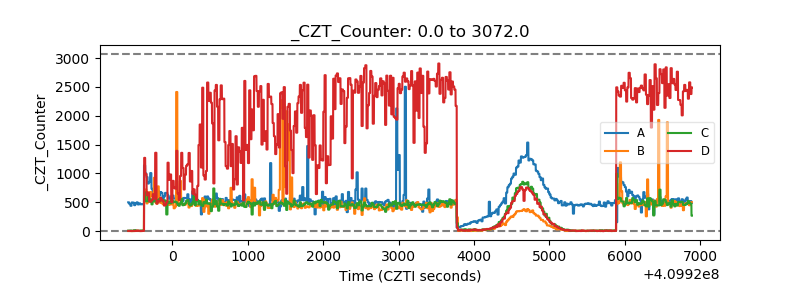 |
| +2.5 Volts monitor | 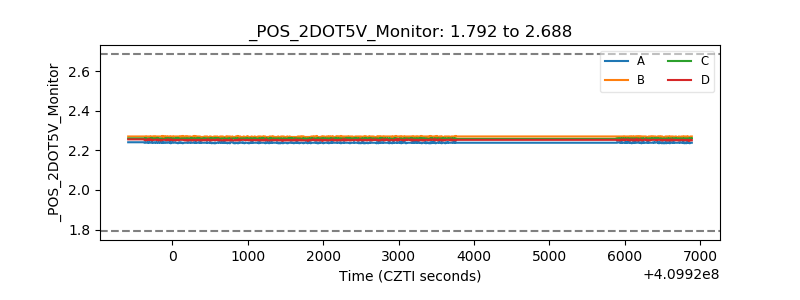 |
| +5 Volts monitor | 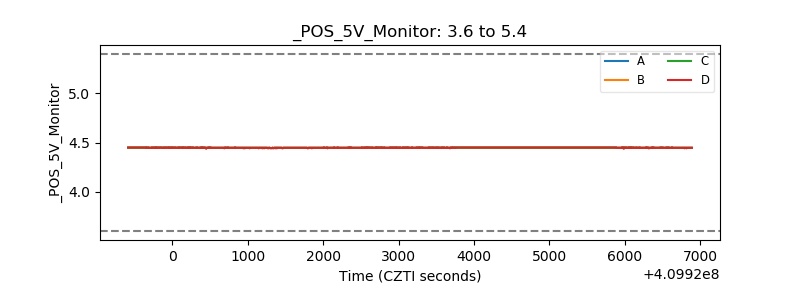 |
| _ROLL_ROT | 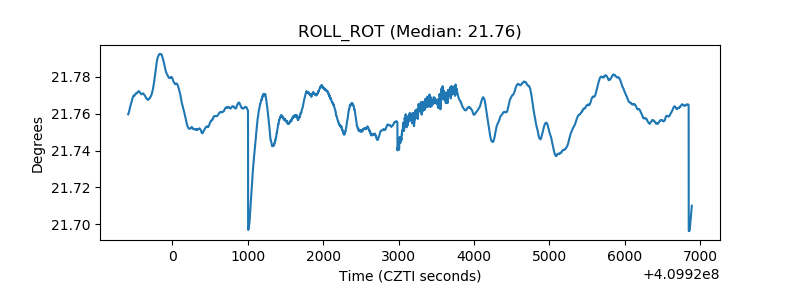 |
| _Roll_DEC | 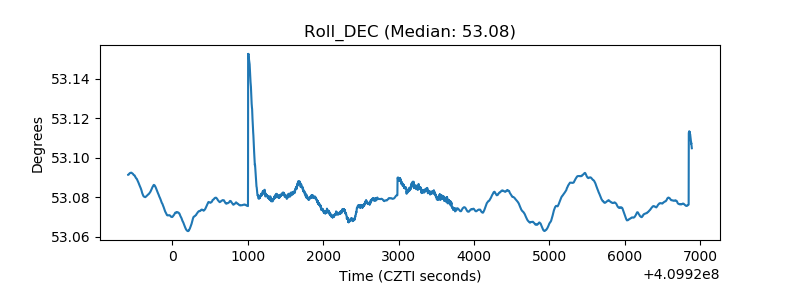 |
| _Roll_RA | 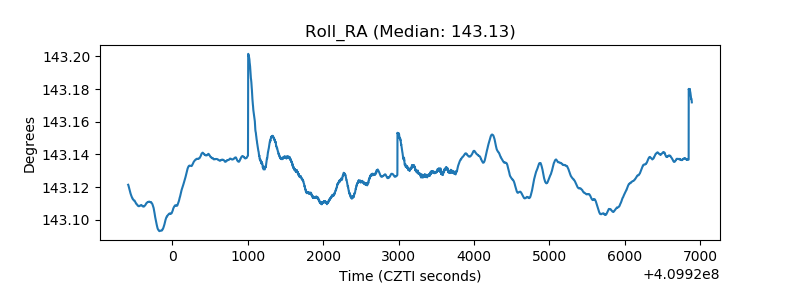 |
| Veto Counter | 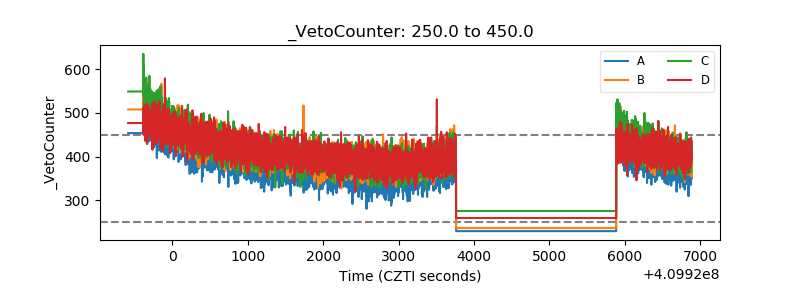 |