| Param | Original file | Final file |
|---|---|---|
| Filename | modeM0/AS1A12_054T04_9000005446_39203cztM0_level2.fits | modeM0/AS1A12_054T04_9000005446_39203cztM0_level2_quad_clean.evt |
| Size (bytes) | 564,318,720 | 74,698,560 |
| Size | 538.2 MB | 71.2 MB |
| Events in quadrant A | 2,732,263 | 621,693 |
| Events in quadrant B | 2,434,634 | 620,628 |
| Events in quadrant C | 2,430,389 | 577,902 |
| Events in quadrant D | 12,886,278 | 76,975 |
| Mode M9 | |||
|---|---|---|---|
| Quadrant | BADHDUFLAG | Total packets | Discarded packets |
| A | 0 | 25 | 0 |
| B | 0 | 25 | 0 |
| C | 0 | 25 | 0 |
| D | 0 | 26 | 0 |
| Mode M0 | |||
|---|---|---|---|
| Quadrant | BADHDUFLAG | Total packets | Discarded packets |
| A | 0 | 11333 | 3 |
| B | 0 | 10857 | 2 |
| C | 0 | 10487 | 2 |
| D | 0 | 41873 | 2 |
| Mode SS | |||
|---|---|---|---|
| Quadrant | BADHDUFLAG | Total packets | Discarded packets |
| A | 0 | 106 | 0 |
| B | 0 | 106 | 0 |
| C | 0 | 106 | 0 |
| D | 0 | 106 | 0 |
| Quadrant | Total seconds | Saturated seconds | Saturation percentage |
|---|---|---|---|
| A | 5206 | 15 | 0.288129% |
| B | 5206 | 22 | 0.422589% |
| C | 5206 | 6 | 0.115252% |
| D | 5206 | 4656 | 89.435267% |
Noise dominated data is calculated using 1-second bins in cleaned event files. If a bin has >2000 counts, and if more than 50% of those come from <1% of pixels, then it is considered to be noise-dominated and hence unusable.
| Quadrant | # 1 sec bins | Bins with >0 counts | Bins with >2000 counts | High rate bins dominated by noise | Noise dominated (total time) | Noise dominated (detector-on time) | Marked lightcurve |
|---|---|---|---|---|---|---|---|
| A | 7178 | 5207 | 8 | 8 | 0.11% | 0.15% | 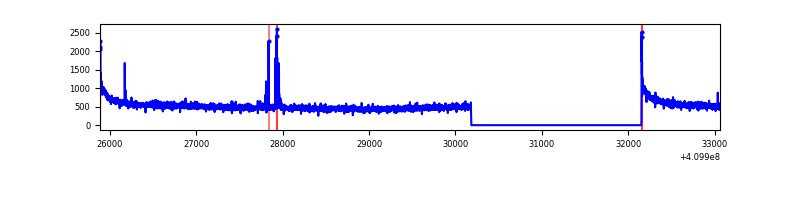 |
| B | 7178 | 5207 | 12 | 12 | 0.17% | 0.23% | 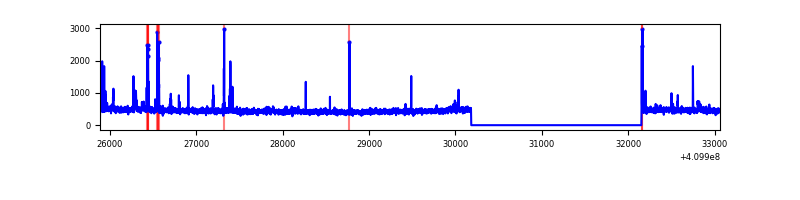 |
| C | 7178 | 5207 | 3 | 3 | 0.04% | 0.06% | 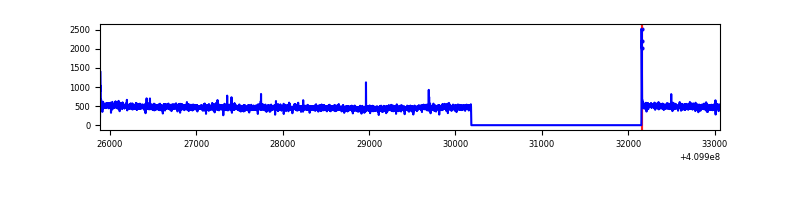 |
| D | 7178 | 5207 | 3797 | 3797 | 52.90% | 72.92% | 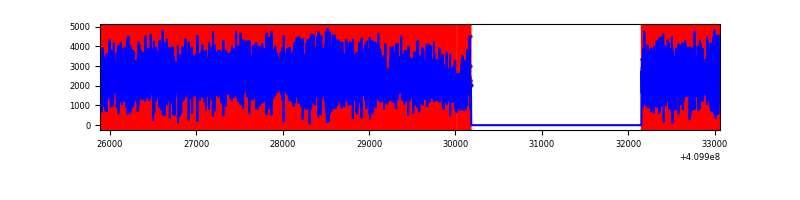 |
Top three noisy pixels from each quadrant. If the there are fewer than three noisy pixels in the level2.evt file, extra rows are filled as -1
| Pixel properties | Quadrant properties | ||||||
|---|---|---|---|---|---|---|---|
| Quadrant | DetID | PixID | Counts | Sigma | Mean | Median | Sigma |
| A | 10 | 83 | 441054 | 3731.73 | 581 | 570 | 118.0 |
| A | 13 | 248 | 38424 | 320.69 | 581 | 570 | 118.0 |
| A | 13 | 254 | 6827 | 53.01 | 581 | 570 | 118.0 |
| B | 5 | 184 | 83183 | 760.87 | 573 | 558 | 108.6 |
| B | 5 | 172 | 70914 | 647.89 | 573 | 558 | 108.6 |
| B | 0 | 190 | 13871 | 122.6 | 573 | 558 | 108.6 |
| C | 15 | 214 | 218729 | 1665.55 | 562 | 565 | 131.0 |
| C | 0 | 10 | 15100 | 110.97 | 562 | 565 | 131.0 |
| C | 3 | 233 | 4858 | 32.77 | 562 | 565 | 131.0 |
| D | 12 | 235 | 11292451 | 153168.89 | 298 | 289 | 73.7 |
| D | 5 | 222 | 120172 | 1626.11 | 298 | 289 | 73.7 |
| D | 12 | 233 | 111388 | 1506.96 | 298 | 289 | 73.7 |
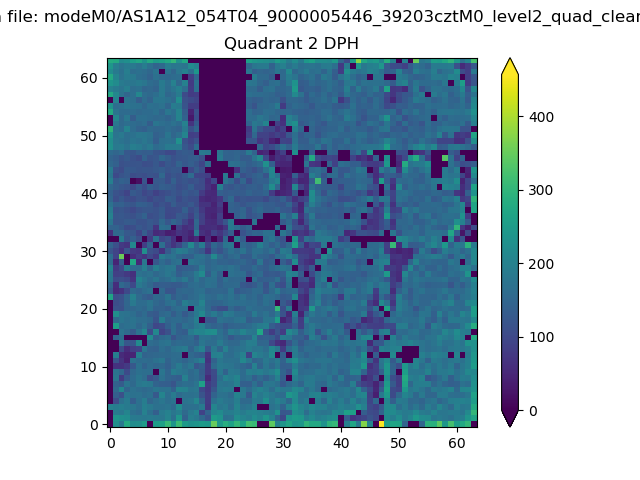
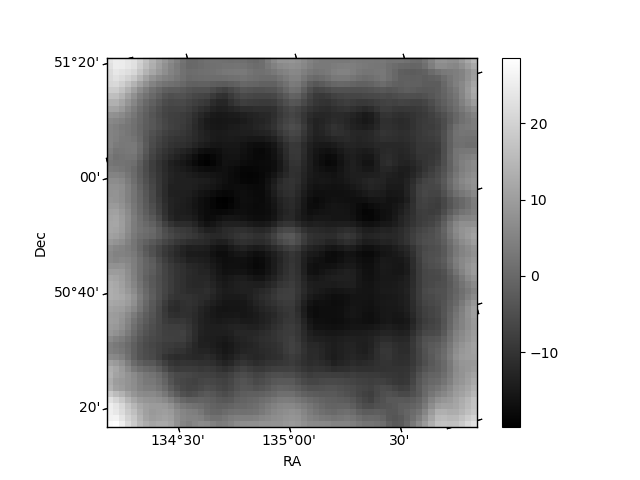
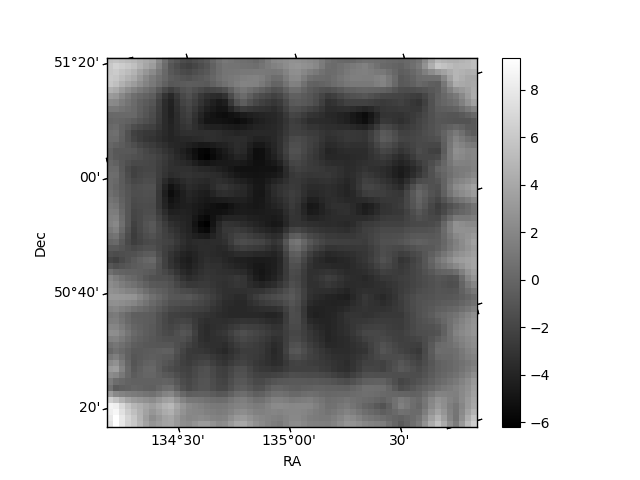
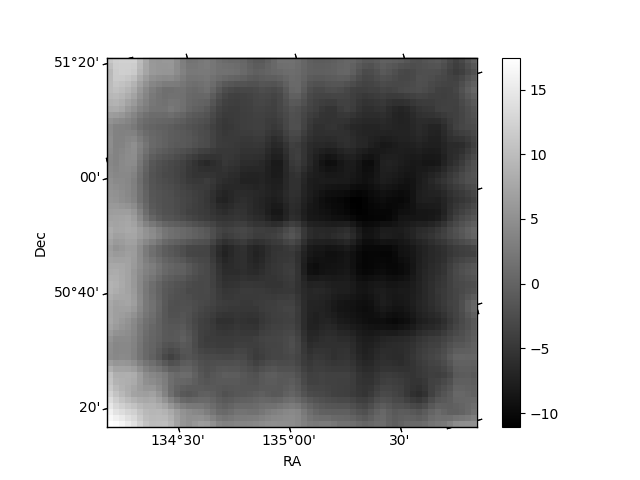
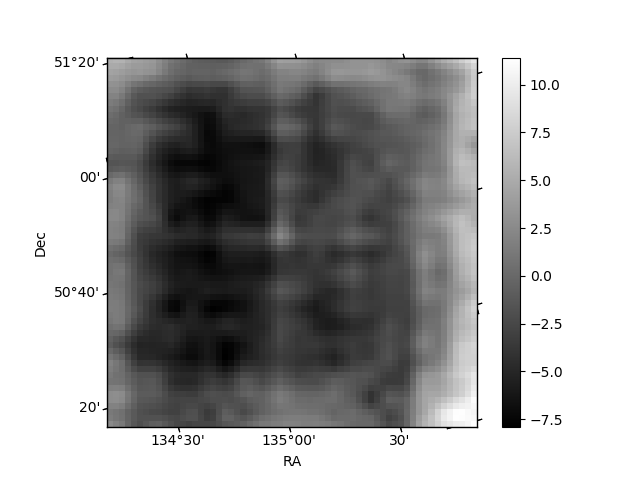
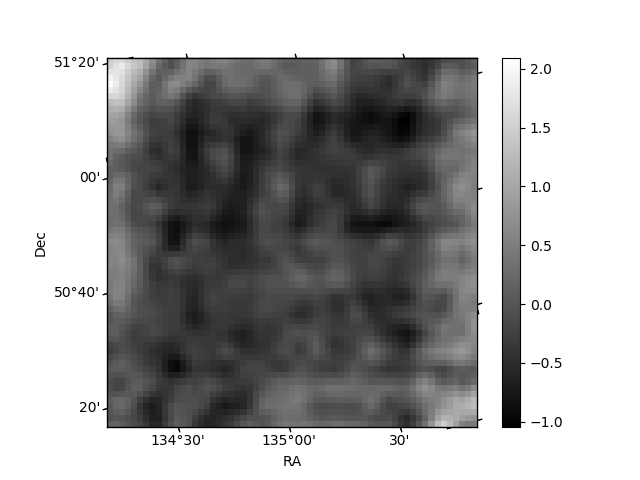
Histogram calculated using DETX and DETY for each event in the final _common_clean file
| Quadrant A | 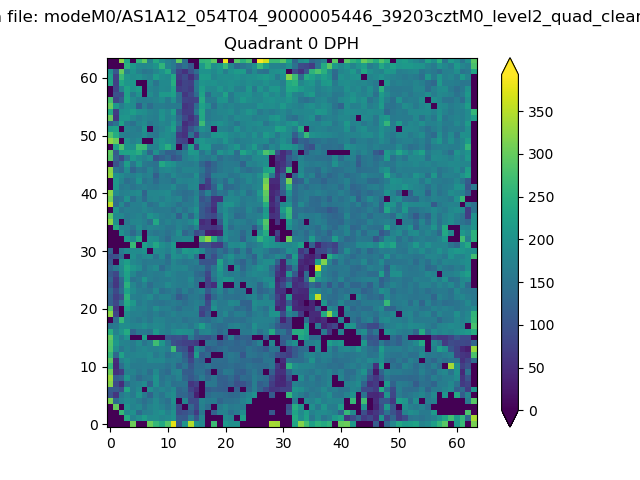 |
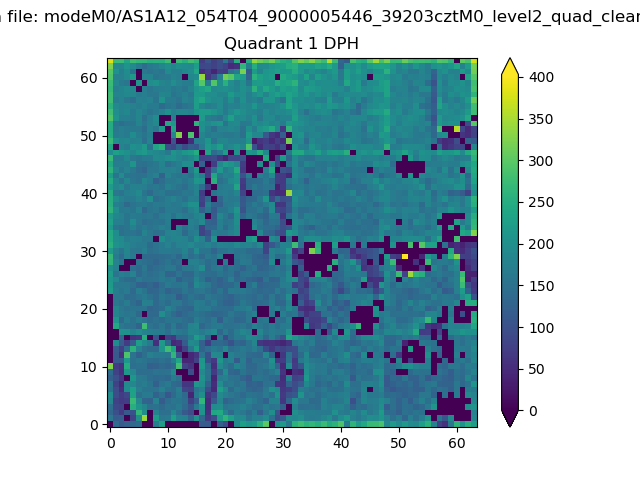 |
Quadrant B |
|---|---|---|---|
| Quadrant D | 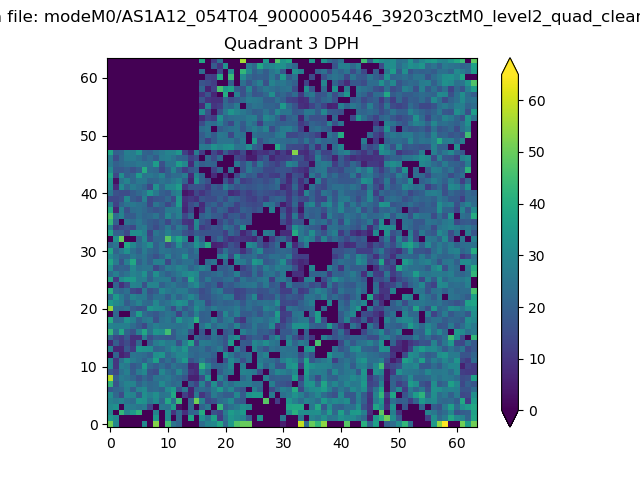 |
 |
Quadrant C |
| Plot type | Count rate plots | Images |
|---|---|---|
| Comparison with Poisson distribution Blue bars denote a histogram of data divided into 1 sec bins. Red curve is a Poisson curve with rate = median count rate of data. |
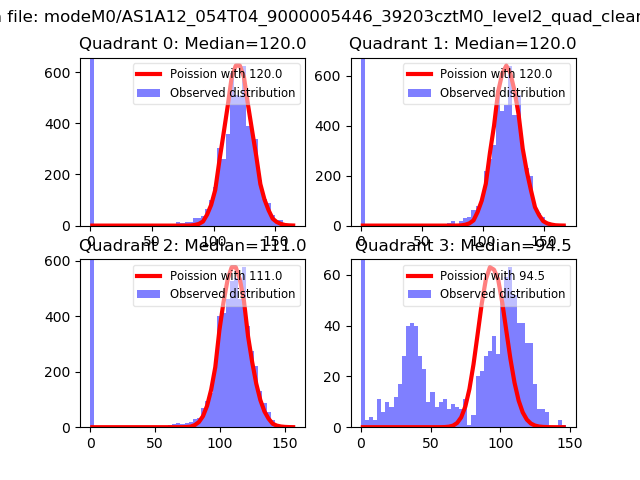 |
 |
| Quadrant-wise count rates Data is divided into 100 sec bins |
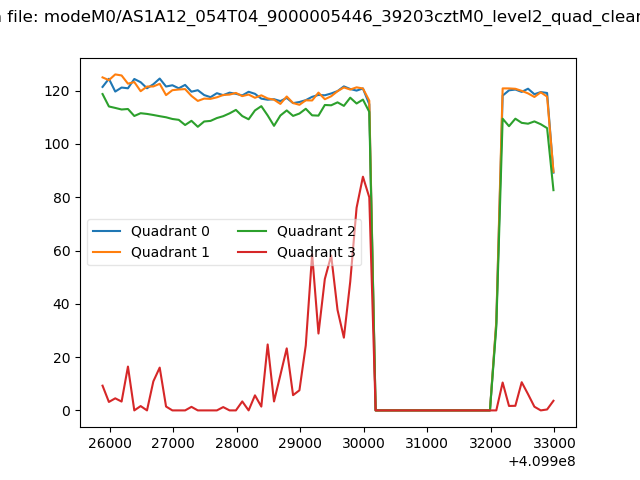 |
|
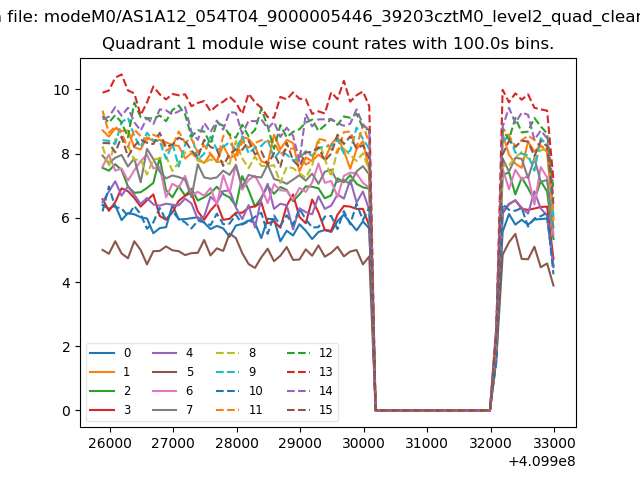
| Module-wise count rates for Quadrant A Data is divided into 100 sec bins |
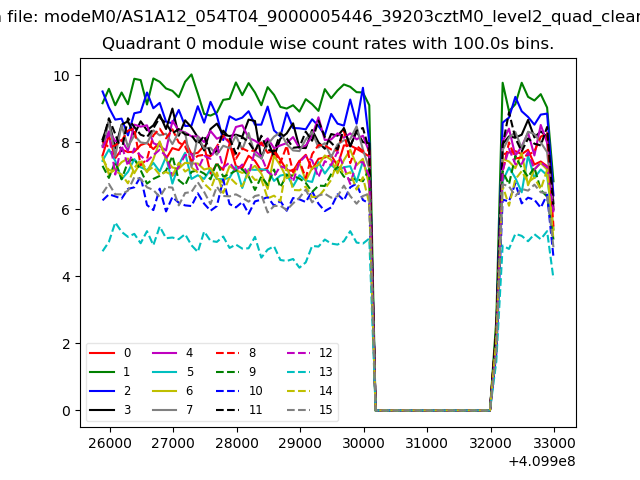 |
 |
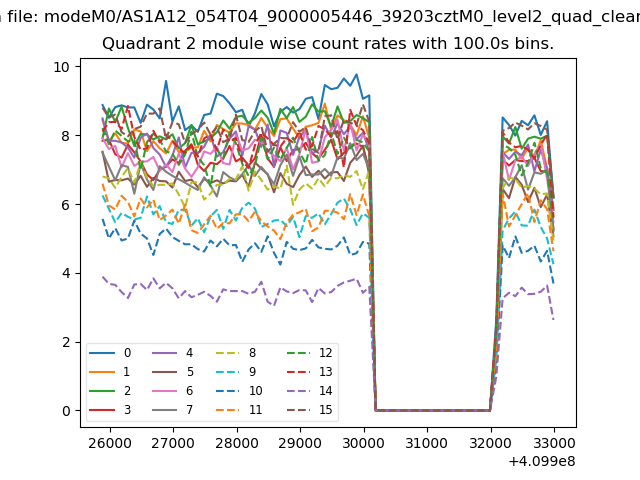
| Module-wise count rates for Quadrant B Data is divided into 100 sec bins |
 |
 |
| Module-wise count rates for Quadrant C Data is divided into 100 sec bins |
 |
 |
| Module-wise count rates for Quadrant D Data is divided into 100 sec bins |
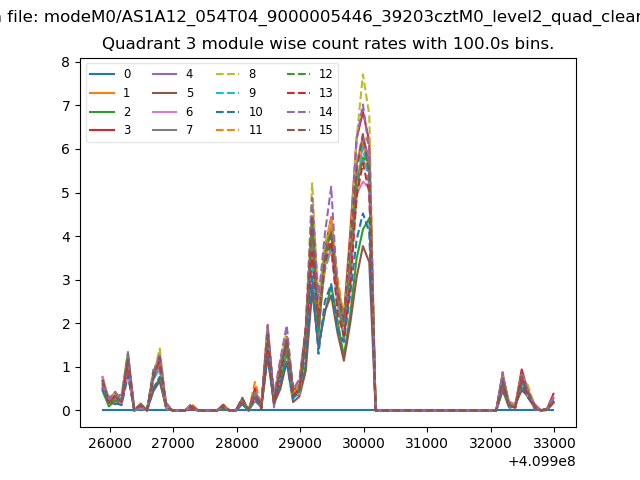 |
 |
| Parameter | Plot |
|---|---|
| CZT HV Monitor | 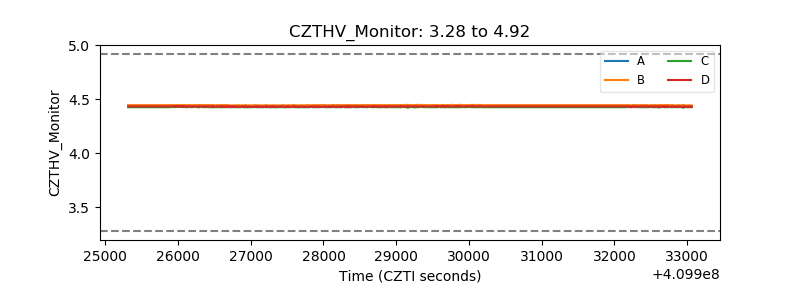 |
| D_VDD | 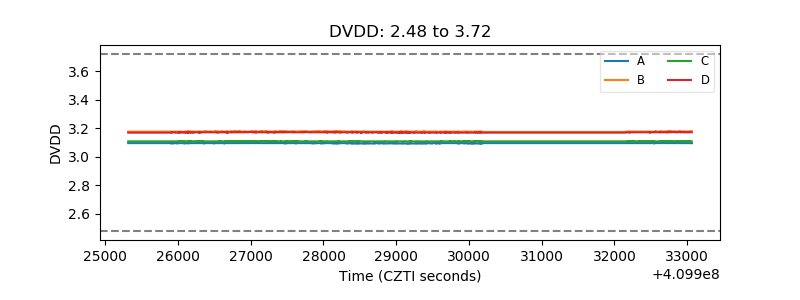 |
| Temperature 1 | 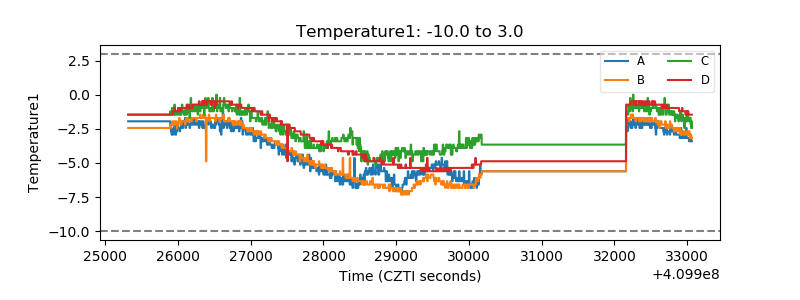 |
| Veto HV Monitor | 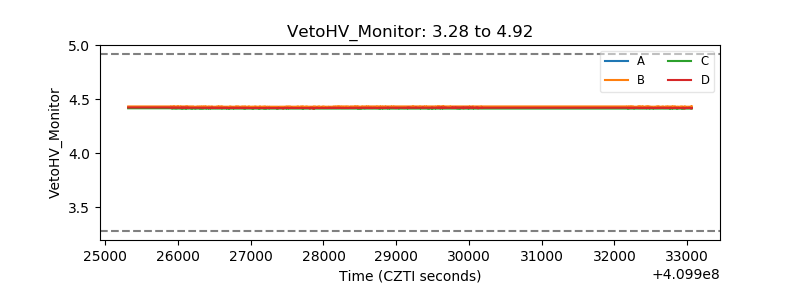 |
| Veto LLD | 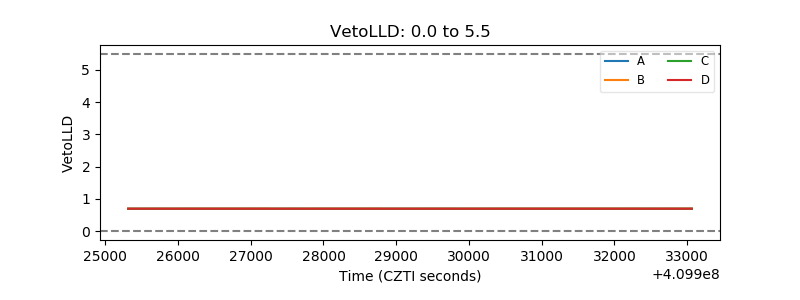 |
| Alpha Counter | 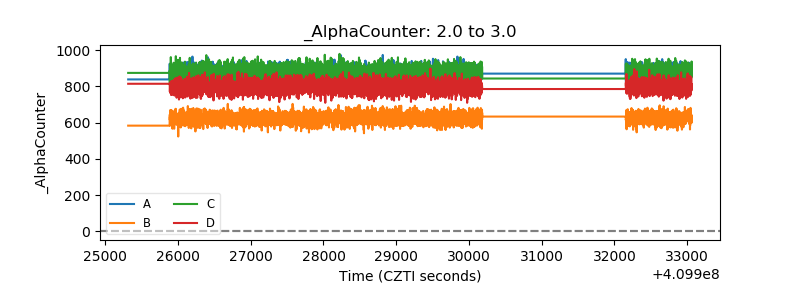 |
| _CPM_Rate | 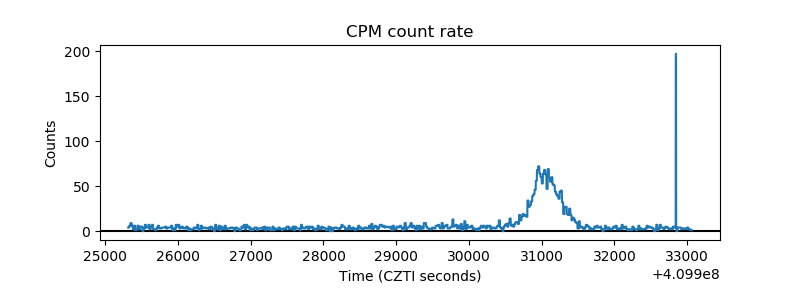 |
| CZT Counter | 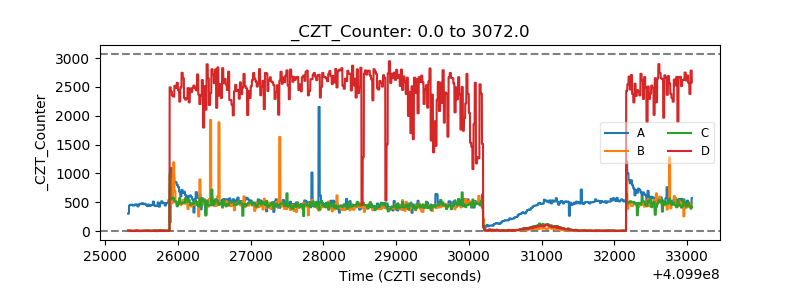 |
| +2.5 Volts monitor | 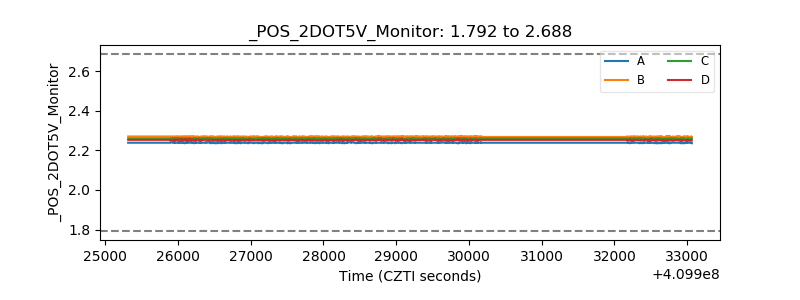 |
| +5 Volts monitor | 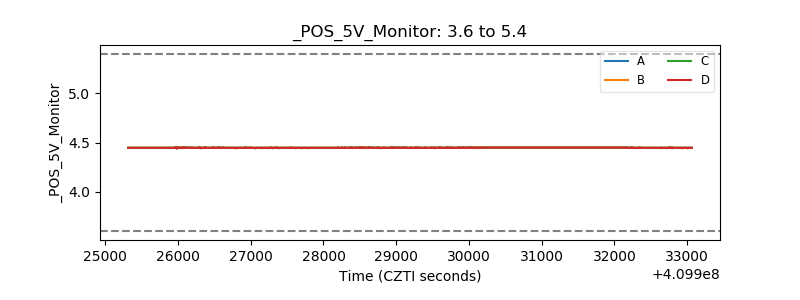 |
| _ROLL_ROT | 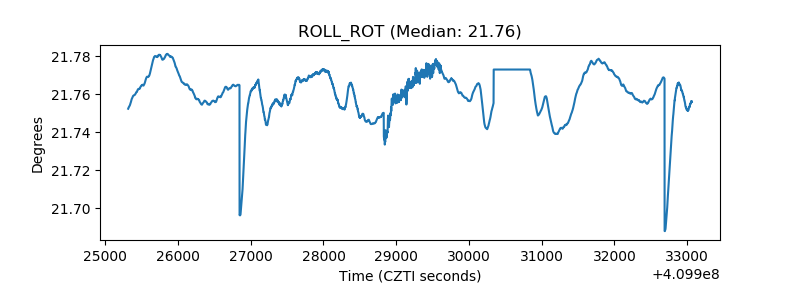 |
| _Roll_DEC | 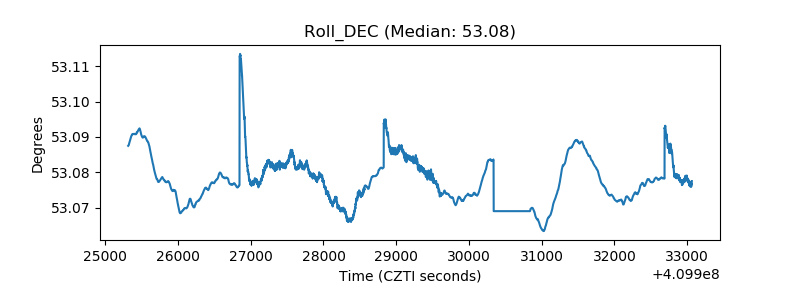 |
| _Roll_RA |  |
| Veto Counter | 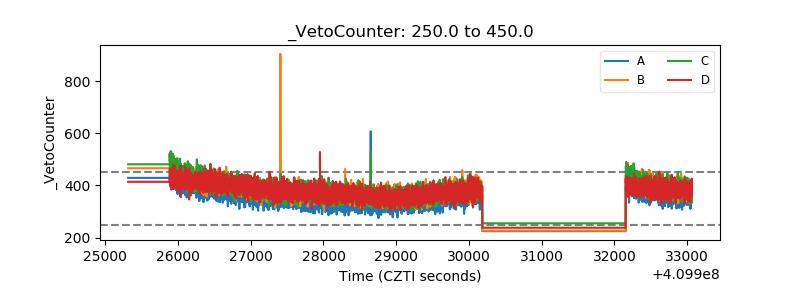 |