| Param | Original file | Final file |
|---|---|---|
| Filename | modeM0/AS1A12_054T04_9000005446_39204cztM0_level2.fits | modeM0/AS1A12_054T04_9000005446_39204cztM0_level2_quad_clean.evt |
| Size (bytes) | 581,454,720 | 75,890,880 |
| Size | 554.5 MB | 72.4 MB |
| Events in quadrant A | 2,855,710 | 623,104 |
| Events in quadrant B | 2,418,245 | 626,710 |
| Events in quadrant C | 2,518,298 | 589,210 |
| Events in quadrant D | 13,307,479 | 78,616 |
| Mode M9 | |||
|---|---|---|---|
| Quadrant | BADHDUFLAG | Total packets | Discarded packets |
| A | 0 | 28 | 0 |
| B | 0 | 28 | 0 |
| C | 0 | 28 | 0 |
| D | 0 | 29 | 0 |
| Mode M0 | |||
|---|---|---|---|
| Quadrant | BADHDUFLAG | Total packets | Discarded packets |
| A | 0 | 11962 | 3 |
| B | 0 | 11101 | 2 |
| C | 0 | 11008 | 2 |
| D | 0 | 43207 | 2 |
| Mode SS | |||
|---|---|---|---|
| Quadrant | BADHDUFLAG | Total packets | Discarded packets |
| A | 0 | 110 | 0 |
| B | 0 | 110 | 0 |
| C | 0 | 110 | 0 |
| D | 0 | 110 | 0 |
| Quadrant | Total seconds | Saturated seconds | Saturation percentage |
|---|---|---|---|
| A | 5432 | 40 | 0.736377% |
| B | 5432 | 11 | 0.202504% |
| C | 5432 | 8 | 0.147275% |
| D | 5432 | 4899 | 90.187776% |
Noise dominated data is calculated using 1-second bins in cleaned event files. If a bin has >2000 counts, and if more than 50% of those come from <1% of pixels, then it is considered to be noise-dominated and hence unusable.
| Quadrant | # 1 sec bins | Bins with >0 counts | Bins with >2000 counts | High rate bins dominated by noise | Noise dominated (total time) | Noise dominated (detector-on time) | Marked lightcurve |
|---|---|---|---|---|---|---|---|
| A | 7046 | 5433 | 27 | 27 | 0.38% | 0.50% | 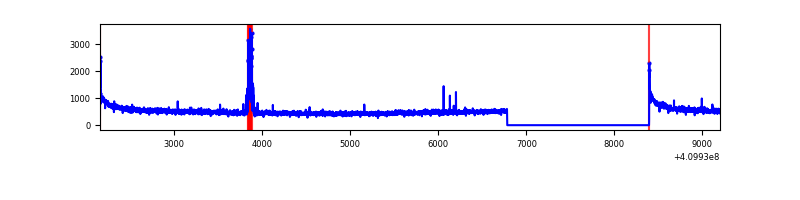 |
| B | 7046 | 5433 | 4 | 4 | 0.06% | 0.07% | 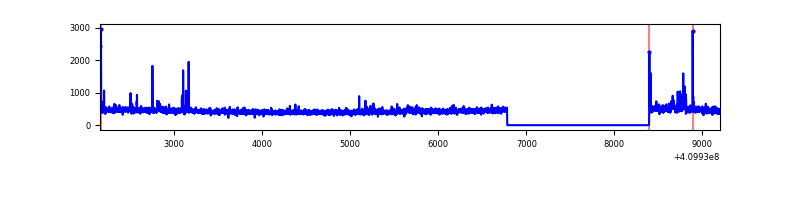 |
| C | 7046 | 5433 | 5 | 5 | 0.07% | 0.09% | 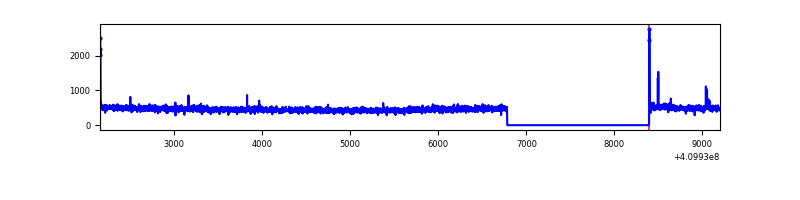 |
| D | 7046 | 5433 | 3754 | 3754 | 53.28% | 69.10% | 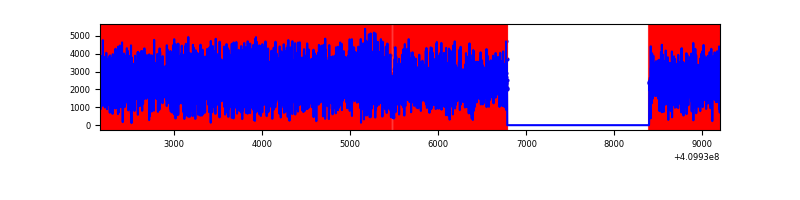 |
Top three noisy pixels from each quadrant. If the there are fewer than three noisy pixels in the level2.evt file, extra rows are filled as -1
| Pixel properties | Quadrant properties | ||||||
|---|---|---|---|---|---|---|---|
| Quadrant | DetID | PixID | Counts | Sigma | Mean | Median | Sigma |
| A | 10 | 83 | 449750 | 3720.56 | 594 | 581 | 120.7 |
| A | 13 | 248 | 95782 | 788.57 | 594 | 581 | 120.7 |
| A | 9 | 143 | 12122 | 95.6 | 594 | 581 | 120.7 |
| B | 5 | 172 | 57610 | 499.47 | 589 | 574 | 114.2 |
| B | 5 | 184 | 14970 | 126.07 | 589 | 574 | 114.2 |
| B | 12 | 111 | 13769 | 115.55 | 589 | 574 | 114.2 |
| C | 15 | 214 | 228476 | 1689.15 | 575 | 577 | 134.9 |
| C | 3 | 233 | 24611 | 178.14 | 575 | 577 | 134.9 |
| C | 0 | 10 | 18075 | 129.69 | 575 | 577 | 134.9 |
| D | 12 | 235 | 11704821 | 143626.17 | 327 | 317 | 81.5 |
| D | 12 | 233 | 115215 | 1409.92 | 327 | 317 | 81.5 |
| D | 1 | 47 | 89464 | 1093.92 | 327 | 317 | 81.5 |
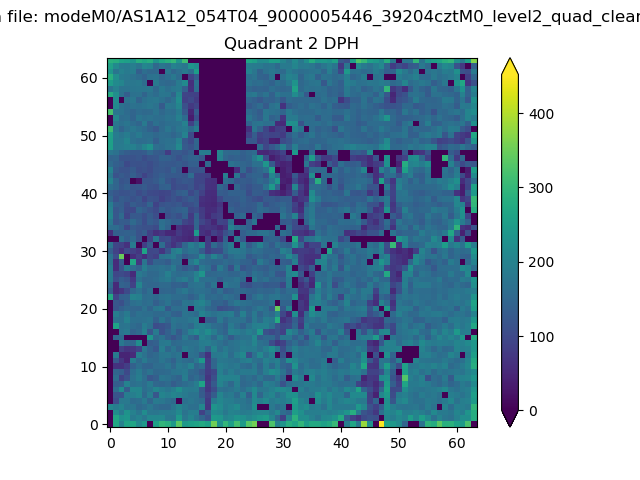
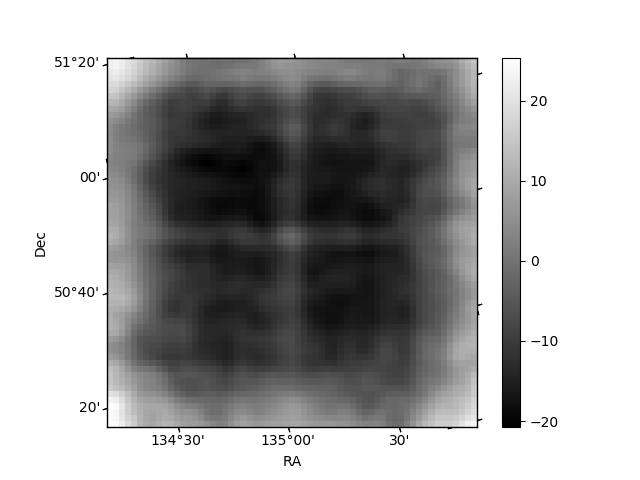
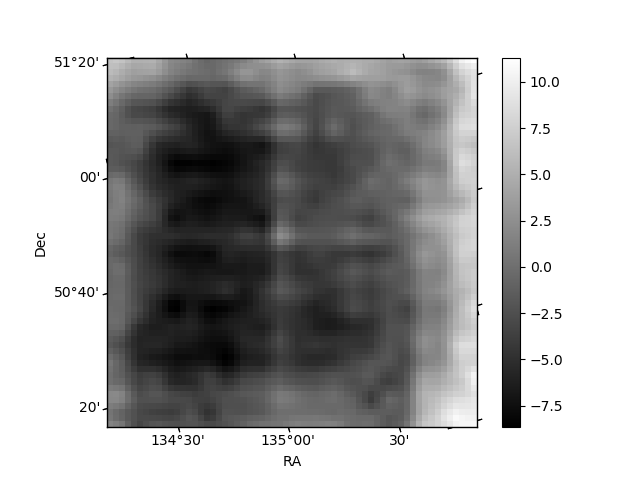
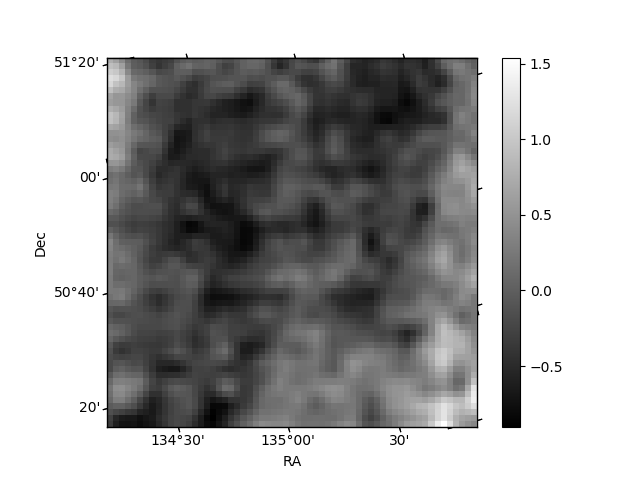
Histogram calculated using DETX and DETY for each event in the final _common_clean file
| Quadrant A | 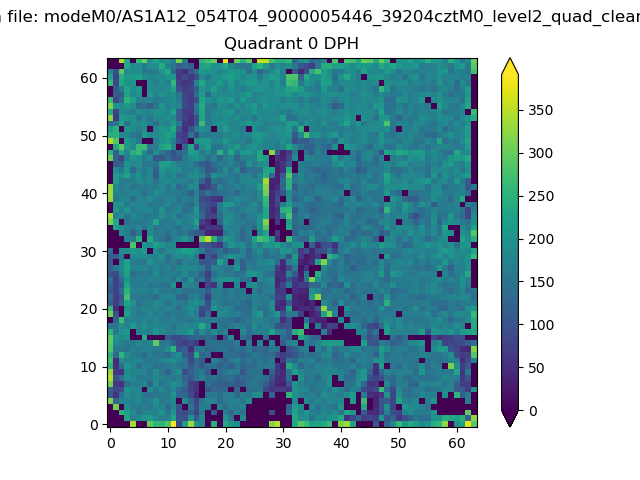 |
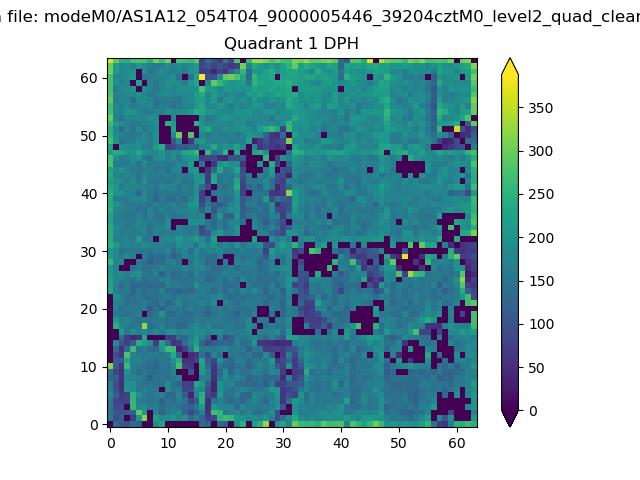 |
Quadrant B |
|---|---|---|---|
| Quadrant D | 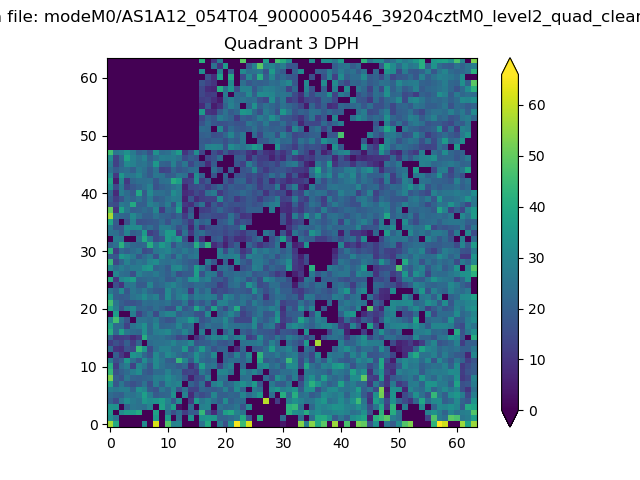 |
 |
Quadrant C |
| Plot type | Count rate plots | Images |
|---|---|---|
| Comparison with Poisson distribution Blue bars denote a histogram of data divided into 1 sec bins. Red curve is a Poisson curve with rate = median count rate of data. |
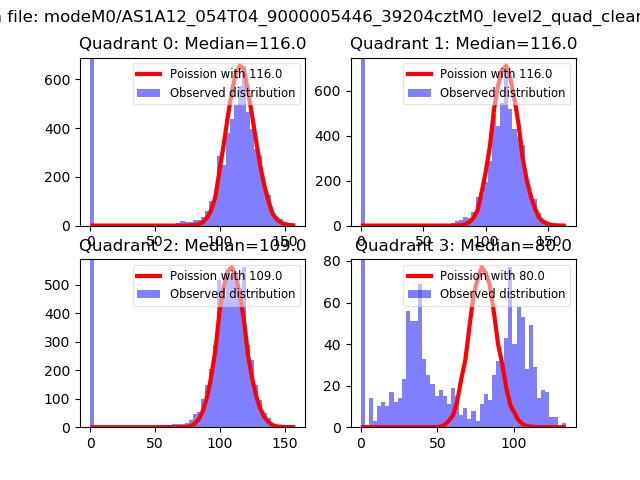 |
 |
| Quadrant-wise count rates Data is divided into 100 sec bins |
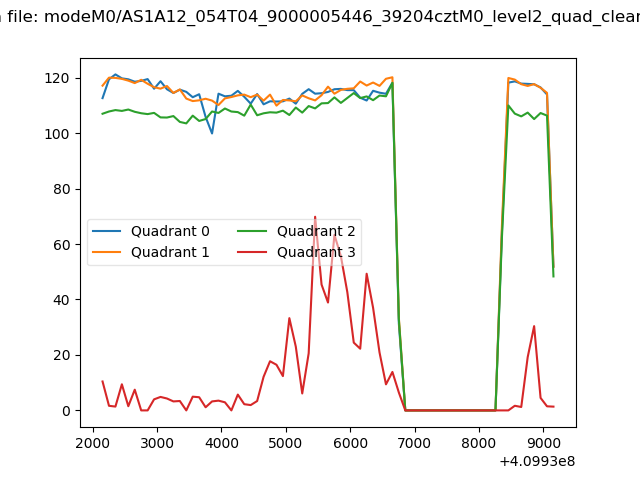 |
|
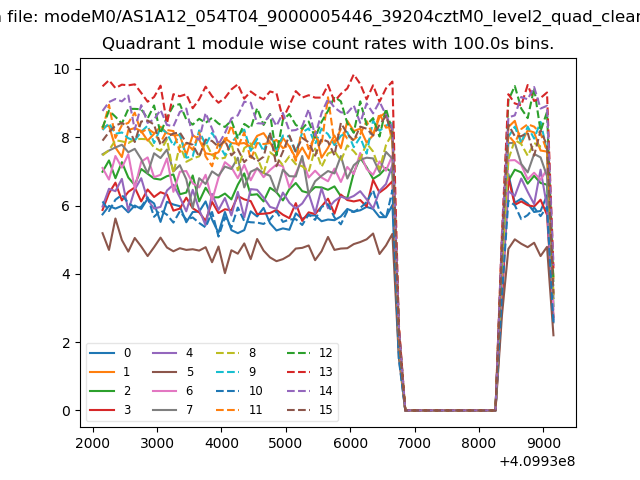
| Module-wise count rates for Quadrant A Data is divided into 100 sec bins |
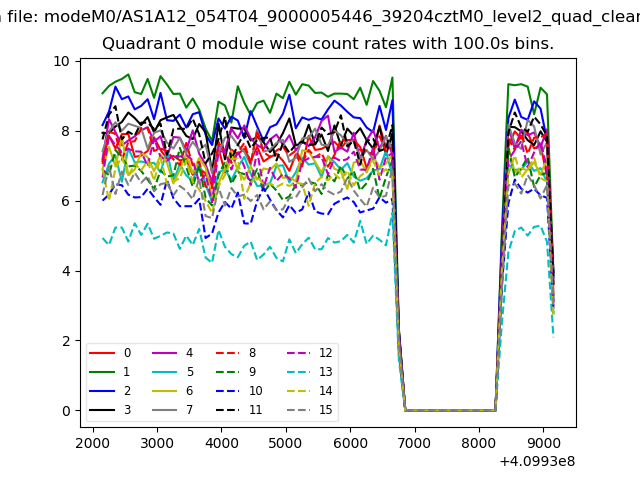 |
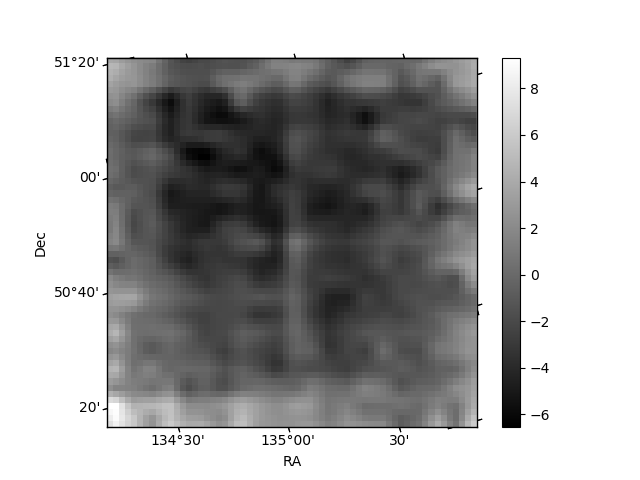 |
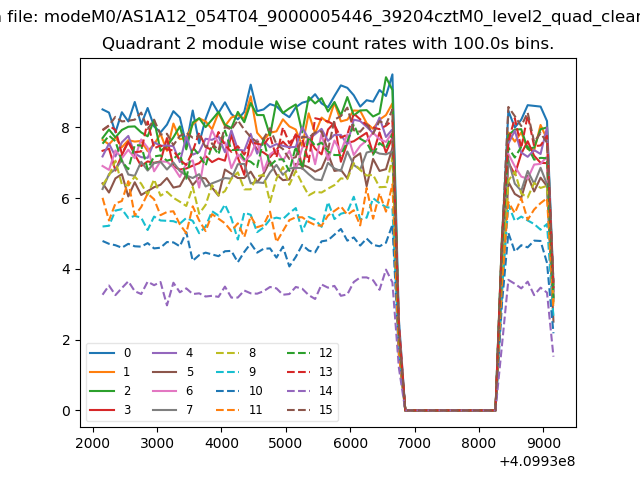
| Module-wise count rates for Quadrant B Data is divided into 100 sec bins |
 |
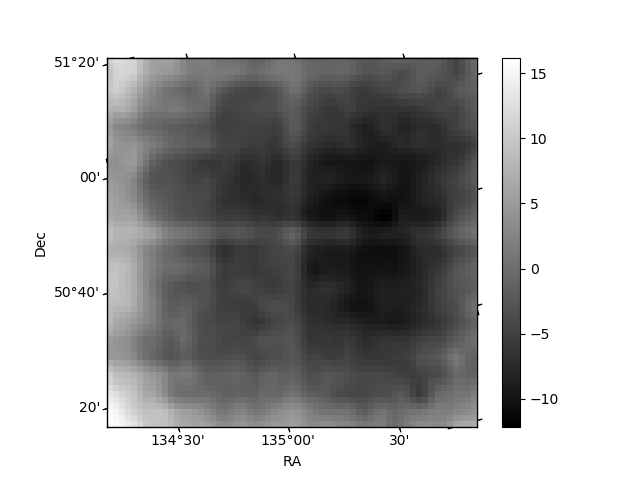 |
| Module-wise count rates for Quadrant C Data is divided into 100 sec bins |
 |
 |
| Module-wise count rates for Quadrant D Data is divided into 100 sec bins |
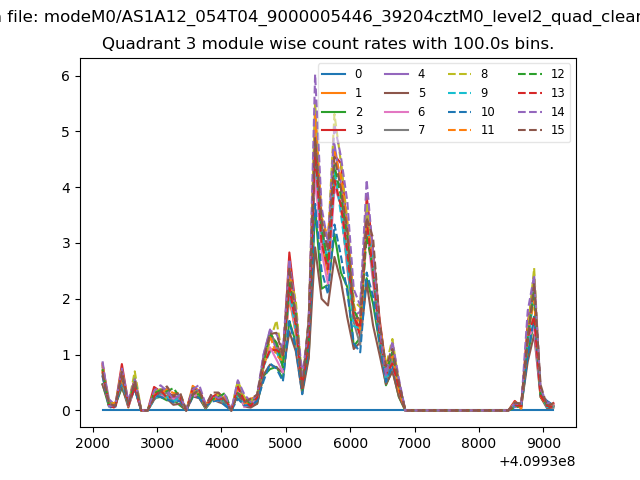 |
 |
| Parameter | Plot |
|---|---|
| CZT HV Monitor | 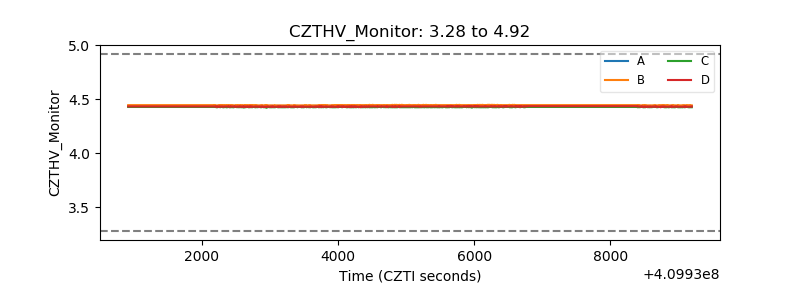 |
| D_VDD | 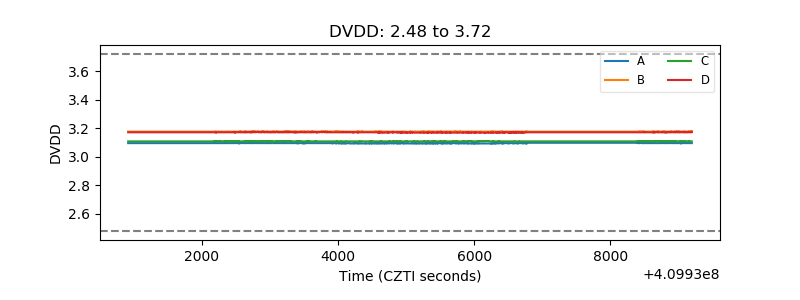 |
| Temperature 1 | 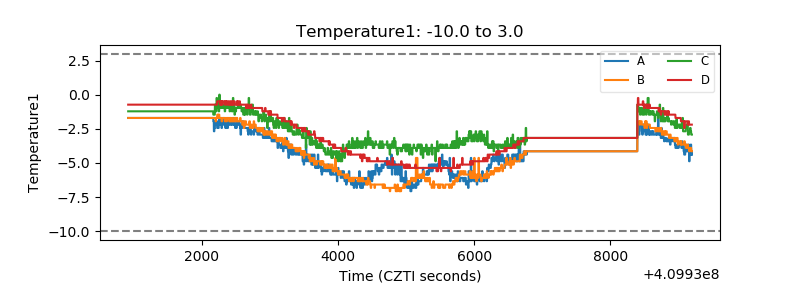 |
| Veto HV Monitor | 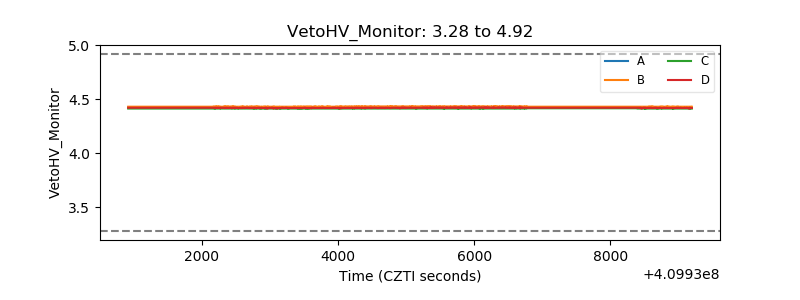 |
| Veto LLD | 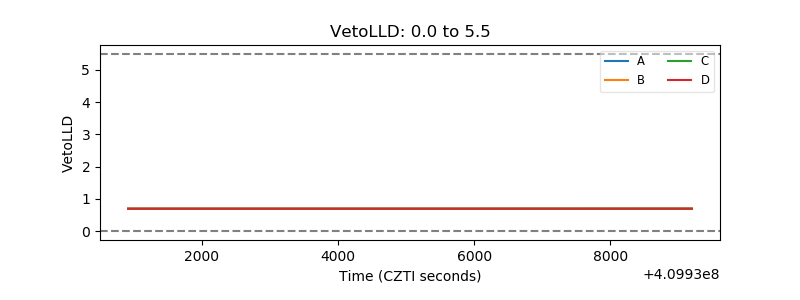 |
| Alpha Counter | 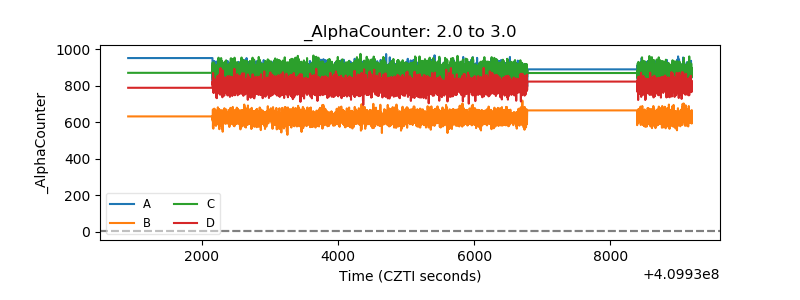 |
| _CPM_Rate | 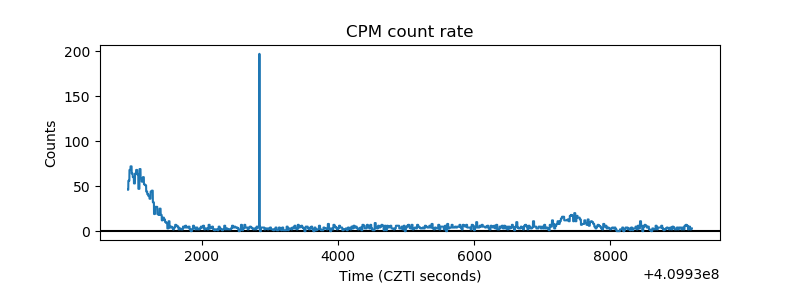 |
| CZT Counter | 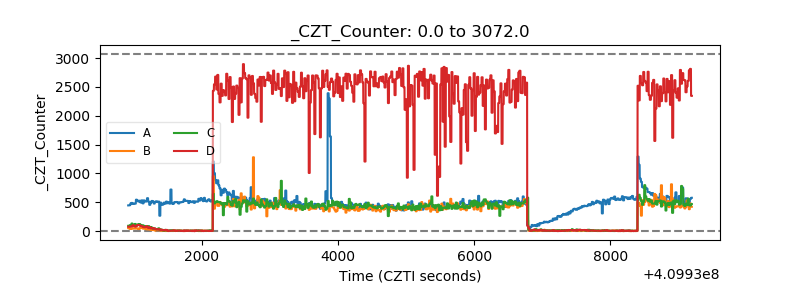 |
| +2.5 Volts monitor | 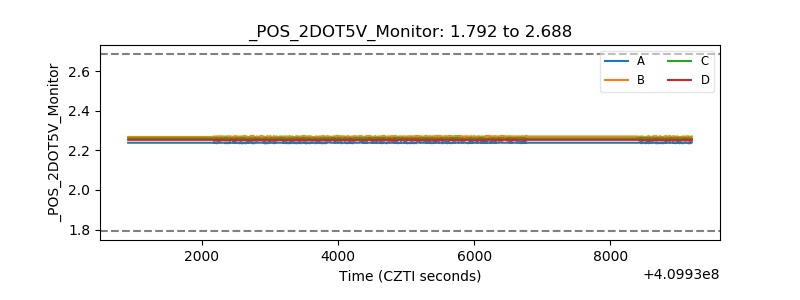 |
| +5 Volts monitor | 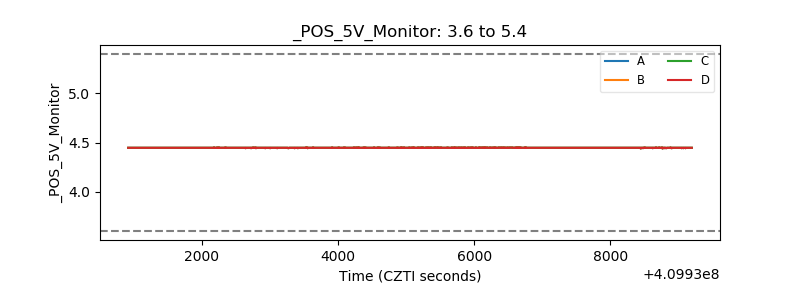 |
| _ROLL_ROT | 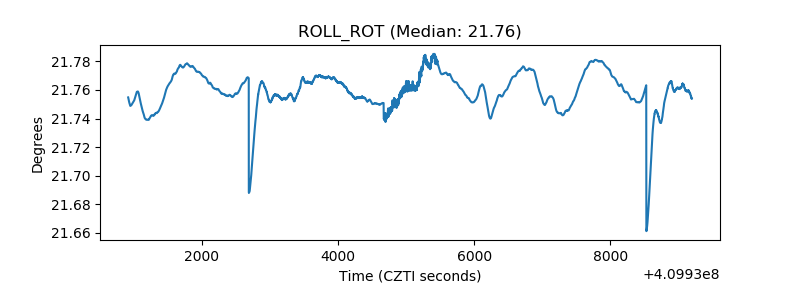 |
| _Roll_DEC | 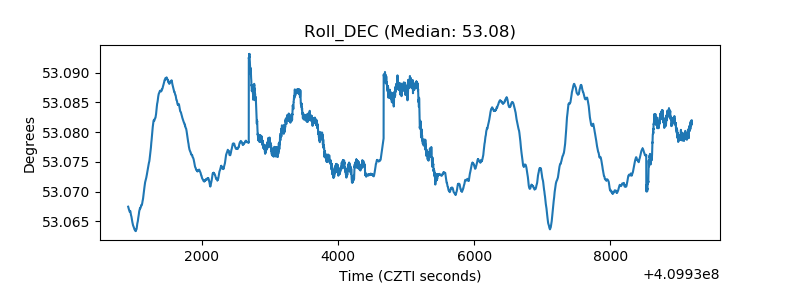 |
| _Roll_RA | 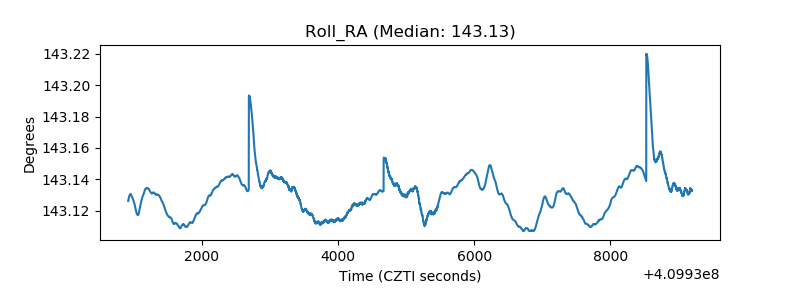 |
| Veto Counter | 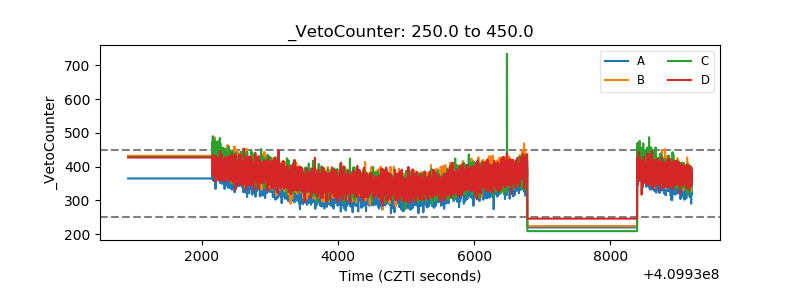 |