| Param | Original file | Final file |
|---|---|---|
| Filename | modeM0/AS1A12_054T04_9000005446_39205cztM0_level2.fits | modeM0/AS1A12_054T04_9000005446_39205cztM0_level2_quad_clean.evt |
| Size (bytes) | 532,054,080 | 87,937,920 |
| Size | 507.4 MB | 83.9 MB |
| Events in quadrant A | 3,019,139 | 657,320 |
| Events in quadrant B | 2,668,416 | 656,995 |
| Events in quadrant C | 2,679,660 | 624,245 |
| Events in quadrant D | 10,876,566 | 318,607 |
| Mode M9 | |||
|---|---|---|---|
| Quadrant | BADHDUFLAG | Total packets | Discarded packets |
| A | 0 | 24 | 0 |
| B | 0 | 24 | 0 |
| C | 0 | 24 | 0 |
| D | 0 | 25 | 0 |
| Mode M0 | |||
|---|---|---|---|
| Quadrant | BADHDUFLAG | Total packets | Discarded packets |
| A | 0 | 12703 | 3 |
| B | 0 | 12147 | 2 |
| C | 0 | 11760 | 2 |
| D | 0 | 36260 | 2 |
| Mode SS | |||
|---|---|---|---|
| Quadrant | BADHDUFLAG | Total packets | Discarded packets |
| A | 0 | 118 | 0 |
| B | 0 | 118 | 0 |
| C | 0 | 118 | 0 |
| D | 0 | 118 | 0 |
| Quadrant | Total seconds | Saturated seconds | Saturation percentage |
|---|---|---|---|
| A | 5797 | 25 | 0.431258% |
| B | 5797 | 56 | 0.966017% |
| C | 5797 | 8 | 0.138002% |
| D | 5797 | 3070 | 52.958427% |
Noise dominated data is calculated using 1-second bins in cleaned event files. If a bin has >2000 counts, and if more than 50% of those come from <1% of pixels, then it is considered to be noise-dominated and hence unusable.
| Quadrant | # 1 sec bins | Bins with >0 counts | Bins with >2000 counts | High rate bins dominated by noise | Noise dominated (total time) | Noise dominated (detector-on time) | Marked lightcurve |
|---|---|---|---|---|---|---|---|
| A | 7170 | 5798 | 12 | 12 | 0.17% | 0.21% | 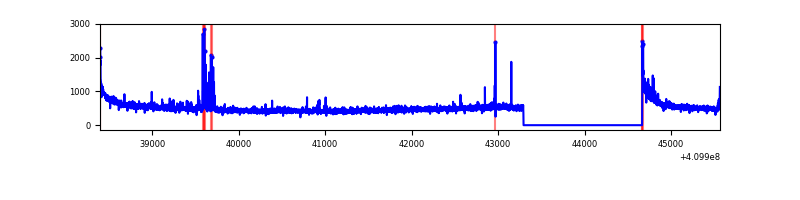 |
| B | 7170 | 5798 | 33 | 33 | 0.46% | 0.57% | 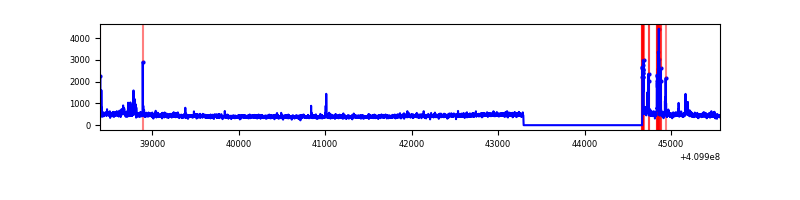 |
| C | 7170 | 5798 | 4 | 4 | 0.06% | 0.07% | 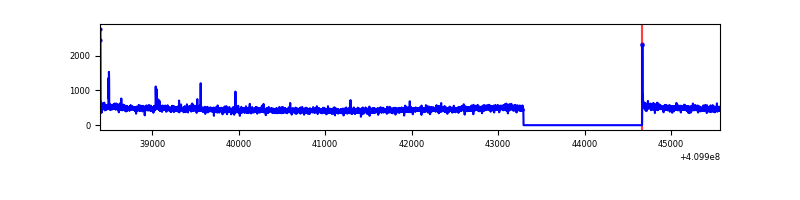 |
| D | 7170 | 5798 | 2636 | 2636 | 36.76% | 45.46% | 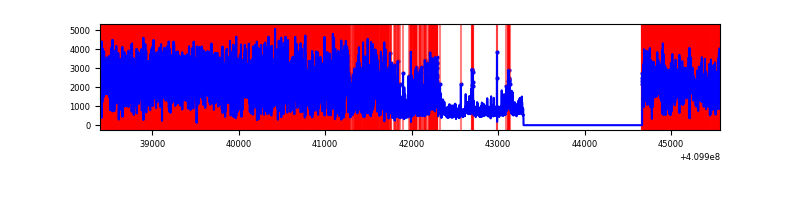 |
Top three noisy pixels from each quadrant. If the there are fewer than three noisy pixels in the level2.evt file, extra rows are filled as -1
| Pixel properties | Quadrant properties | ||||||
|---|---|---|---|---|---|---|---|
| Quadrant | DetID | PixID | Counts | Sigma | Mean | Median | Sigma |
| A | 10 | 83 | 465247 | 3604.12 | 630 | 619 | 128.9 |
| A | 13 | 248 | 84951 | 654.16 | 630 | 619 | 128.9 |
| A | 9 | 143 | 28057 | 212.84 | 630 | 619 | 128.9 |
| B | 5 | 172 | 159058 | 1310.63 | 624 | 607 | 120.9 |
| B | 0 | 190 | 25290 | 204.17 | 624 | 607 | 120.9 |
| B | 12 | 111 | 14947 | 118.61 | 624 | 607 | 120.9 |
| C | 15 | 214 | 243692 | 1699.78 | 612 | 615 | 143.0 |
| C | 3 | 233 | 33068 | 226.94 | 612 | 615 | 143.0 |
| C | 0 | 10 | 15743 | 105.79 | 612 | 615 | 143.0 |
| D | 12 | 235 | 8532627 | 72591.96 | 477 | 463 | 117.5 |
| D | 1 | 47 | 152021 | 1289.46 | 477 | 463 | 117.5 |
| D | 5 | 222 | 118909 | 1007.74 | 477 | 463 | 117.5 |
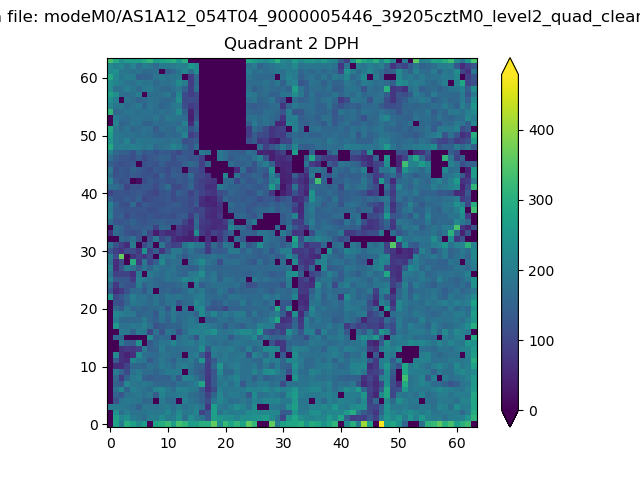
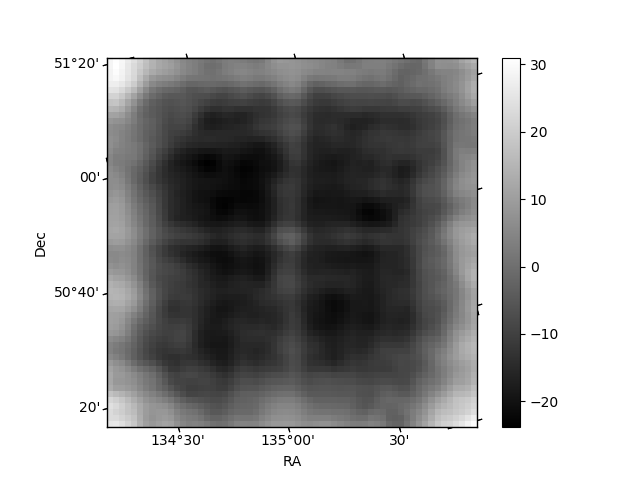
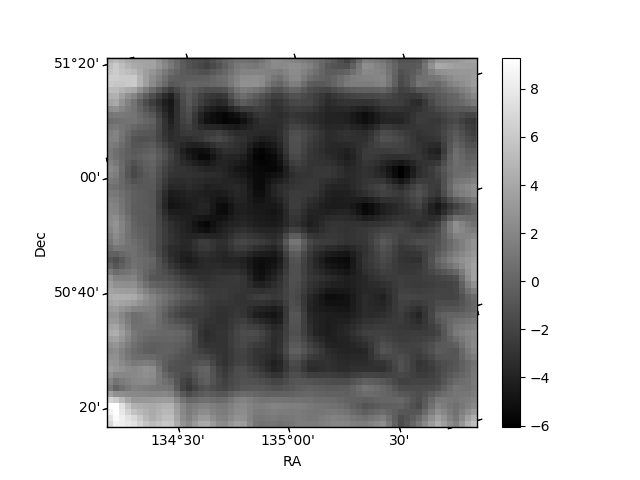
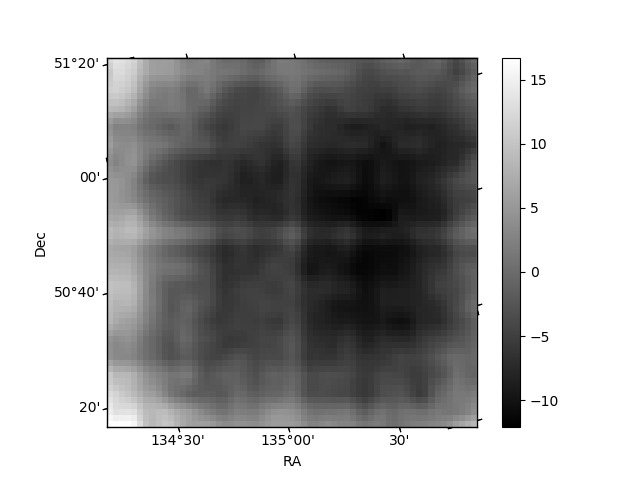
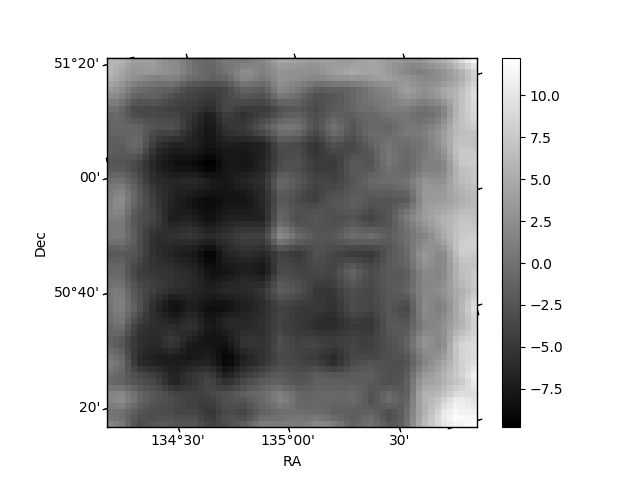
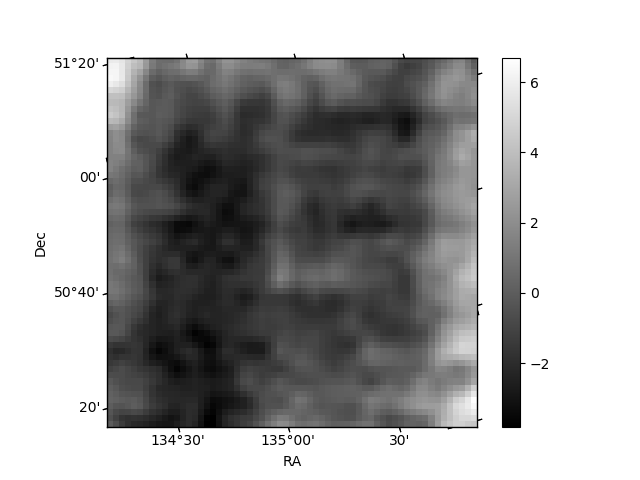
Histogram calculated using DETX and DETY for each event in the final _common_clean file
| Quadrant A | 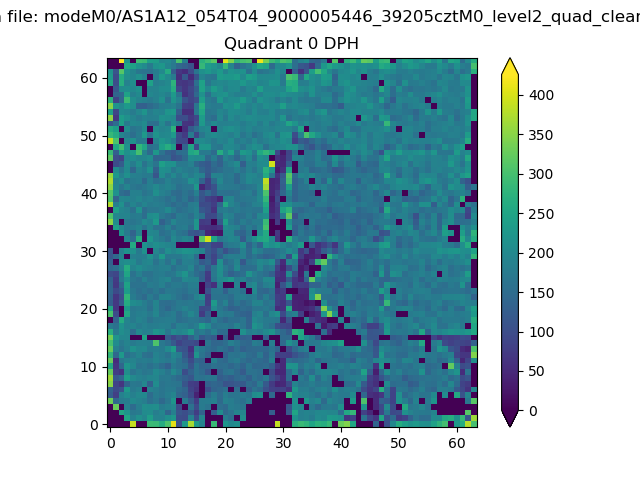 |
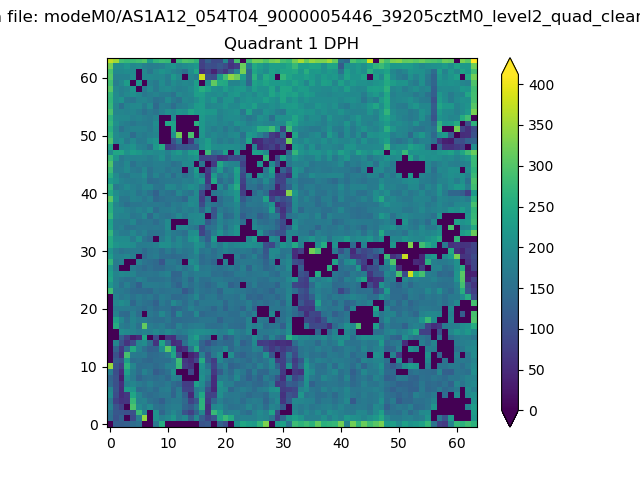 |
Quadrant B |
|---|---|---|---|
| Quadrant D | 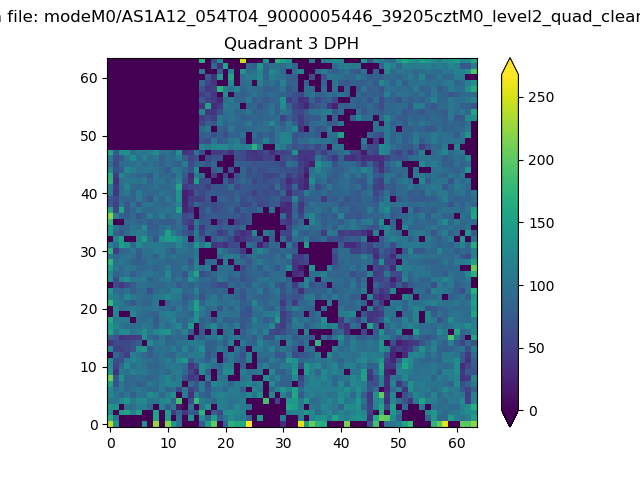 |
 |
Quadrant C |
| Plot type | Count rate plots | Images |
|---|---|---|
| Comparison with Poisson distribution Blue bars denote a histogram of data divided into 1 sec bins. Red curve is a Poisson curve with rate = median count rate of data. |
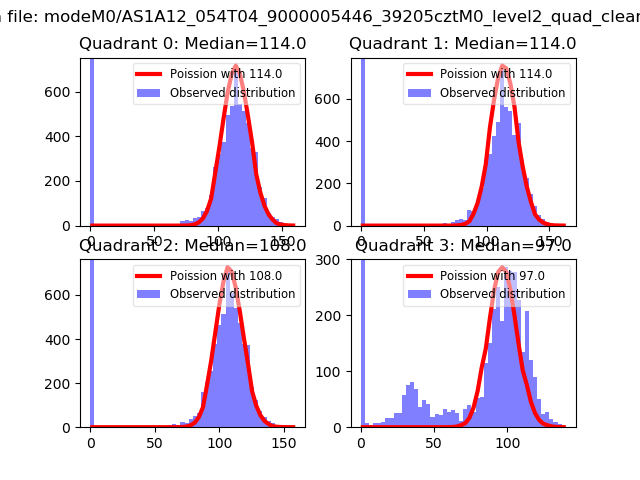 |
 |
| Quadrant-wise count rates Data is divided into 100 sec bins |
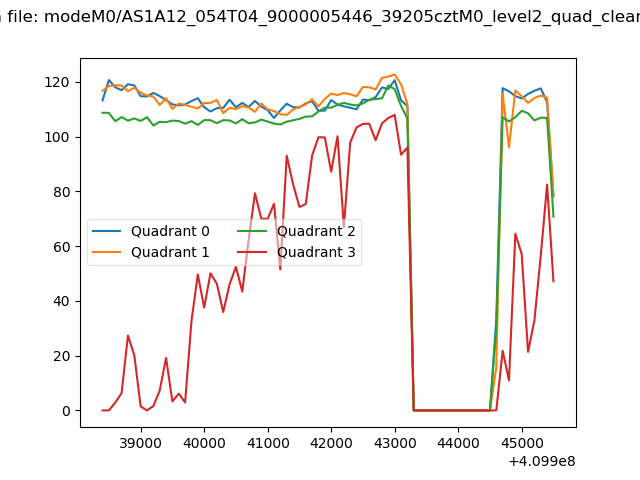 |
|
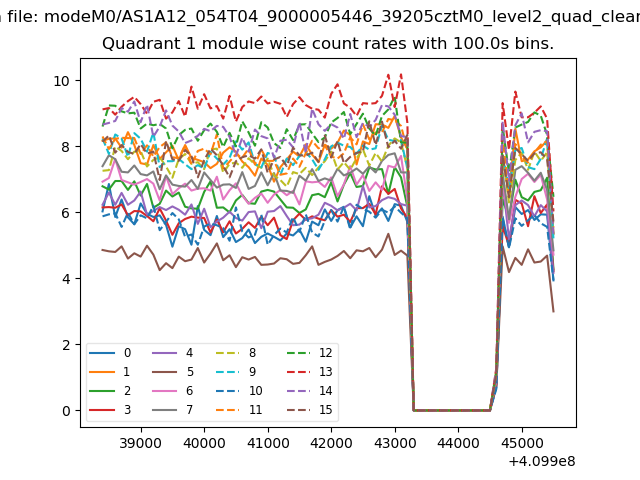
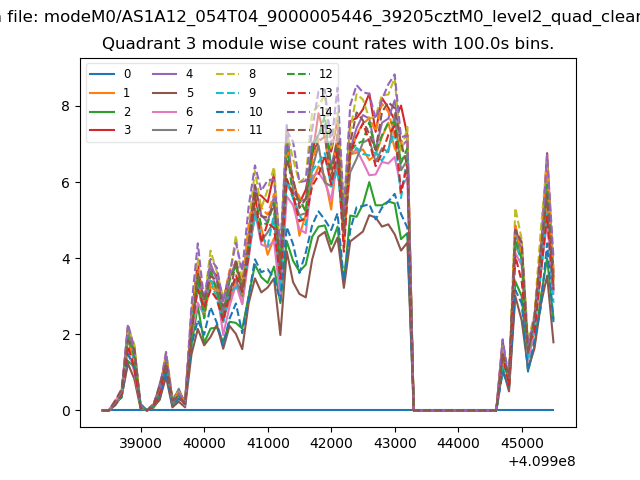
| Module-wise count rates for Quadrant A Data is divided into 100 sec bins |
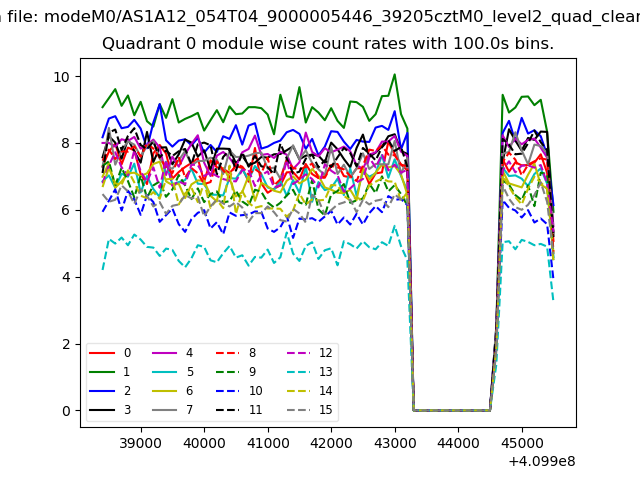 |
 |
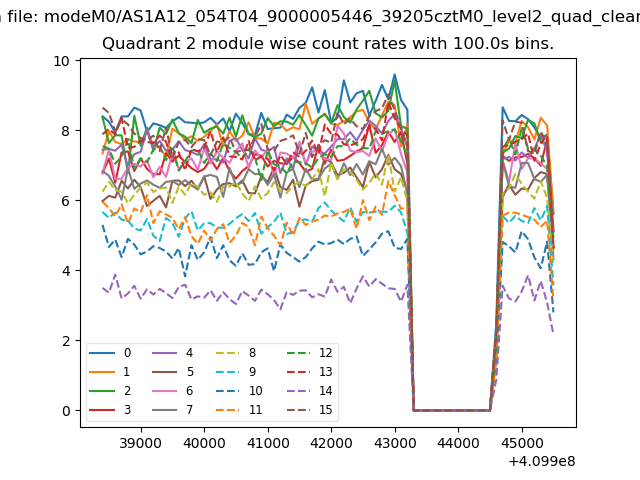
| Module-wise count rates for Quadrant B Data is divided into 100 sec bins |
 |
 |
| Module-wise count rates for Quadrant C Data is divided into 100 sec bins |
 |
 |
| Module-wise count rates for Quadrant D Data is divided into 100 sec bins |
 |
 |
| Parameter | Plot |
|---|---|
| CZT HV Monitor | 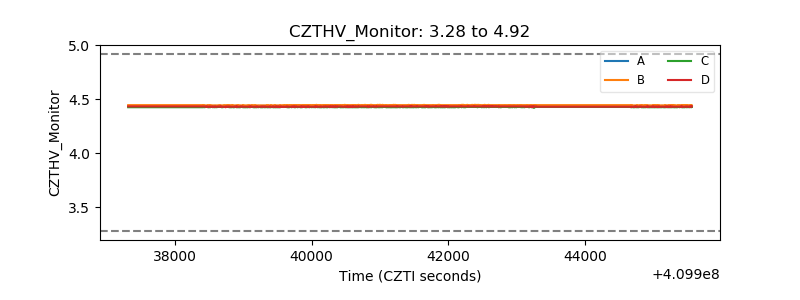 |
| D_VDD | 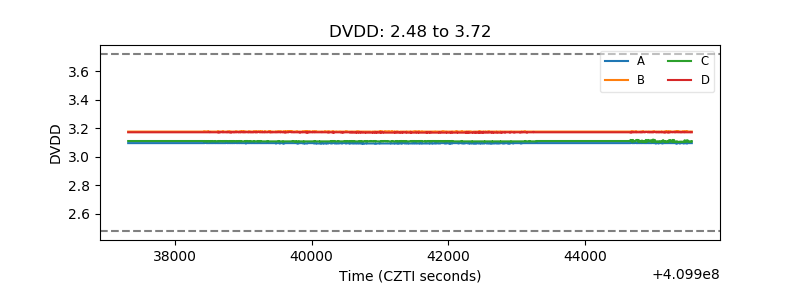 |
| Temperature 1 | 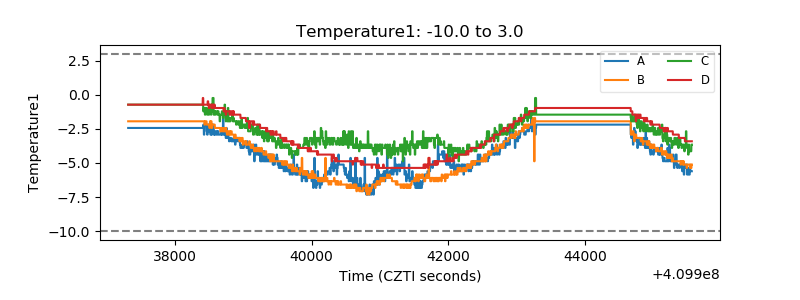 |
| Veto HV Monitor | 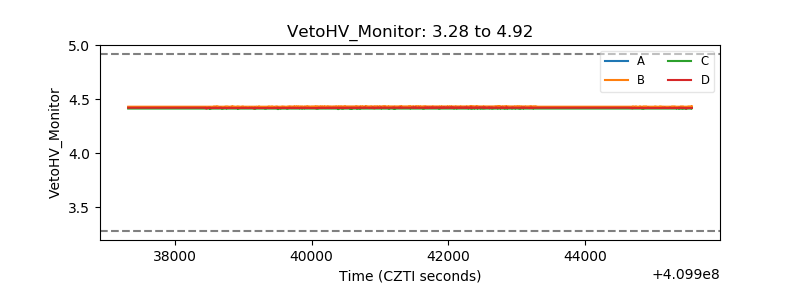 |
| Veto LLD | 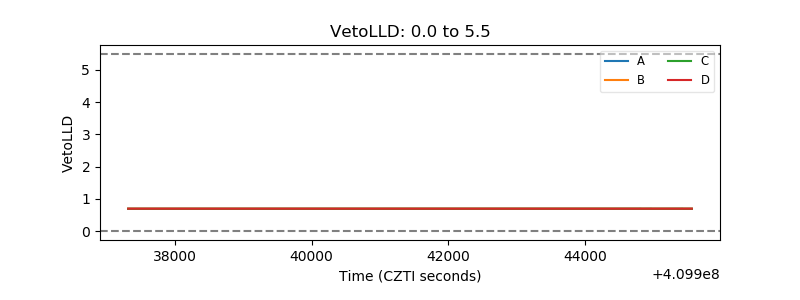 |
| Alpha Counter | 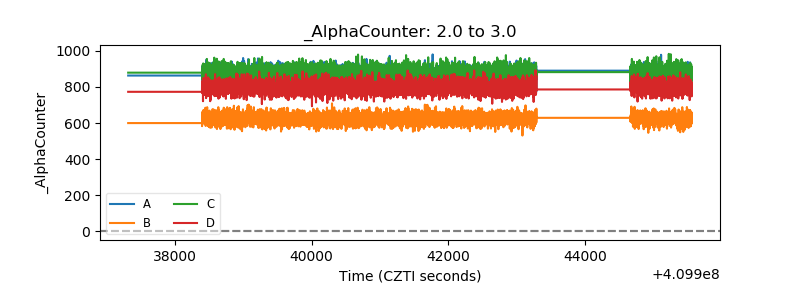 |
| _CPM_Rate | 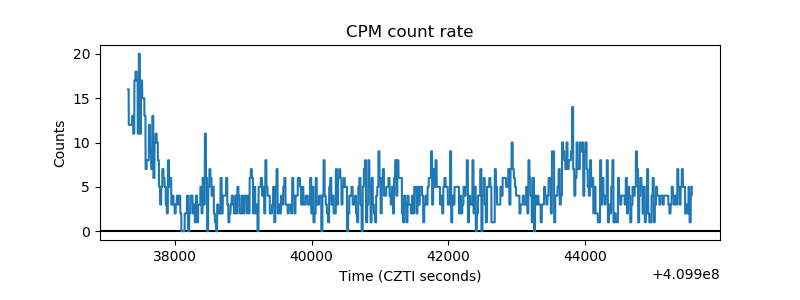 |
| CZT Counter | 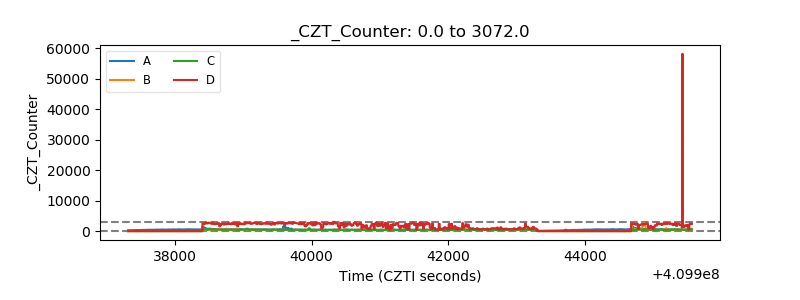 |
| +2.5 Volts monitor | 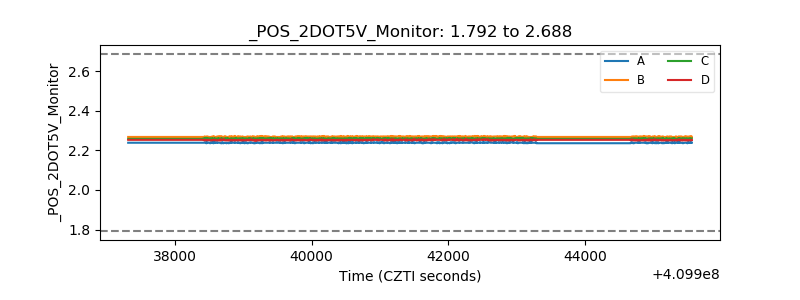 |
| +5 Volts monitor | 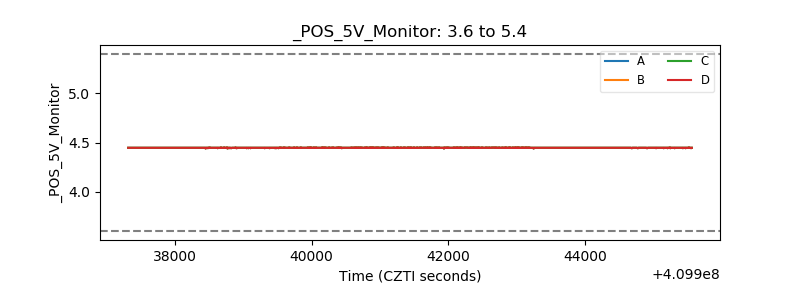 |
| _ROLL_ROT | 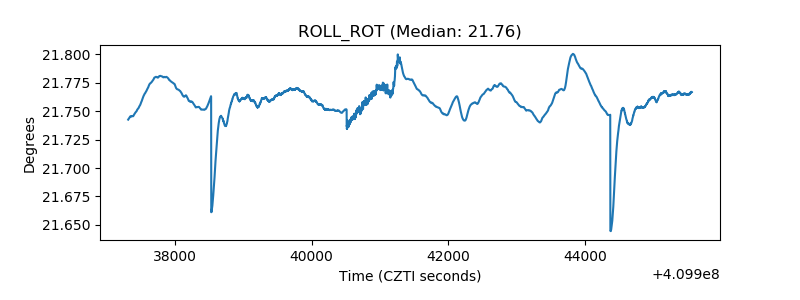 |
| _Roll_DEC | 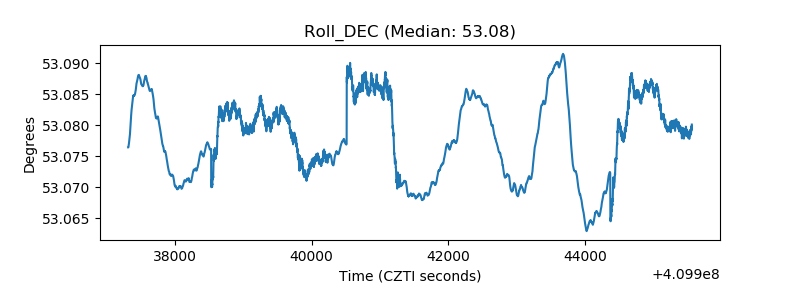 |
| _Roll_RA | 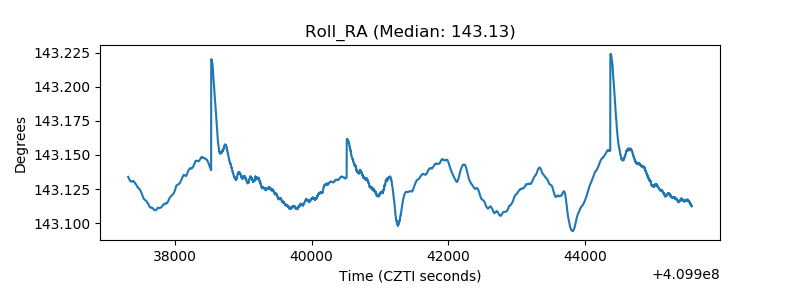 |
| Veto Counter | 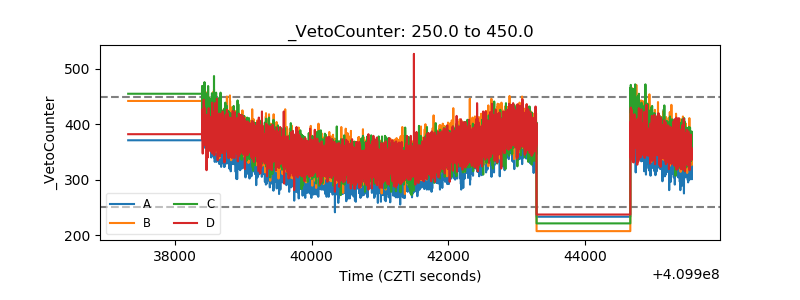 |