| Param | Original file | Final file |
|---|---|---|
| Filename | modeM0/AS1A12_054T04_9000005446_39206cztM0_level2.fits | modeM0/AS1A12_054T04_9000005446_39206cztM0_level2_quad_clean.evt |
| Size (bytes) | 527,126,400 | 98,723,520 |
| Size | 502.7 MB | 94.2 MB |
| Events in quadrant A | 3,373,660 | 705,664 |
| Events in quadrant B | 2,904,821 | 710,002 |
| Events in quadrant C | 2,914,857 | 679,084 |
| Events in quadrant D | 9,828,958 | 454,484 |
| Mode M9 | |||
|---|---|---|---|
| Quadrant | BADHDUFLAG | Total packets | Discarded packets |
| A | 0 | 27 | 0 |
| B | 0 | 27 | 0 |
| C | 0 | 27 | 0 |
| D | 0 | 27 | 0 |
| Mode M0 | |||
|---|---|---|---|
| Quadrant | BADHDUFLAG | Total packets | Discarded packets |
| A | 0 | 14056 | 3 |
| B | 0 | 13156 | 2 |
| C | 0 | 12781 | 2 |
| D | 0 | 33573 | 2 |
| Mode SS | |||
|---|---|---|---|
| Quadrant | BADHDUFLAG | Total packets | Discarded packets |
| A | 0 | 128 | 0 |
| B | 0 | 128 | 0 |
| C | 0 | 128 | 0 |
| D | 0 | 128 | 0 |
| Quadrant | Total seconds | Saturated seconds | Saturation percentage |
|---|---|---|---|
| A | 6308 | 64 | 1.014585% |
| B | 6308 | 55 | 0.871909% |
| C | 6308 | 8 | 0.126823% |
| D | 6308 | 2187 | 34.670260% |
Noise dominated data is calculated using 1-second bins in cleaned event files. If a bin has >2000 counts, and if more than 50% of those come from <1% of pixels, then it is considered to be noise-dominated and hence unusable.
| Quadrant | # 1 sec bins | Bins with >0 counts | Bins with >2000 counts | High rate bins dominated by noise | Noise dominated (total time) | Noise dominated (detector-on time) | Marked lightcurve |
|---|---|---|---|---|---|---|---|
| A | 8964 | 6310 | 36 | 36 | 0.40% | 0.57% | 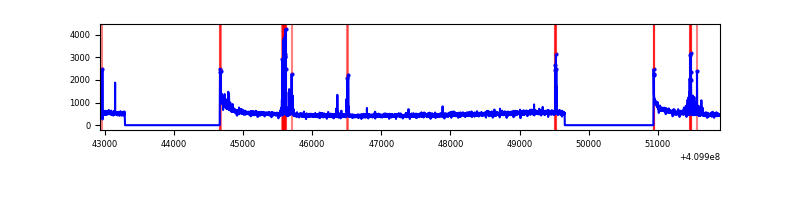 |
| B | 8964 | 6310 | 31 | 31 | 0.35% | 0.49% | 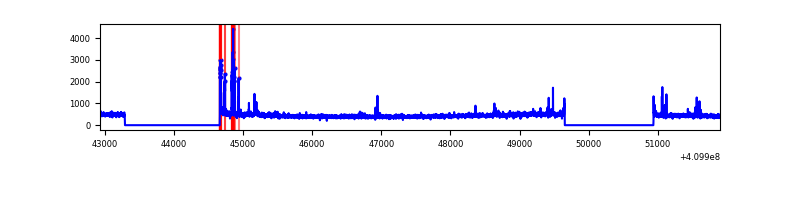 |
| C | 8964 | 6310 | 5 | 5 | 0.06% | 0.08% | 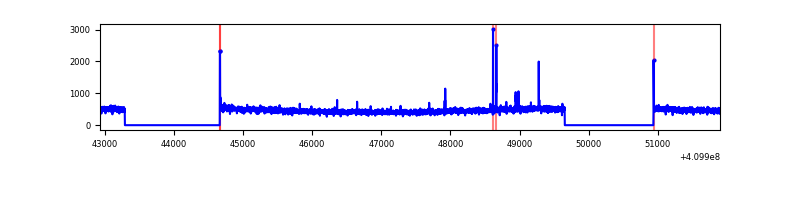 |
| D | 8964 | 6310 | 1850 | 1850 | 20.64% | 29.32% | 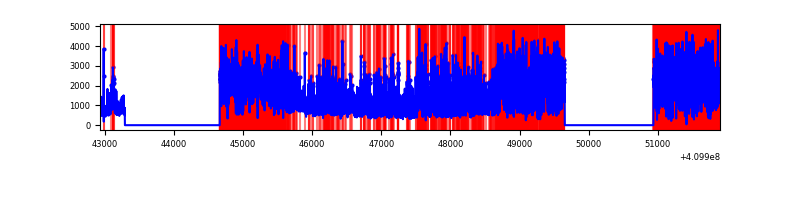 |
Top three noisy pixels from each quadrant. If the there are fewer than three noisy pixels in the level2.evt file, extra rows are filled as -1
| Pixel properties | Quadrant properties | ||||||
|---|---|---|---|---|---|---|---|
| Quadrant | DetID | PixID | Counts | Sigma | Mean | Median | Sigma |
| A | 10 | 83 | 488268 | 3472.66 | 687 | 674 | 140.4 |
| A | 13 | 248 | 191256 | 1357.33 | 687 | 674 | 140.4 |
| A | 9 | 143 | 30244 | 210.6 | 687 | 674 | 140.4 |
| B | 5 | 172 | 158006 | 1198.67 | 681 | 661 | 131.3 |
| B | 0 | 190 | 47254 | 354.95 | 681 | 661 | 131.3 |
| B | 12 | 111 | 16639 | 121.72 | 681 | 661 | 131.3 |
| C | 15 | 214 | 261927 | 1662.88 | 668 | 671 | 157.1 |
| C | 4 | 0 | 22475 | 138.78 | 668 | 671 | 157.1 |
| C | 0 | 10 | 12527 | 75.46 | 668 | 671 | 157.1 |
| D | 12 | 235 | 6887185 | 47930.39 | 580 | 562 | 143.7 |
| D | 5 | 222 | 225109 | 1562.83 | 580 | 562 | 143.7 |
| D | 2 | 153 | 152299 | 1056.08 | 580 | 562 | 143.7 |
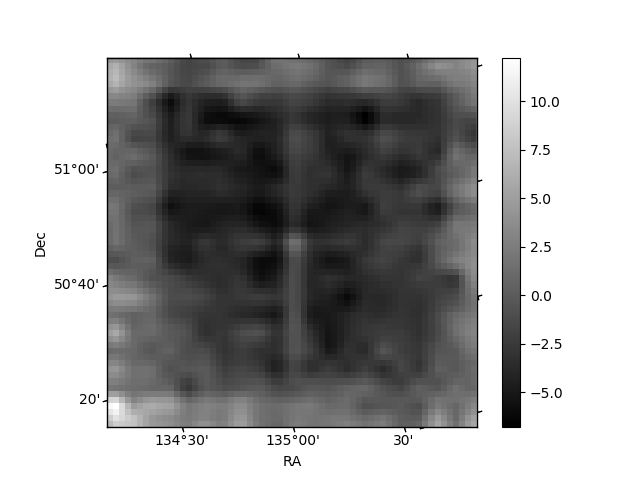
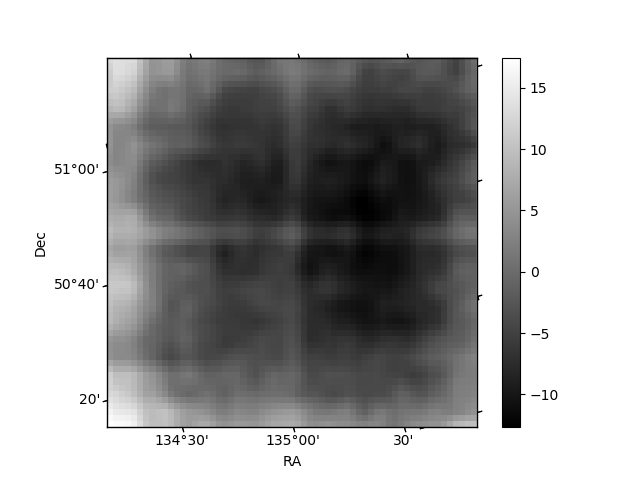
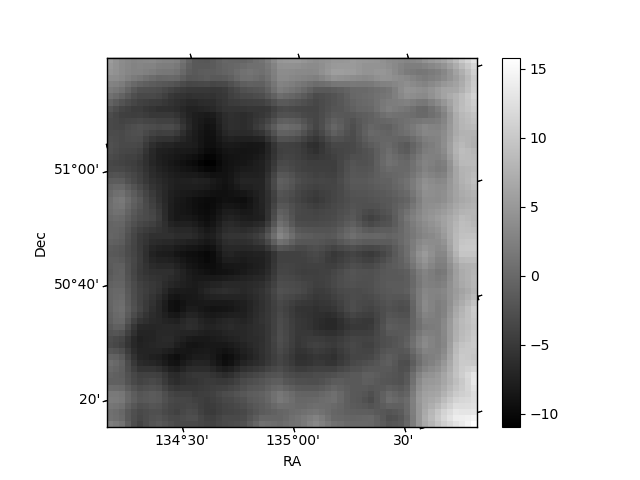
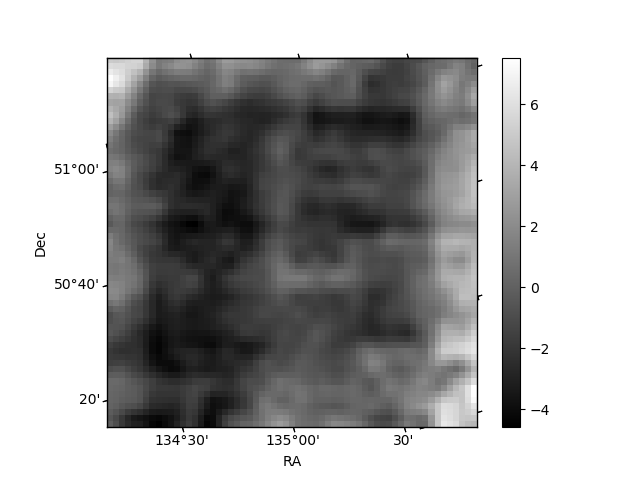
Histogram calculated using DETX and DETY for each event in the final _common_clean file
| Quadrant A | 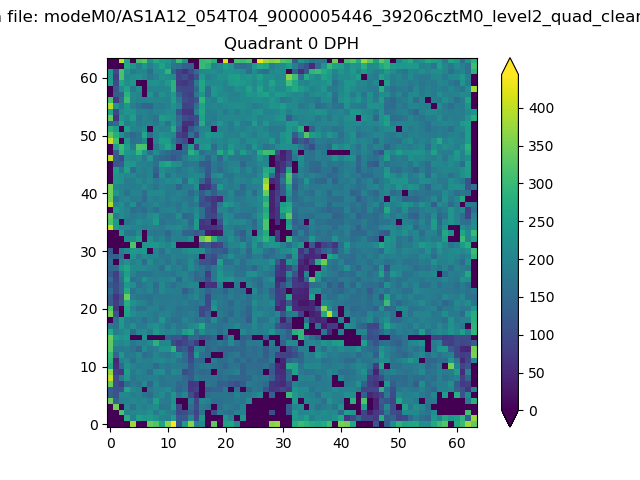 |
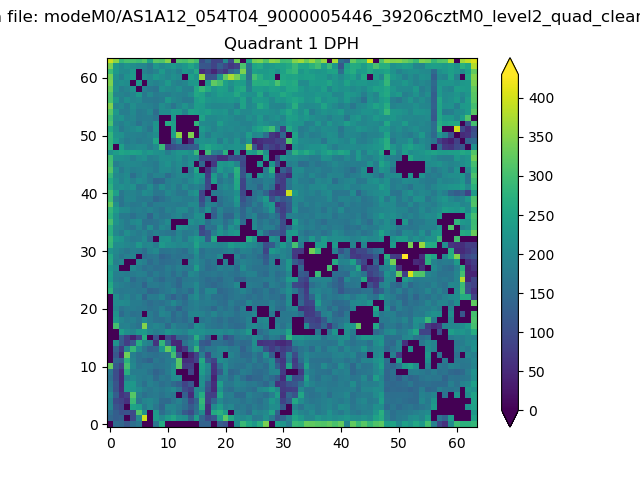 |
Quadrant B |
|---|---|---|---|
| Quadrant D | 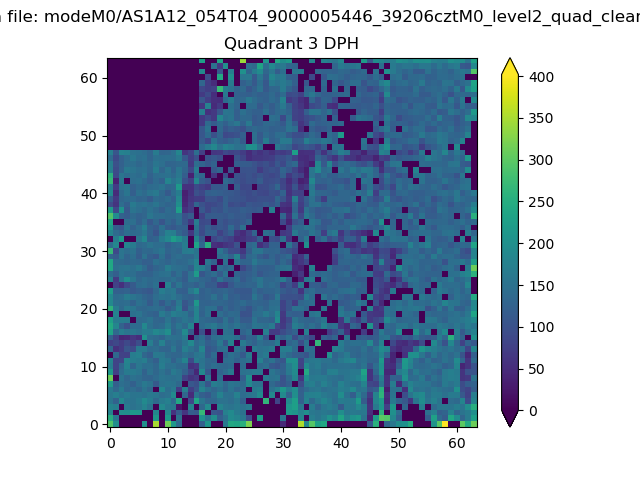 |
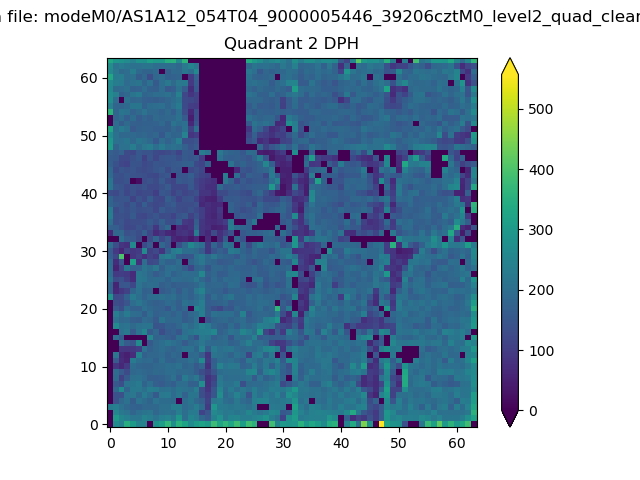 |
Quadrant C |
| Plot type | Count rate plots | Images |
|---|---|---|
| Comparison with Poisson distribution Blue bars denote a histogram of data divided into 1 sec bins. Red curve is a Poisson curve with rate = median count rate of data. |
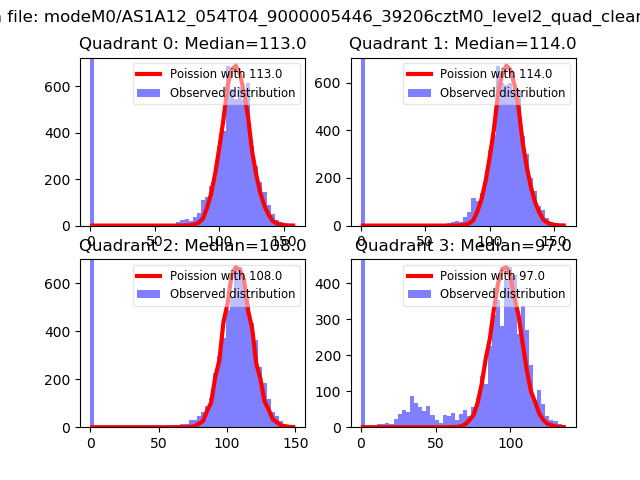 |
 |
| Quadrant-wise count rates Data is divided into 100 sec bins |
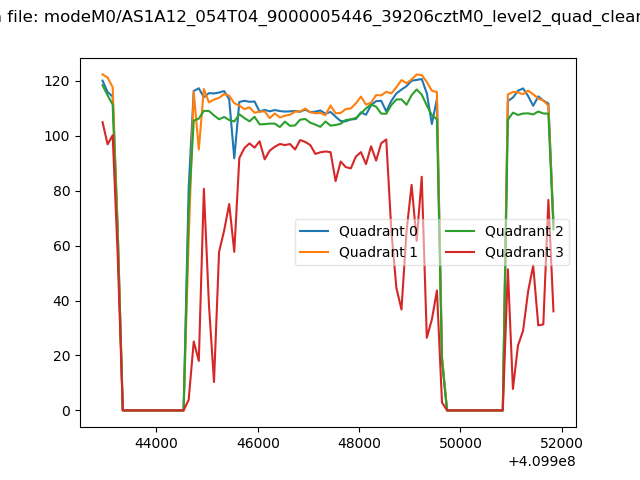 |
|
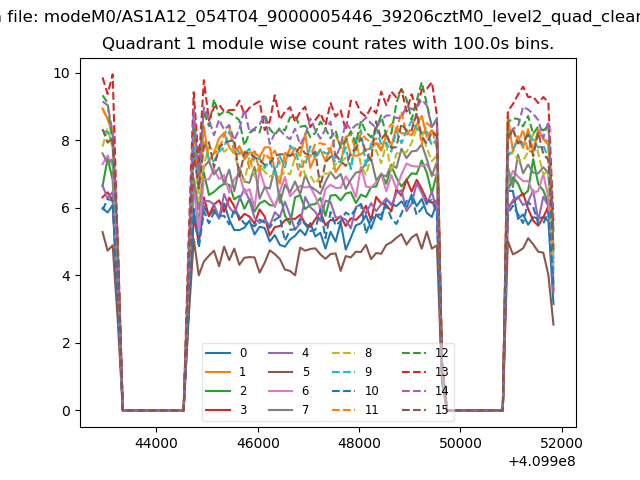
| Module-wise count rates for Quadrant A Data is divided into 100 sec bins |
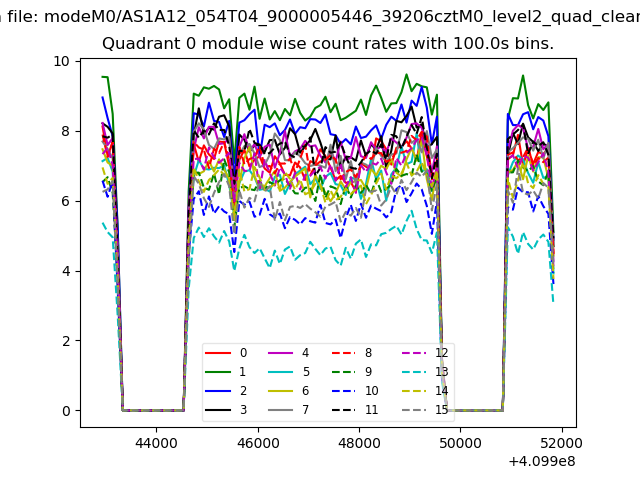 |
 |
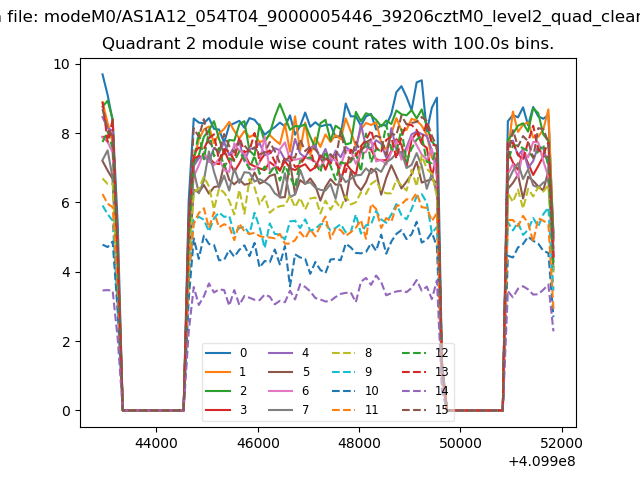
| Module-wise count rates for Quadrant B Data is divided into 100 sec bins |
 |
 |
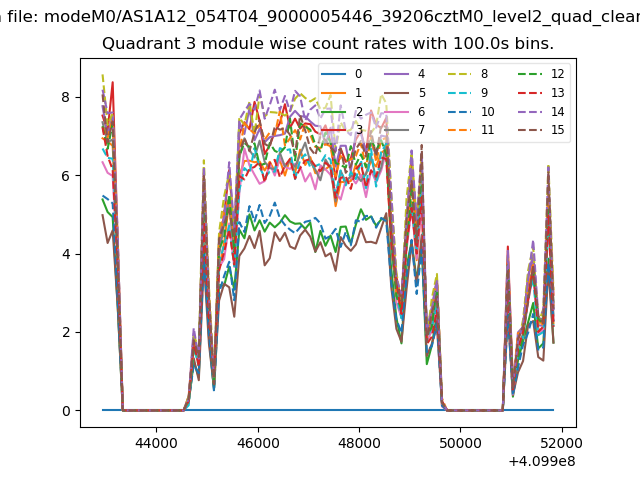
| Module-wise count rates for Quadrant C Data is divided into 100 sec bins |
 |
 |
| Module-wise count rates for Quadrant D Data is divided into 100 sec bins |
 |
 |
| Parameter | Plot |
|---|---|
| CZT HV Monitor | 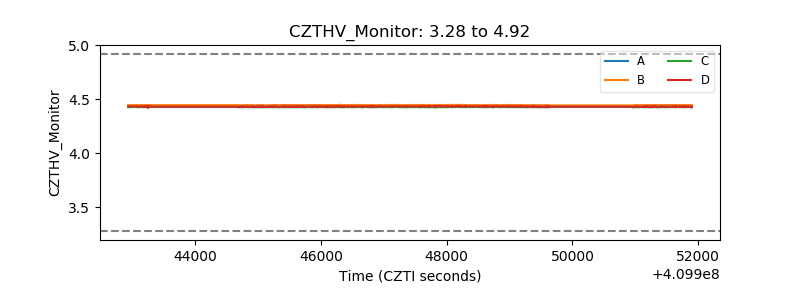 |
| D_VDD | 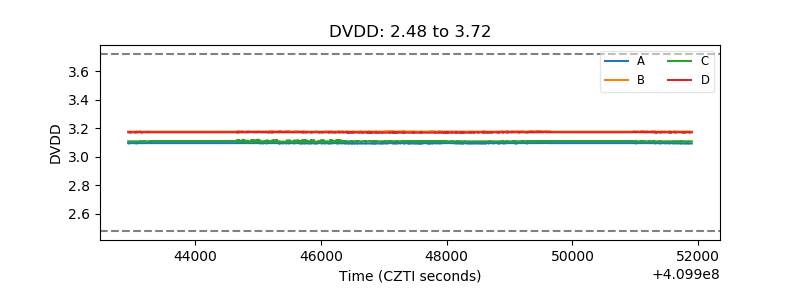 |
| Temperature 1 | 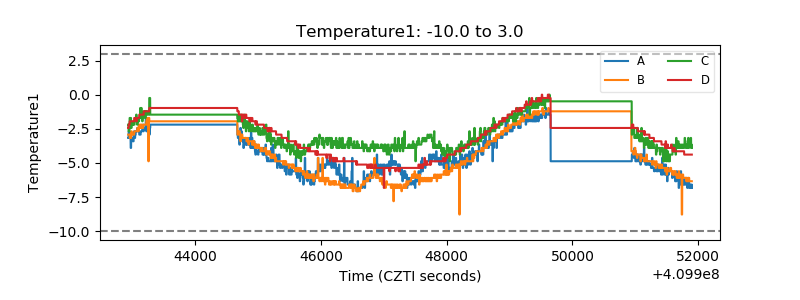 |
| Veto HV Monitor | 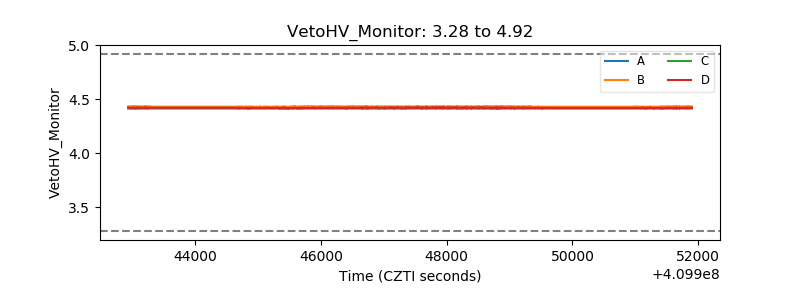 |
| Veto LLD | 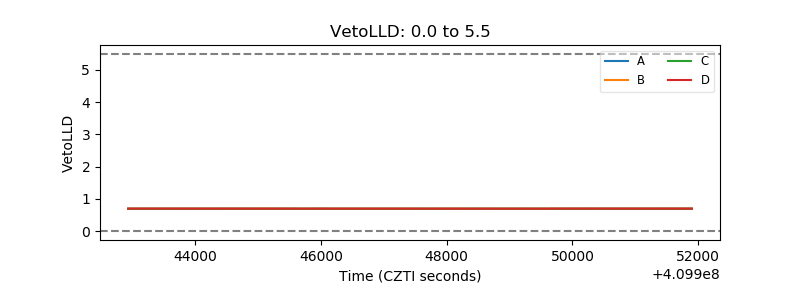 |
| Alpha Counter | 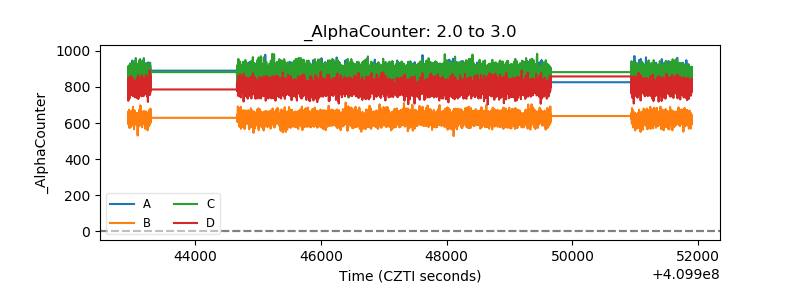 |
| _CPM_Rate | 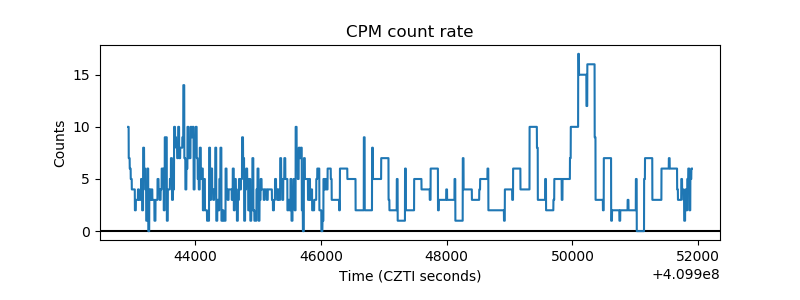 |
| CZT Counter | 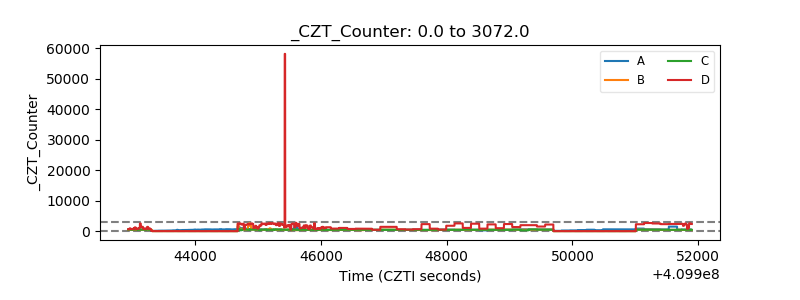 |
| +2.5 Volts monitor | 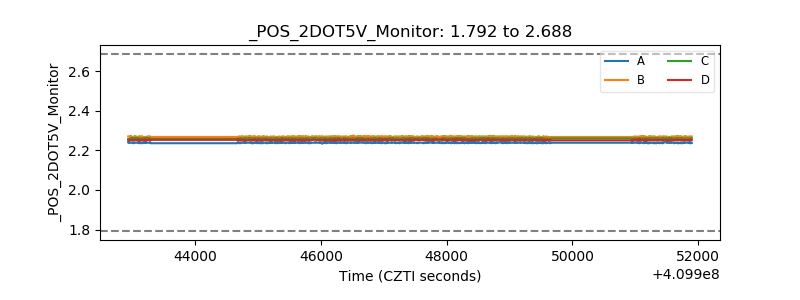 |
| +5 Volts monitor | 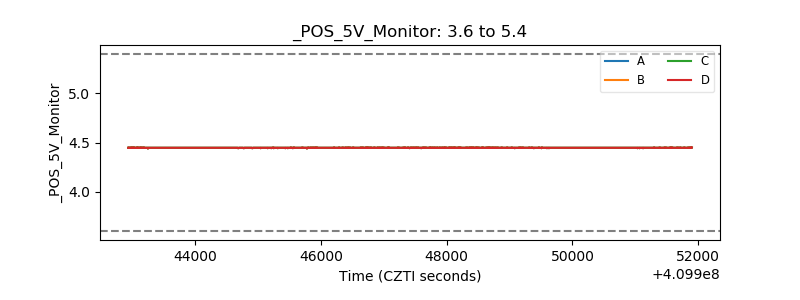 |
| _ROLL_ROT | 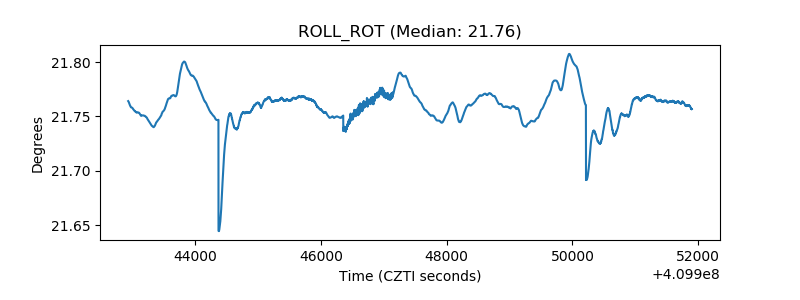 |
| _Roll_DEC | 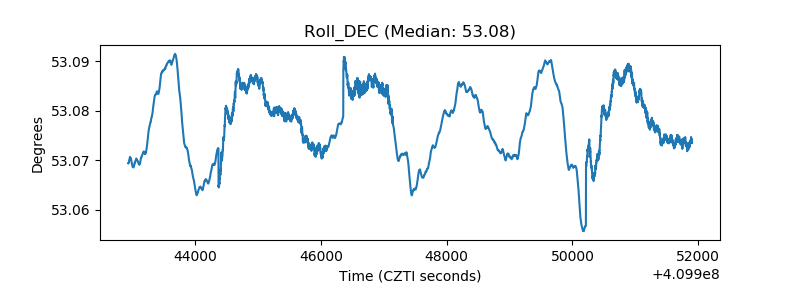 |
| _Roll_RA |  |
| Veto Counter | 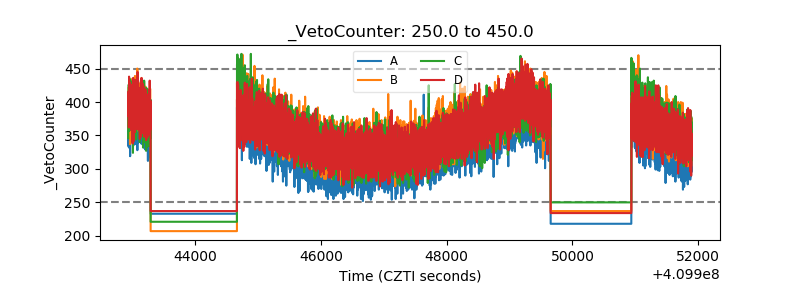 |