| Param | Original file | Final file |
|---|---|---|
| Filename | modeM0/AS1A12_054T04_9000005446_39209cztM0_level2.fits | modeM0/AS1A12_054T04_9000005446_39209cztM0_level2_quad_clean.evt |
| Size (bytes) | 1,184,227,200 | 223,482,240 |
| Size | 1.1 GB | 213.1 MB |
| Events in quadrant A | 7,572,421 | 1,582,340 |
| Events in quadrant B | 6,960,386 | 1,594,688 |
| Events in quadrant C | 6,540,643 | 1,536,207 |
| Events in quadrant D | 21,635,167 | 1,046,619 |
| Mode M9 | |||
|---|---|---|---|
| Quadrant | BADHDUFLAG | Total packets | Discarded packets |
| A | 0 | 40 | 0 |
| B | 0 | 39 | 0 |
| C | 0 | 39 | 0 |
| D | 0 | 40 | 0 |
| Mode M0 | |||
|---|---|---|---|
| Quadrant | BADHDUFLAG | Total packets | Discarded packets |
| A | 0 | 32151 | 3 |
| B | 0 | 31357 | 3 |
| C | 0 | 29340 | 3 |
| D | 0 | 74460 | 3 |
| Mode SS | |||
|---|---|---|---|
| Quadrant | BADHDUFLAG | Total packets | Discarded packets |
| A | 0 | 298 | 0 |
| B | 0 | 298 | 0 |
| C | 0 | 298 | 0 |
| D | 0 | 298 | 0 |
| Quadrant | Total seconds | Saturated seconds | Saturation percentage |
|---|---|---|---|
| A | 14571 | 162 | 1.111797% |
| B | 14571 | 226 | 1.551026% |
| C | 14571 | 9 | 0.061767% |
| D | 14571 | 4558 | 31.281312% |
Noise dominated data is calculated using 1-second bins in cleaned event files. If a bin has >2000 counts, and if more than 50% of those come from <1% of pixels, then it is considered to be noise-dominated and hence unusable.
| Quadrant | # 1 sec bins | Bins with >0 counts | Bins with >2000 counts | High rate bins dominated by noise | Noise dominated (total time) | Noise dominated (detector-on time) | Marked lightcurve |
|---|---|---|---|---|---|---|---|
| A | 17287 | 14573 | 95 | 95 | 0.55% | 0.65% | 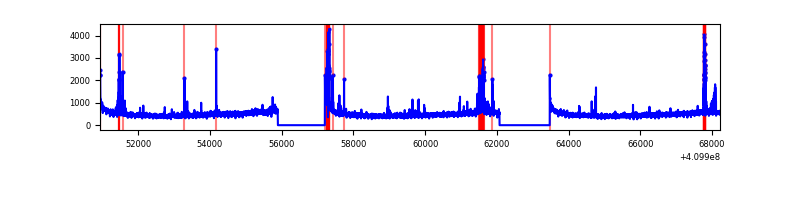 |
| B | 17287 | 14572 | 142 | 142 | 0.82% | 0.97% | 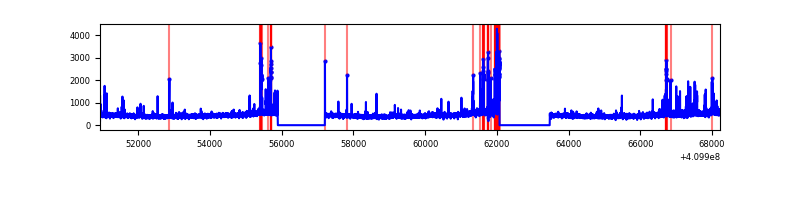 |
| C | 17287 | 14573 | 1 | 1 | 0.01% | 0.01% | 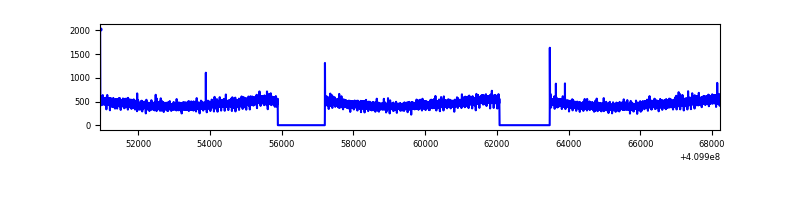 |
| D | 17287 | 14573 | 3909 | 3909 | 22.61% | 26.82% | 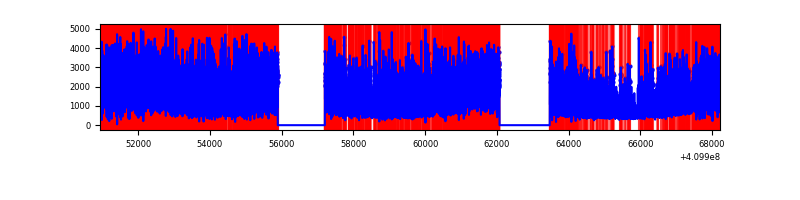 |
Top three noisy pixels from each quadrant. If the there are fewer than three noisy pixels in the level2.evt file, extra rows are filled as -1
| Pixel properties | Quadrant properties | ||||||
|---|---|---|---|---|---|---|---|
| Quadrant | DetID | PixID | Counts | Sigma | Mean | Median | Sigma |
| A | 10 | 83 | 948810 | 2991.95 | 1566 | 1534 | 316.6 |
| A | 13 | 248 | 408525 | 1285.47 | 1566 | 1534 | 316.6 |
| A | 15 | 223 | 82397 | 255.4 | 1566 | 1534 | 316.6 |
| B | 5 | 172 | 591786 | 2006.24 | 1545 | 1503 | 294.2 |
| B | 0 | 221 | 132931 | 446.69 | 1545 | 1503 | 294.2 |
| B | 0 | 190 | 119243 | 400.17 | 1545 | 1503 | 294.2 |
| C | 15 | 214 | 594061 | 1687.28 | 1520 | 1525 | 351.2 |
| C | 0 | 10 | 15304 | 39.24 | 1520 | 1525 | 351.2 |
| C | 13 | 61 | 10415 | 25.31 | 1520 | 1525 | 351.2 |
| D | 12 | 235 | 15345352 | 46962.37 | 1336 | 1295 | 326.7 |
| D | 2 | 249 | 341986 | 1042.73 | 1336 | 1295 | 326.7 |
| D | 5 | 222 | 244858 | 745.45 | 1336 | 1295 | 326.7 |
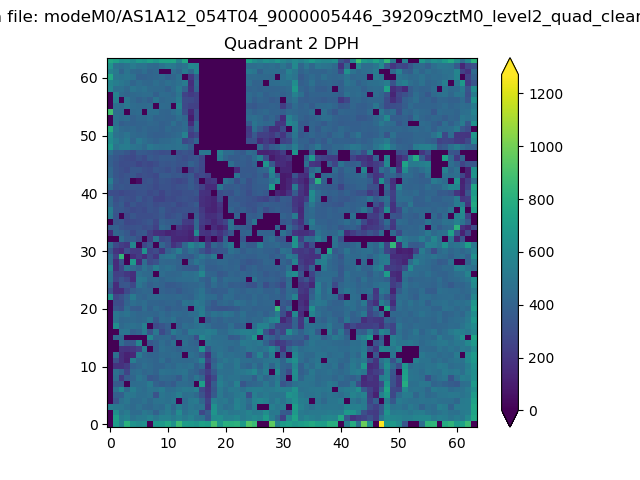
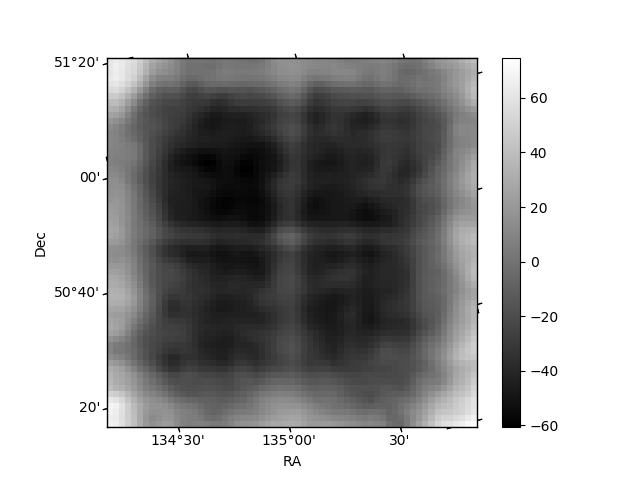
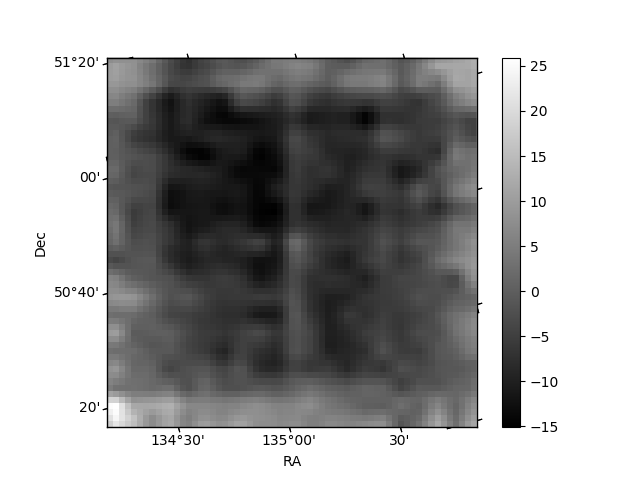
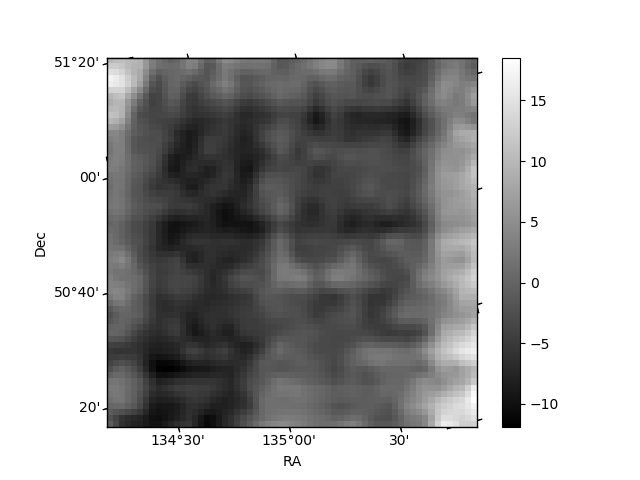
Histogram calculated using DETX and DETY for each event in the final _common_clean file
| Quadrant A | 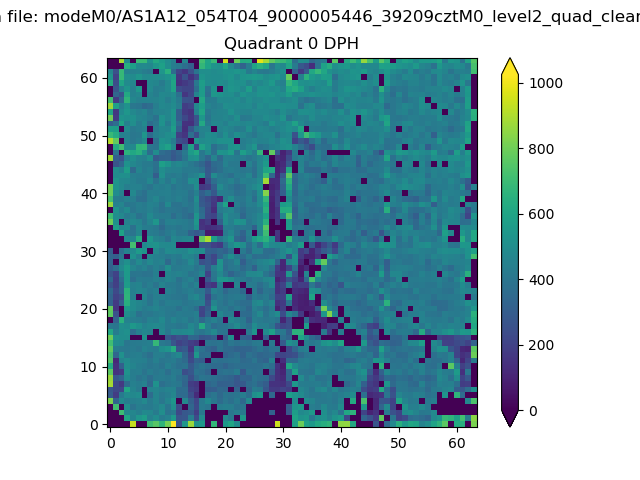 |
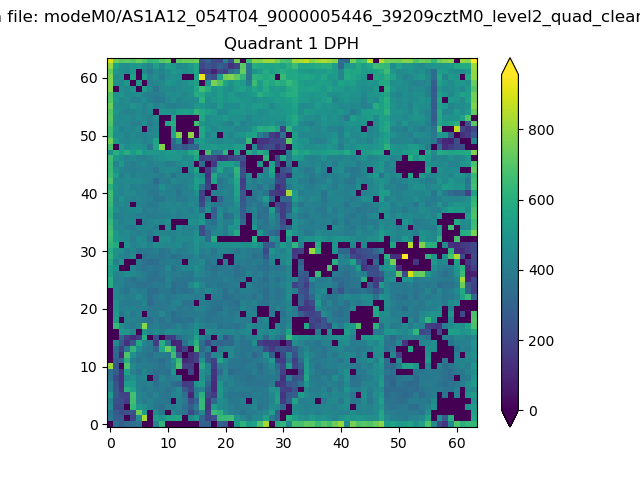 |
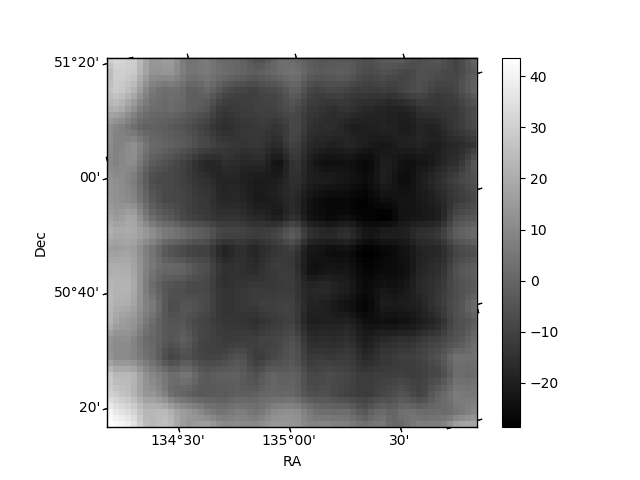
Quadrant B |
|---|---|---|---|
| Quadrant D | 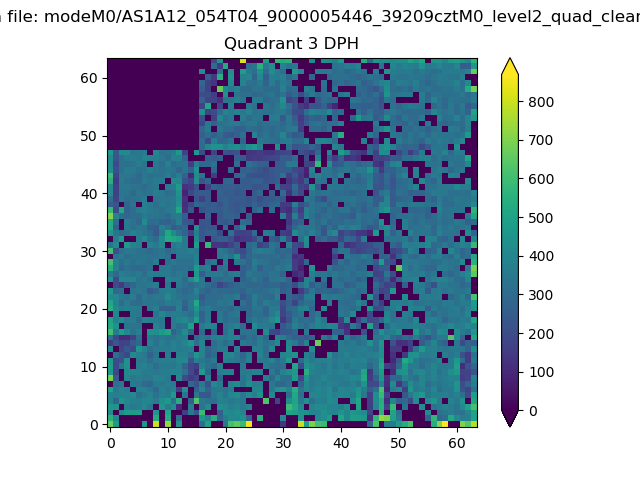 |
 |
Quadrant C |
| Plot type | Count rate plots | Images |
|---|---|---|
| Comparison with Poisson distribution Blue bars denote a histogram of data divided into 1 sec bins. Red curve is a Poisson curve with rate = median count rate of data. |
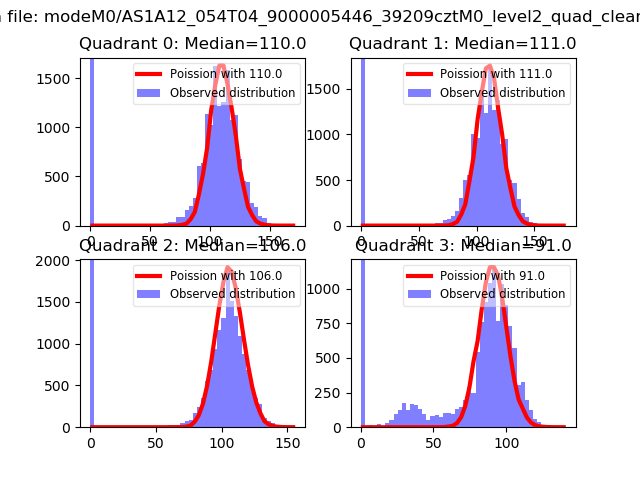 |
 |
| Quadrant-wise count rates Data is divided into 100 sec bins |
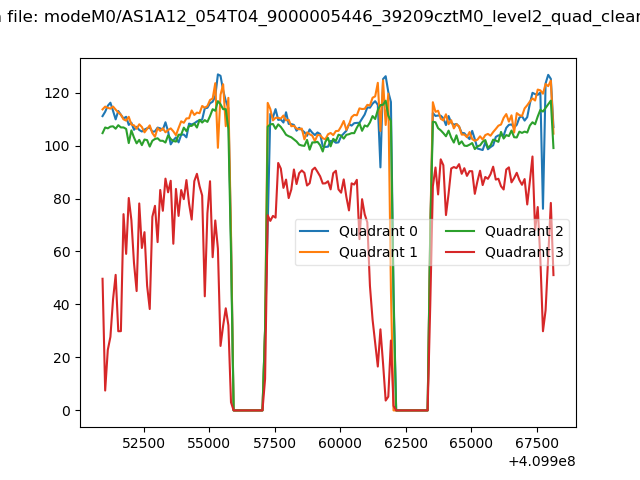 |
|
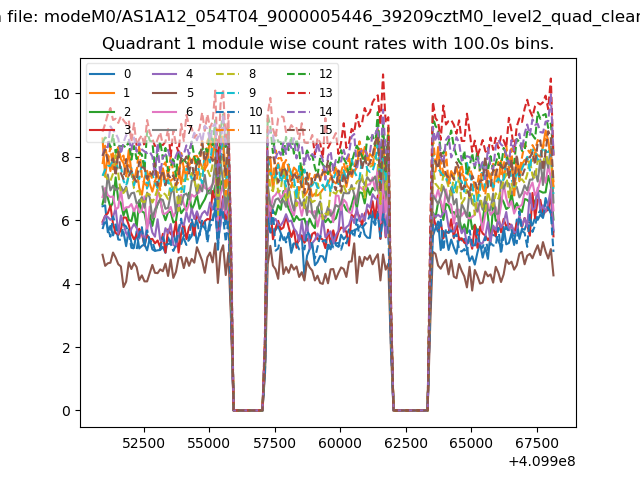
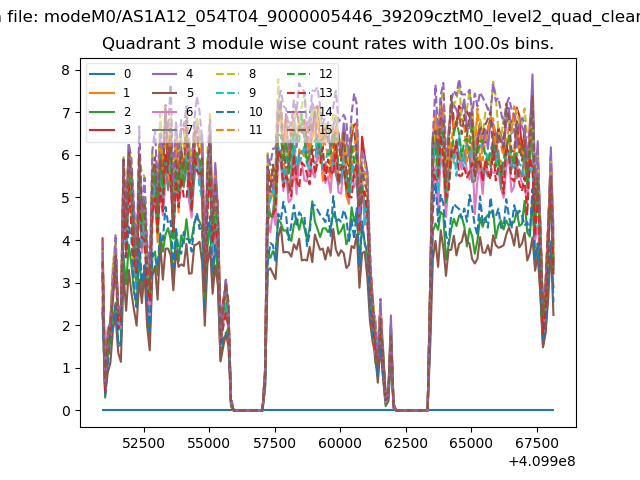
| Module-wise count rates for Quadrant A Data is divided into 100 sec bins |
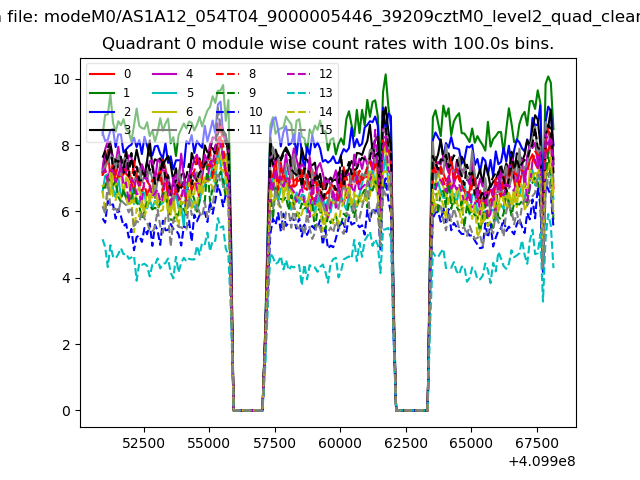 |
 |
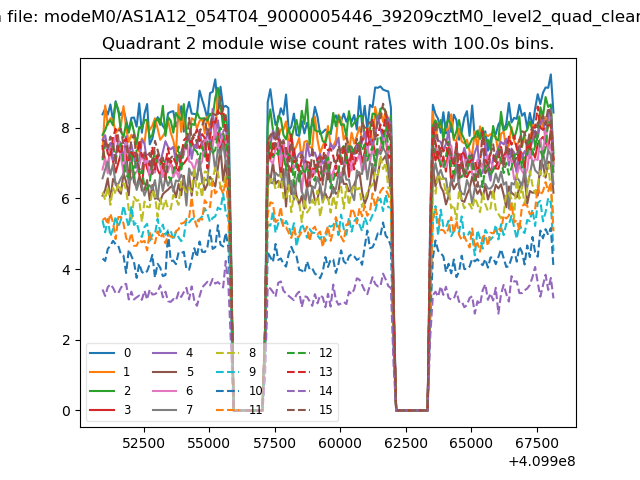
| Module-wise count rates for Quadrant B Data is divided into 100 sec bins |
 |
 |
| Module-wise count rates for Quadrant C Data is divided into 100 sec bins |
 |
 |
| Module-wise count rates for Quadrant D Data is divided into 100 sec bins |
 |
 |
| Parameter | Plot |
|---|---|
| CZT HV Monitor | 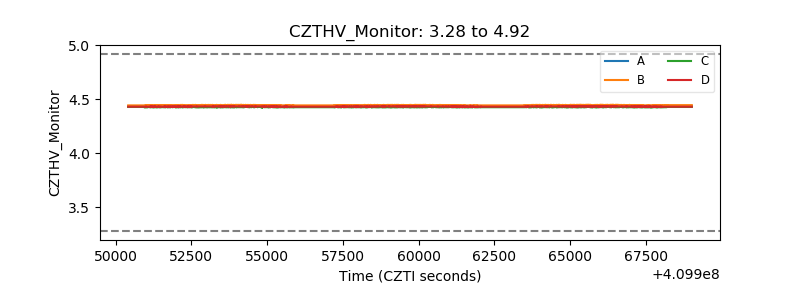 |
| D_VDD | 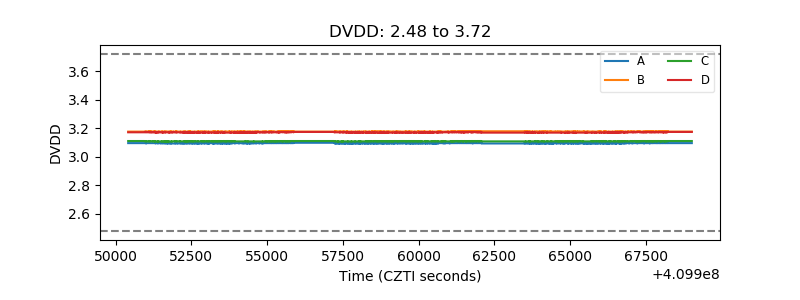 |
| Temperature 1 | 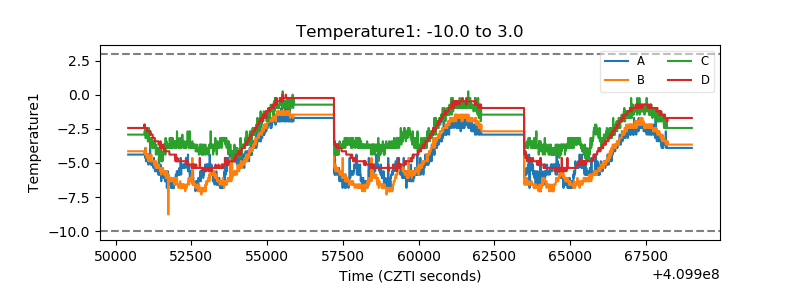 |
| Veto HV Monitor | 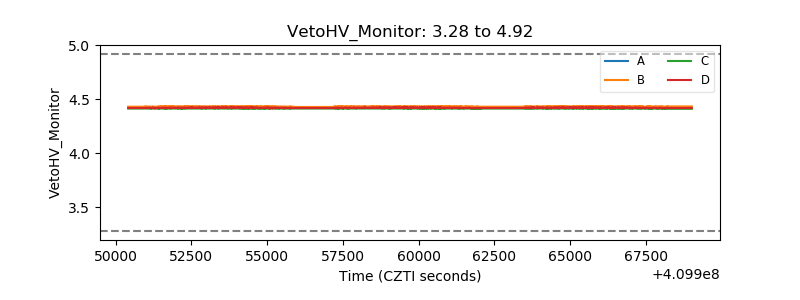 |
| Veto LLD | 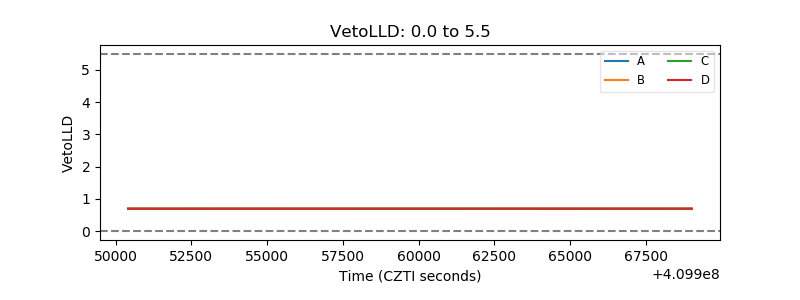 |
| Alpha Counter | 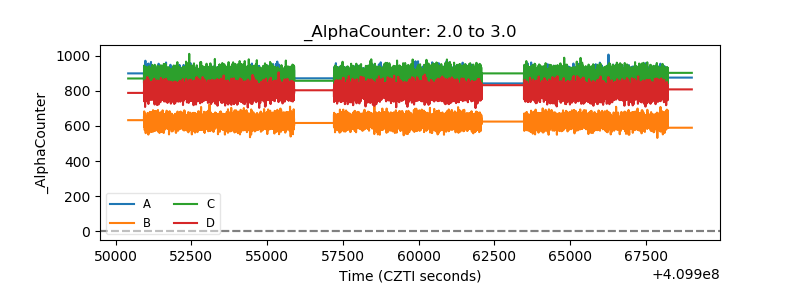 |
| _CPM_Rate | 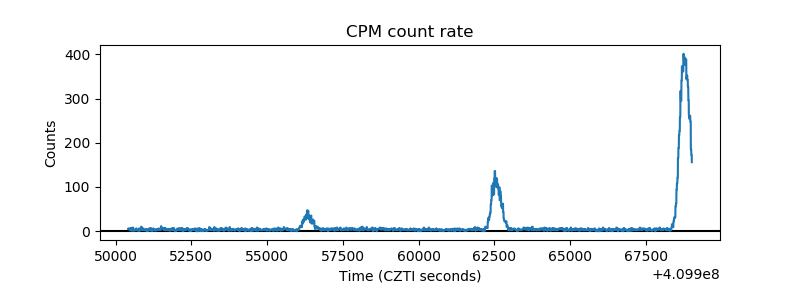 |
| CZT Counter | 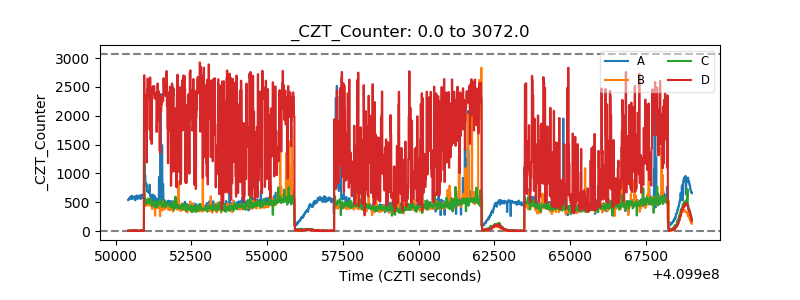 |
| +2.5 Volts monitor | 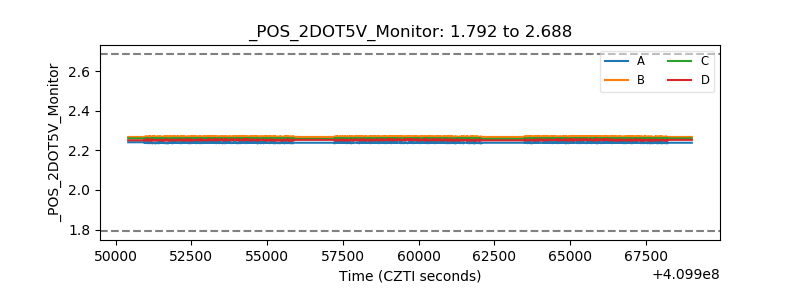 |
| +5 Volts monitor | 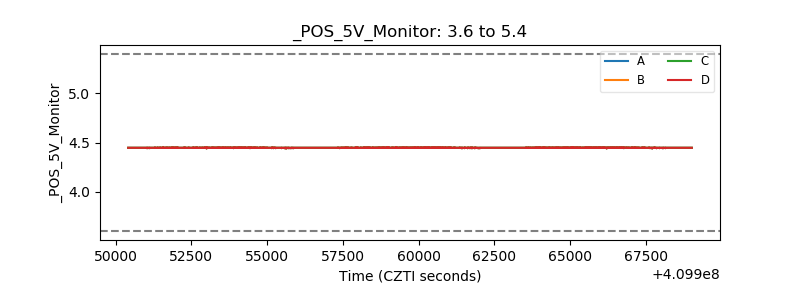 |
| _ROLL_ROT | 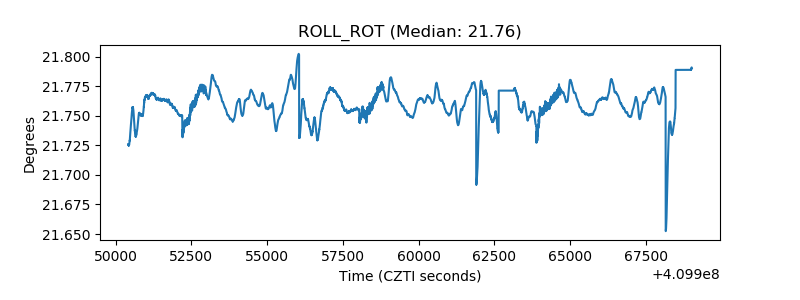 |
| _Roll_DEC | 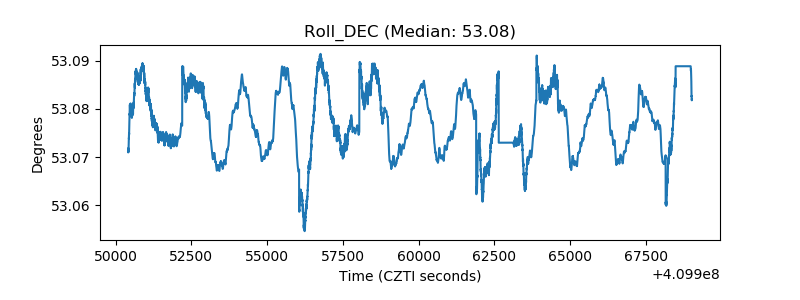 |
| _Roll_RA | 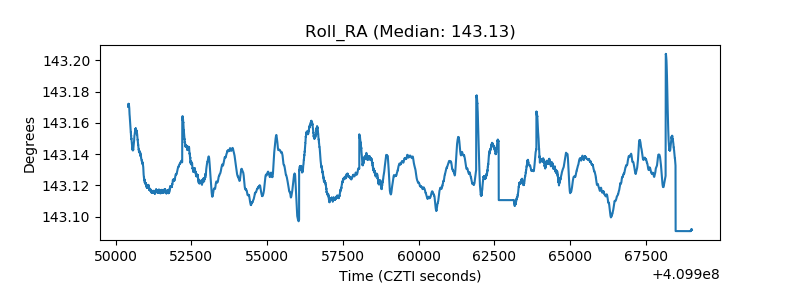 |
| Veto Counter | 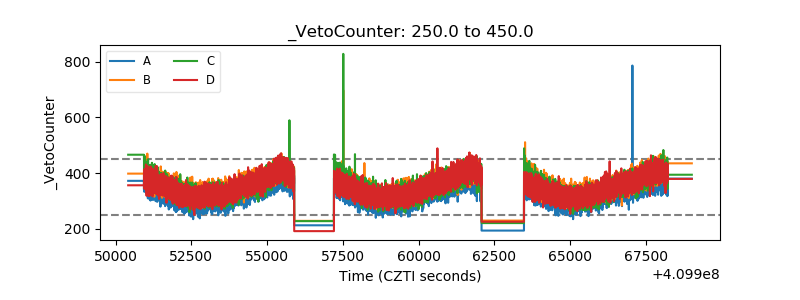 |