| Param | Original file | Final file |
|---|---|---|
| Filename | modeM0/AS1A12_054T04_9000005446_39210cztM0_level2.fits | modeM0/AS1A12_054T04_9000005446_39210cztM0_level2_quad_clean.evt |
| Size (bytes) | 452,139,840 | 88,948,800 |
| Size | 431.2 MB | 84.8 MB |
| Events in quadrant A | 2,791,418 | 630,265 |
| Events in quadrant B | 2,913,760 | 628,924 |
| Events in quadrant C | 2,536,038 | 608,599 |
| Events in quadrant D | 8,057,348 | 431,608 |
| Mode M9 | |||
|---|---|---|---|
| Quadrant | BADHDUFLAG | Total packets | Discarded packets |
| A | 0 | 24 | 0 |
| B | 0 | 24 | 0 |
| C | 0 | 24 | 0 |
| D | 0 | 25 | 0 |
| Mode M0 | |||
|---|---|---|---|
| Quadrant | BADHDUFLAG | Total packets | Discarded packets |
| A | 0 | 11895 | 3 |
| B | 0 | 12568 | 2 |
| C | 0 | 11379 | 2 |
| D | 0 | 27814 | 2 |
| Mode SS | |||
|---|---|---|---|
| Quadrant | BADHDUFLAG | Total packets | Discarded packets |
| A | 0 | 114 | 0 |
| B | 0 | 114 | 0 |
| C | 0 | 114 | 0 |
| D | 0 | 114 | 0 |
| Quadrant | Total seconds | Saturated seconds | Saturation percentage |
|---|---|---|---|
| A | 5631 | 9 | 0.159830% |
| B | 5631 | 124 | 2.202096% |
| C | 5631 | 5 | 0.088794% |
| D | 5631 | 1613 | 28.645001% |
Noise dominated data is calculated using 1-second bins in cleaned event files. If a bin has >2000 counts, and if more than 50% of those come from <1% of pixels, then it is considered to be noise-dominated and hence unusable.
| Quadrant | # 1 sec bins | Bins with >0 counts | Bins with >2000 counts | High rate bins dominated by noise | Noise dominated (total time) | Noise dominated (detector-on time) | Marked lightcurve |
|---|---|---|---|---|---|---|---|
| A | 7274 | 5632 | 3 | 3 | 0.04% | 0.05% | 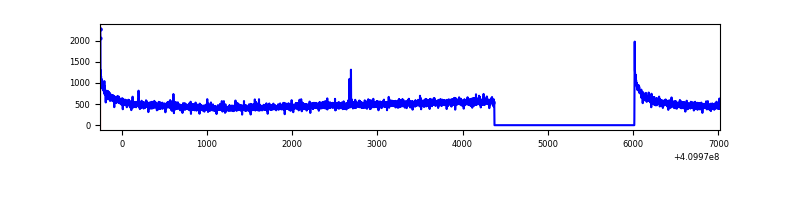 |
| B | 7274 | 5632 | 66 | 66 | 0.91% | 1.17% | 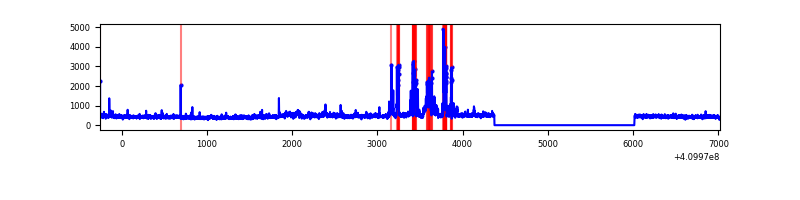 |
| C | 7274 | 5632 | 0 | 0 | 0.00% | 0.00% | 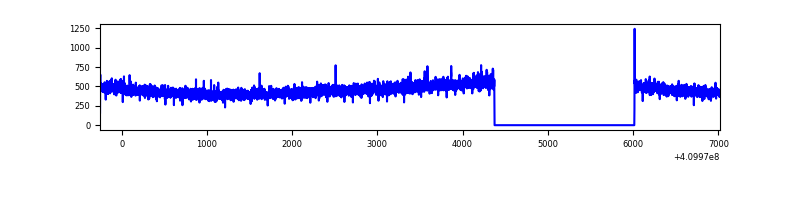 |
| D | 7274 | 5632 | 1409 | 1409 | 19.37% | 25.02% | 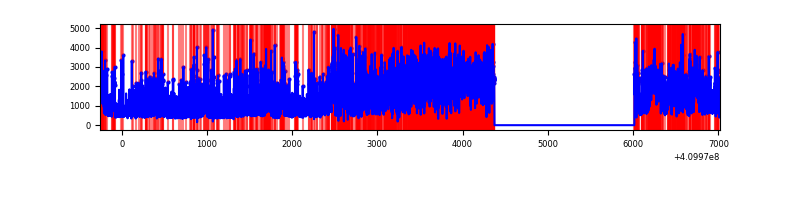 |
Top three noisy pixels from each quadrant. If the there are fewer than three noisy pixels in the level2.evt file, extra rows are filled as -1
| Pixel properties | Quadrant properties | ||||||
|---|---|---|---|---|---|---|---|
| Quadrant | DetID | PixID | Counts | Sigma | Mean | Median | Sigma |
| A | 10 | 83 | 435535 | 3505.88 | 606 | 593 | 124.1 |
| A | 13 | 254 | 7206 | 53.3 | 606 | 593 | 124.1 |
| A | 3 | 137 | 6558 | 48.08 | 606 | 593 | 124.1 |
| B | 5 | 184 | 355269 | 3078.1 | 598 | 582 | 115.2 |
| B | 5 | 172 | 160489 | 1387.73 | 598 | 582 | 115.2 |
| B | 0 | 190 | 36908 | 315.25 | 598 | 582 | 115.2 |
| C | 15 | 214 | 234562 | 1704.91 | 585 | 587 | 137.2 |
| C | 3 | 233 | 18481 | 130.39 | 585 | 587 | 137.2 |
| C | 13 | 61 | 3989 | 24.79 | 585 | 587 | 137.2 |
| D | 12 | 235 | 5612413 | 44399.8 | 519 | 503 | 126.4 |
| D | 2 | 153 | 185964 | 1467.31 | 519 | 503 | 126.4 |
| D | 2 | 249 | 101422 | 798.44 | 519 | 503 | 126.4 |
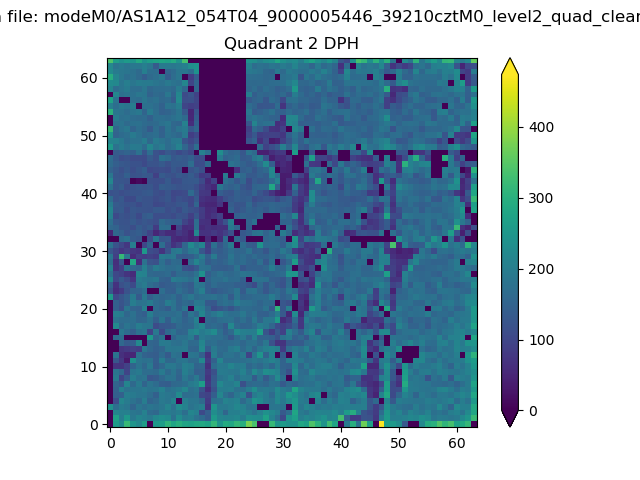
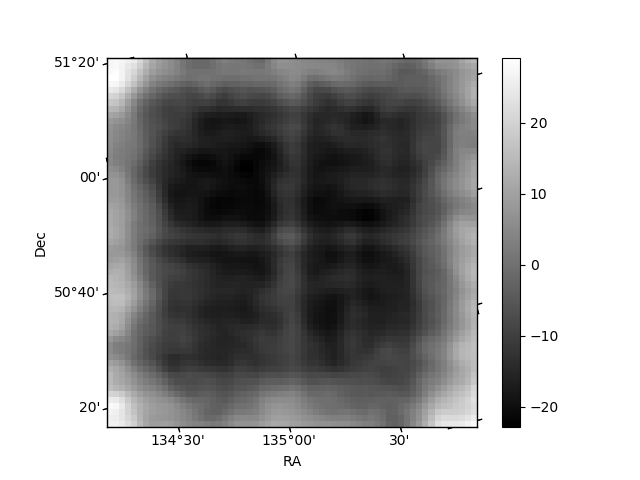
Histogram calculated using DETX and DETY for each event in the final _common_clean file
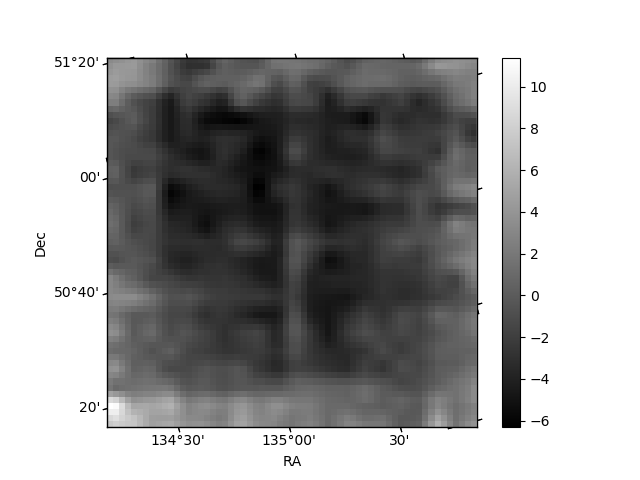
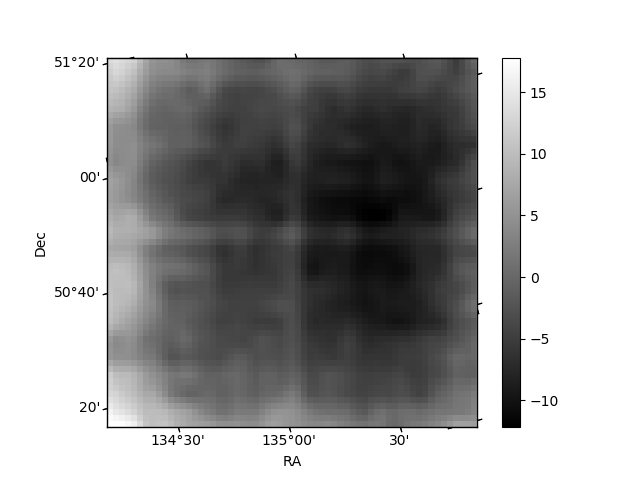
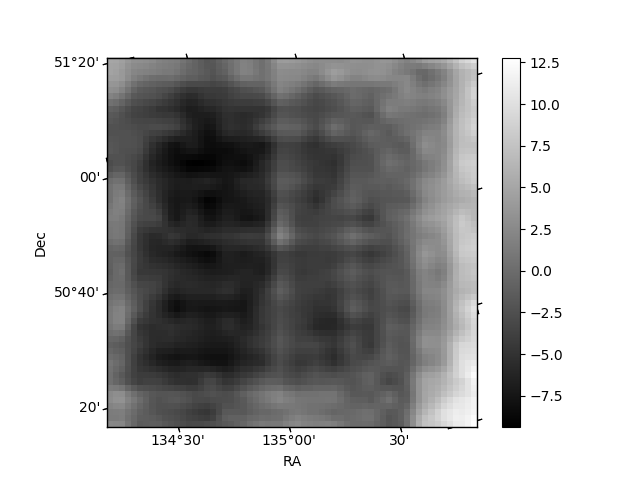
| Quadrant A | 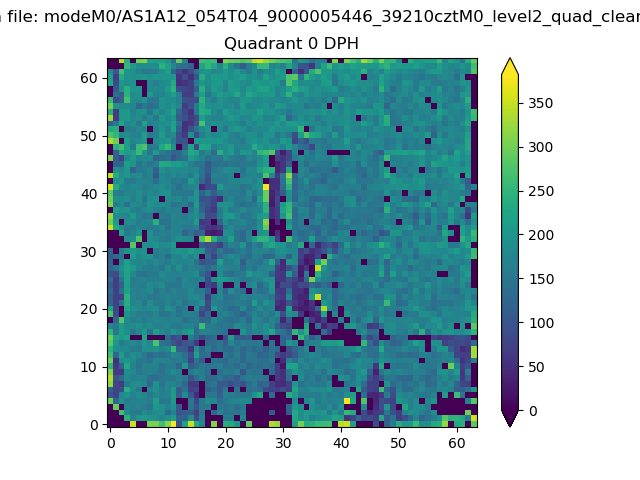 |
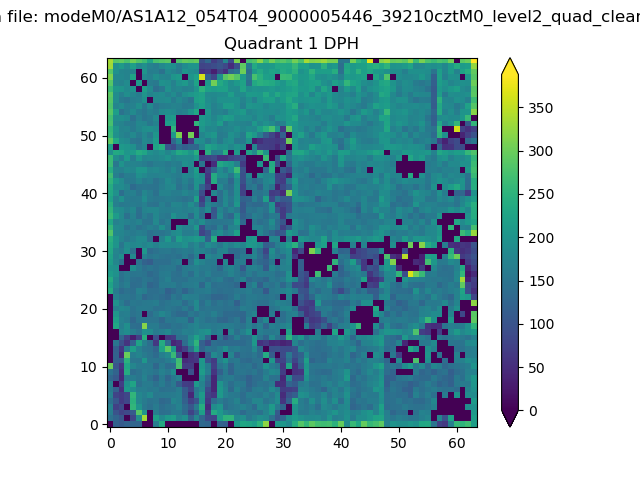 |
Quadrant B |
|---|---|---|---|
| Quadrant D | 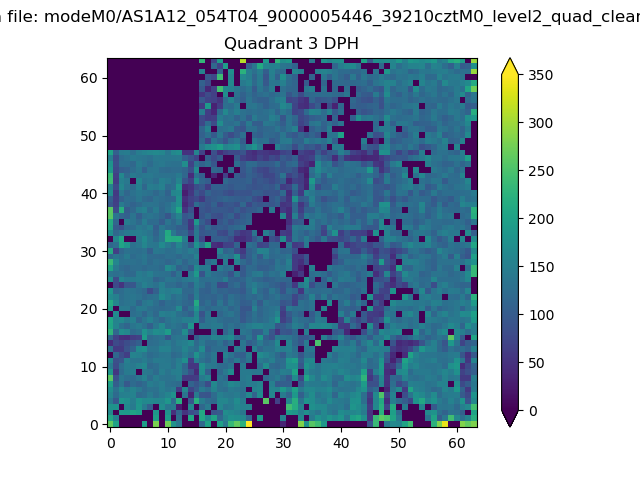 |
 |
Quadrant C |
| Plot type | Count rate plots | Images |
|---|---|---|
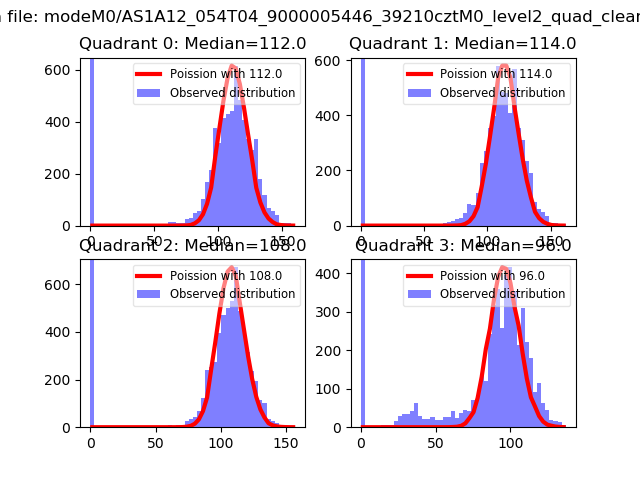
| Comparison with Poisson distribution Blue bars denote a histogram of data divided into 1 sec bins. Red curve is a Poisson curve with rate = median count rate of data. |
 |
 |
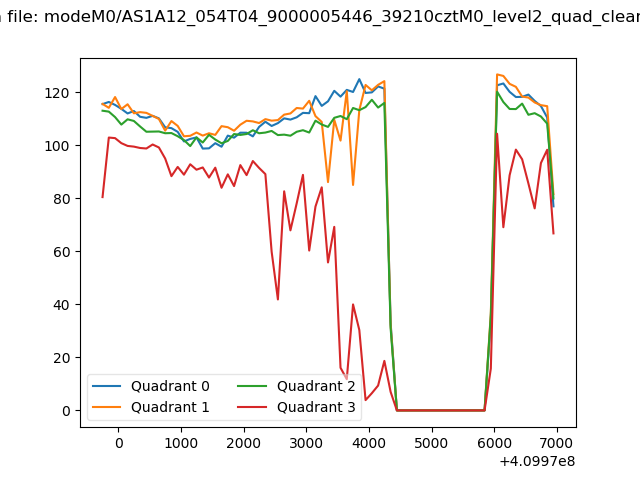
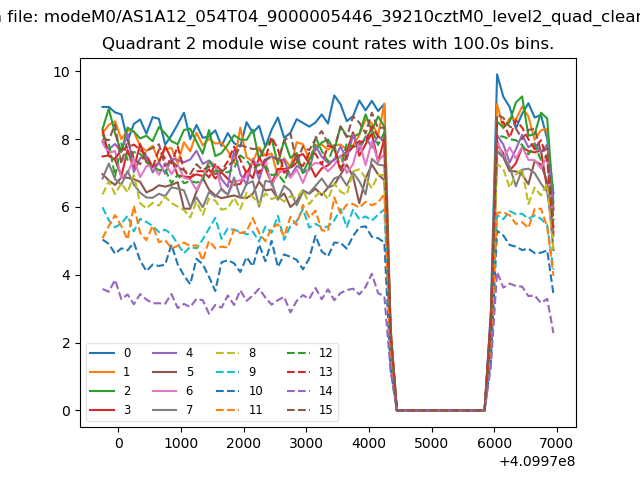
| Quadrant-wise count rates Data is divided into 100 sec bins |
 |
|
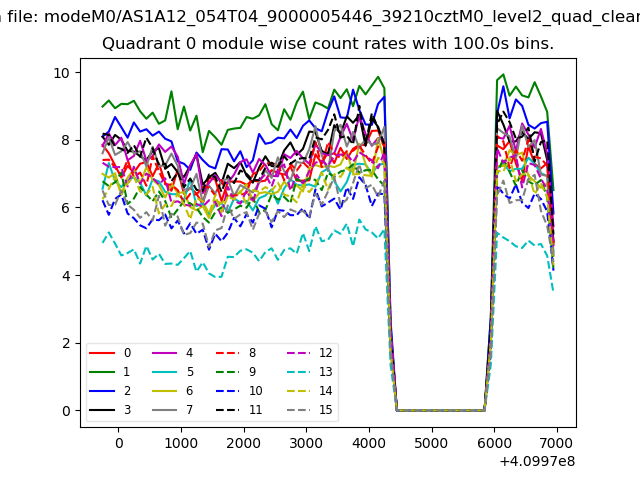
| Module-wise count rates for Quadrant A Data is divided into 100 sec bins |
 |
 |
| Module-wise count rates for Quadrant B Data is divided into 100 sec bins |
 |
 |
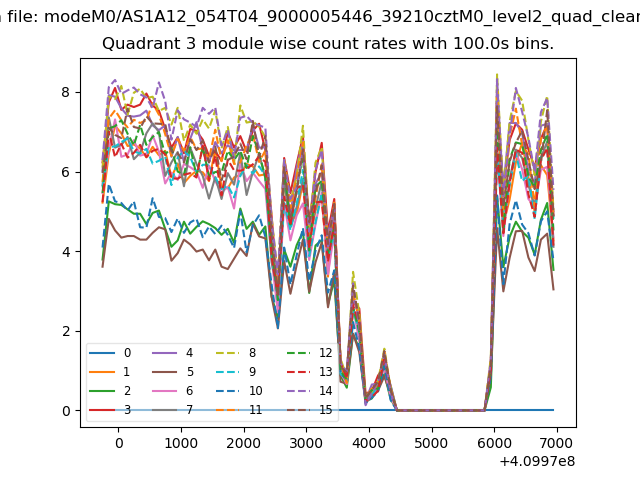
| Module-wise count rates for Quadrant C Data is divided into 100 sec bins |
 |
 |
| Module-wise count rates for Quadrant D Data is divided into 100 sec bins |
 |
 |
| Parameter | Plot |
|---|---|
| CZT HV Monitor |  |
| D_VDD | 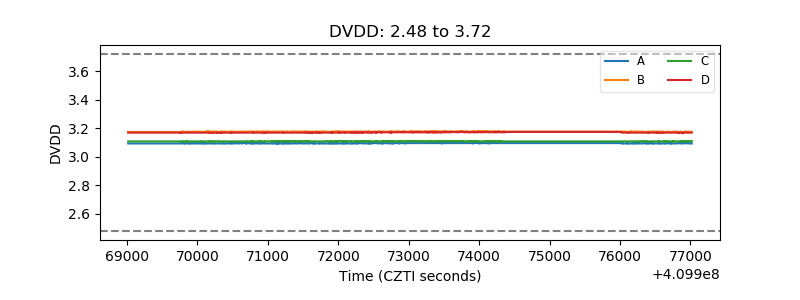 |
| Temperature 1 | 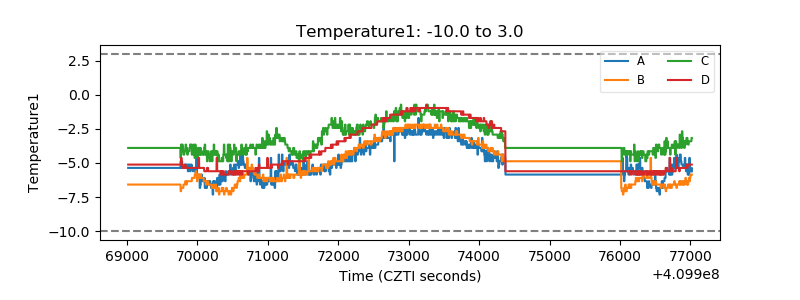 |
| Veto HV Monitor | 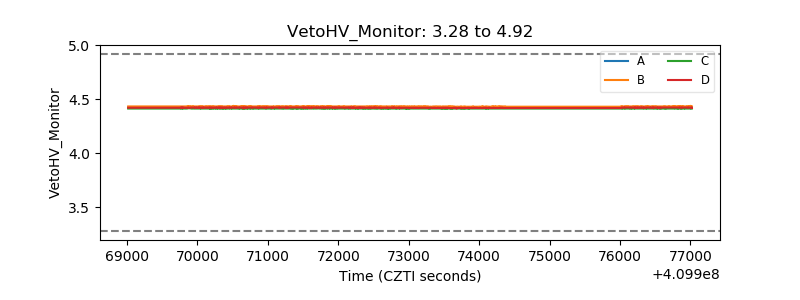 |
| Veto LLD | 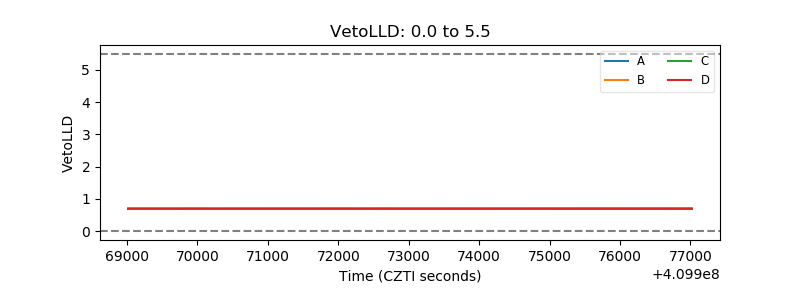 |
| Alpha Counter | 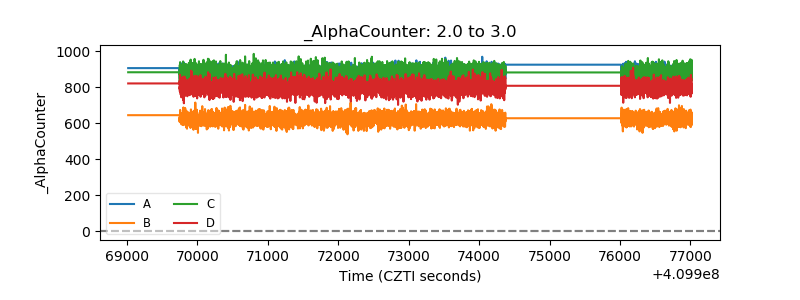 |
| _CPM_Rate | 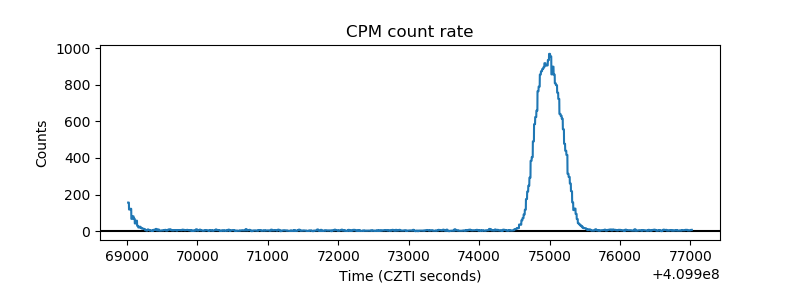 |
| CZT Counter | 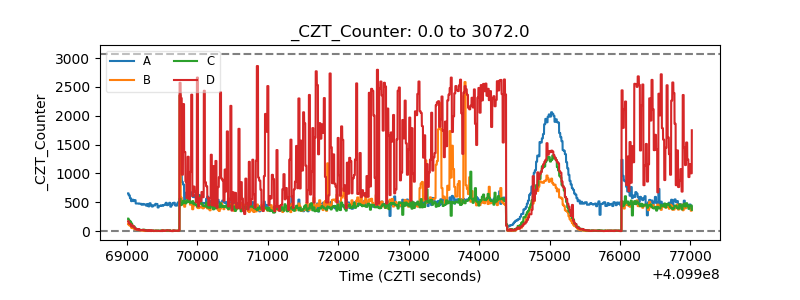 |
| +2.5 Volts monitor | 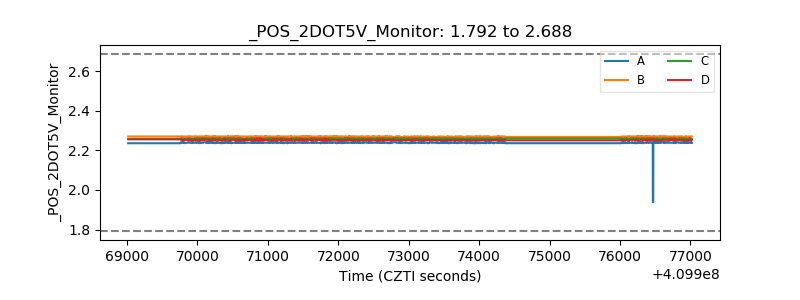 |
| +5 Volts monitor | 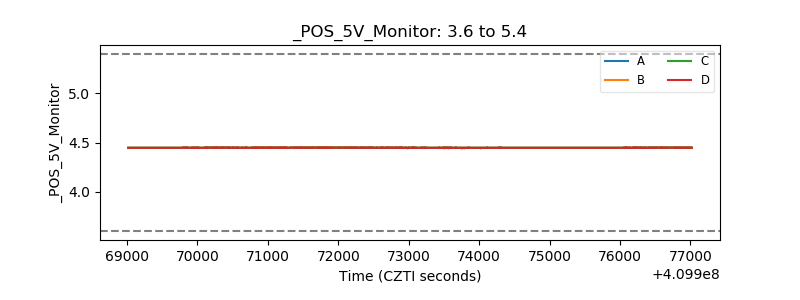 |
| _ROLL_ROT | 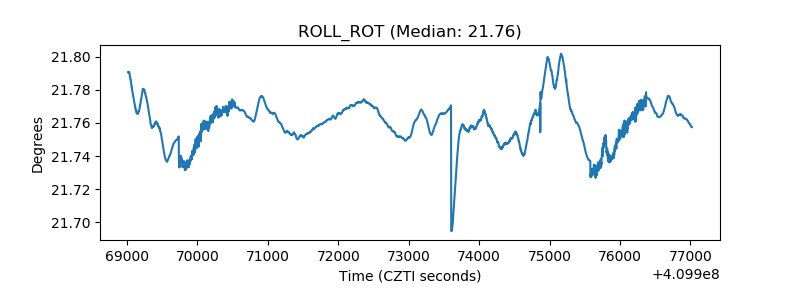 |
| _Roll_DEC | 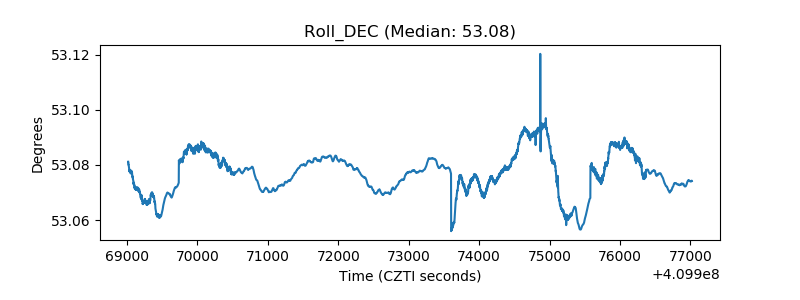 |
| _Roll_RA | 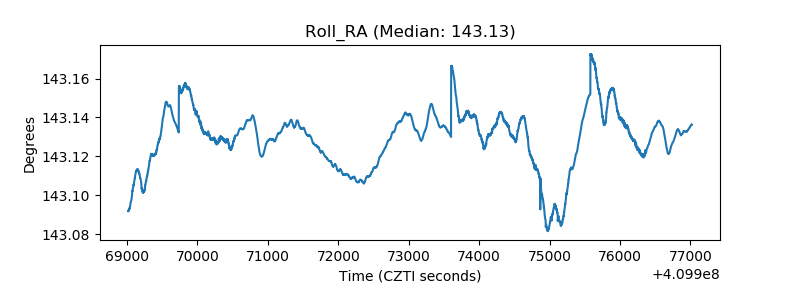 |
| Veto Counter | 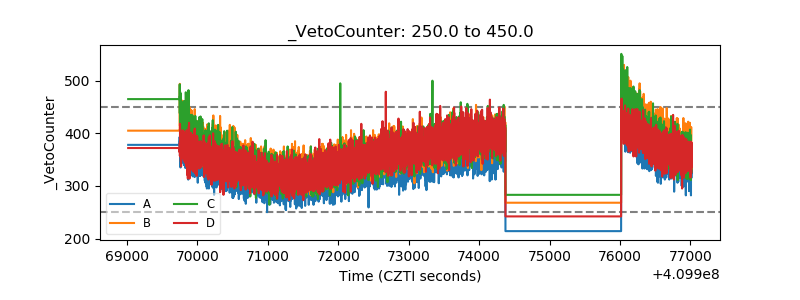 |