| Param | Original file | Final file |
|---|---|---|
| Filename | modeM0/AS1A12_054T04_9000005446_39212cztM0_level2.fits | modeM0/AS1A12_054T04_9000005446_39212cztM0_level2_quad_clean.evt |
| Size (bytes) | 489,024,000 | 83,378,880 |
| Size | 466.4 MB | 79.5 MB |
| Events in quadrant A | 2,693,434 | 619,502 |
| Events in quadrant B | 2,499,903 | 631,270 |
| Events in quadrant C | 2,631,185 | 587,468 |
| Events in quadrant D | 9,865,529 | 315,507 |
| Mode M9 | |||
|---|---|---|---|
| Quadrant | BADHDUFLAG | Total packets | Discarded packets |
| A | 0 | 30 | 2 |
| B | 0 | 29 | 2 |
| C | 0 | 30 | 6 |
| D | 0 | 30 | 3 |
| Mode M0 | |||
|---|---|---|---|
| Quadrant | BADHDUFLAG | Total packets | Discarded packets |
| A | 0 | 11428 | 166 |
| B | 0 | 11207 | 99 |
| C | 0 | 11442 | 140 |
| D | 0 | 33837 | 928 |
| Mode SS | |||
|---|---|---|---|
| Quadrant | BADHDUFLAG | Total packets | Discarded packets |
| A | 0 | 108 | 0 |
| B | 0 | 108 | 0 |
| C | 0 | 108 | 0 |
| D | 0 | 107 | 0 |
| Quadrant | Total seconds | Saturated seconds | Saturation percentage |
|---|---|---|---|
| A | 5316 | 12 | 0.225734% |
| B | 5332 | 18 | 0.337584% |
| C | 5305 | 28 | 0.527804% |
| D | 5227 | 2527 | 48.345131% |
Noise dominated data is calculated using 1-second bins in cleaned event files. If a bin has >2000 counts, and if more than 50% of those come from <1% of pixels, then it is considered to be noise-dominated and hence unusable.
| Quadrant | # 1 sec bins | Bins with >0 counts | Bins with >2000 counts | High rate bins dominated by noise | Noise dominated (total time) | Noise dominated (detector-on time) | Marked lightcurve |
|---|---|---|---|---|---|---|---|
| A | 7191 | 5375 | 3 | 3 | 0.04% | 0.06% | 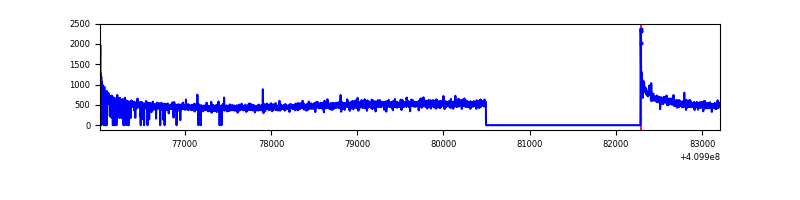 |
| B | 7190 | 5377 | 10 | 10 | 0.14% | 0.19% | 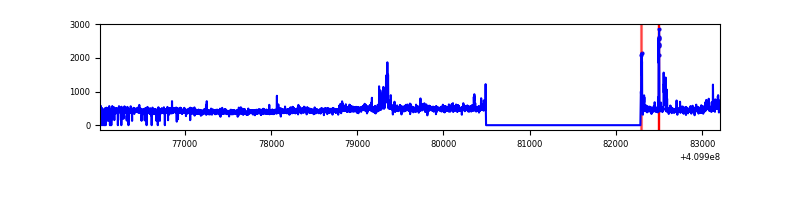 |
| C | 7192 | 5367 | 23 | 23 | 0.32% | 0.43% | 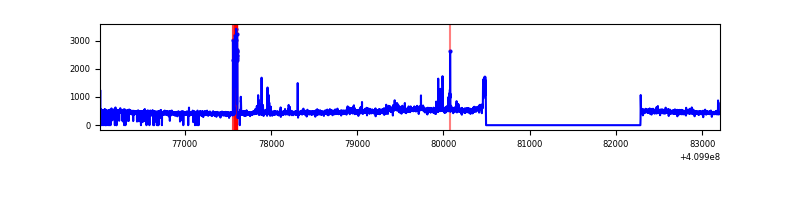 |
| D | 7192 | 5343 | 2260 | 2260 | 31.42% | 42.30% | 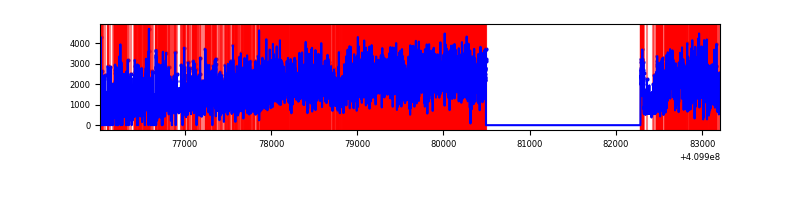 |
Top three noisy pixels from each quadrant. If the there are fewer than three noisy pixels in the level2.evt file, extra rows are filled as -1
| Pixel properties | Quadrant properties | ||||||
|---|---|---|---|---|---|---|---|
| Quadrant | DetID | PixID | Counts | Sigma | Mean | Median | Sigma |
| A | 10 | 83 | 409776 | 3452.16 | 587 | 576 | 118.5 |
| A | 15 | 174 | 9570 | 75.88 | 587 | 576 | 118.5 |
| A | 13 | 254 | 7624 | 59.46 | 587 | 576 | 118.5 |
| B | 5 | 184 | 79216 | 703.23 | 583 | 568 | 111.8 |
| B | 5 | 172 | 71850 | 637.37 | 583 | 568 | 111.8 |
| B | 0 | 190 | 57723 | 511.05 | 583 | 568 | 111.8 |
| C | 15 | 214 | 220564 | 1697.51 | 560 | 563 | 129.6 |
| C | 9 | 187 | 188430 | 1449.57 | 560 | 563 | 129.6 |
| C | 3 | 233 | 28061 | 212.17 | 560 | 563 | 129.6 |
| D | 12 | 235 | 7620496 | 68520.97 | 451 | 437 | 111.2 |
| D | 2 | 249 | 335507 | 3013.01 | 451 | 437 | 111.2 |
| D | 13 | 249 | 44289 | 394.33 | 451 | 437 | 111.2 |
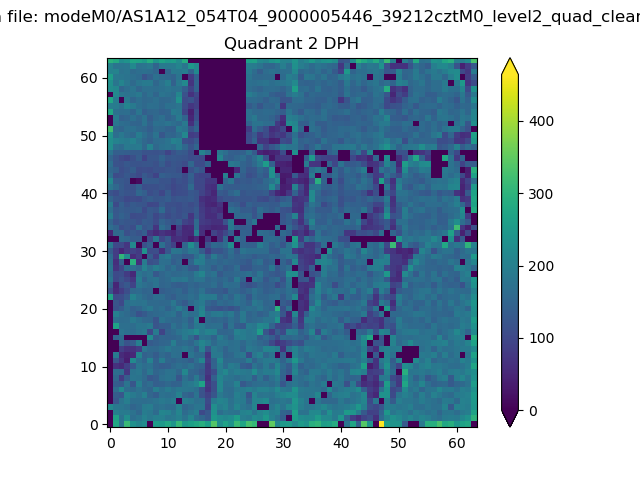
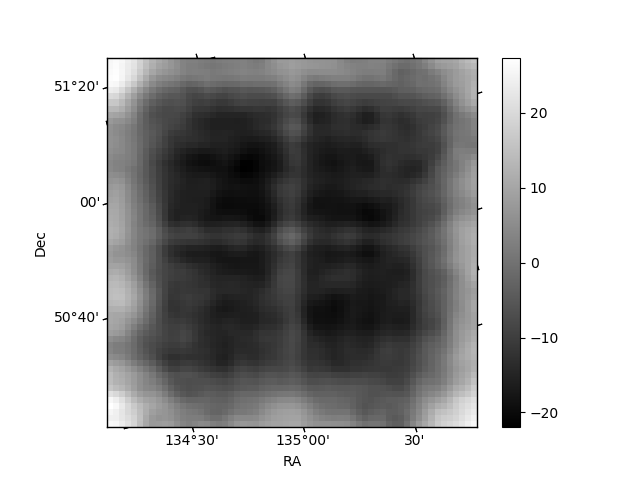
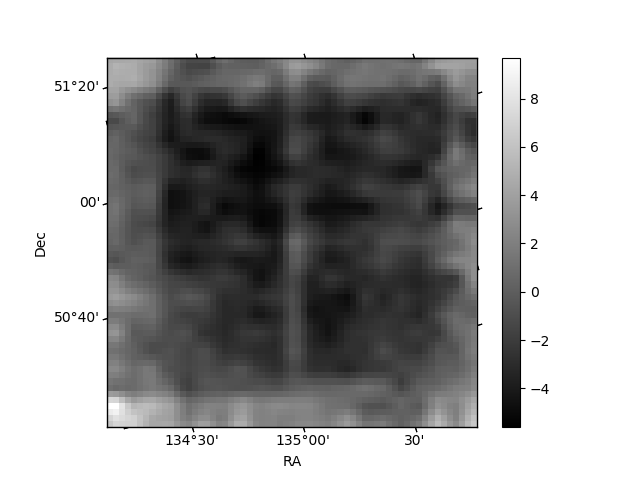
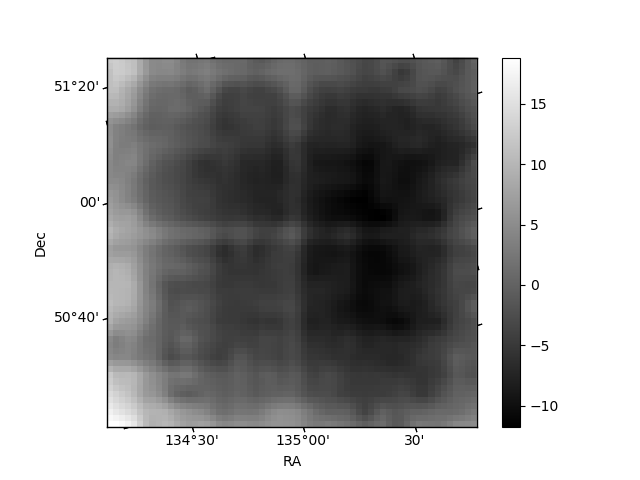
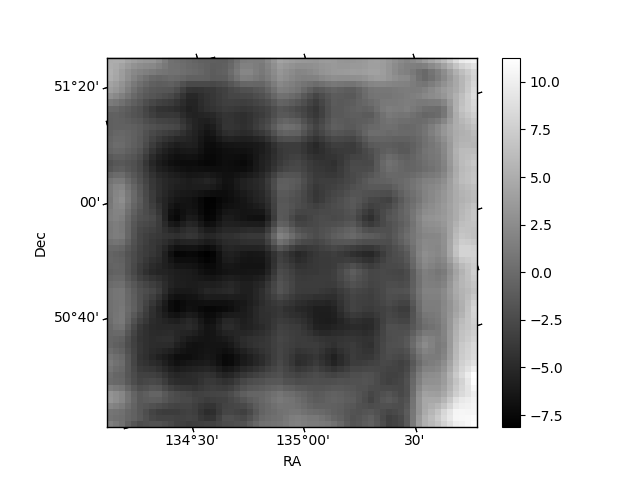
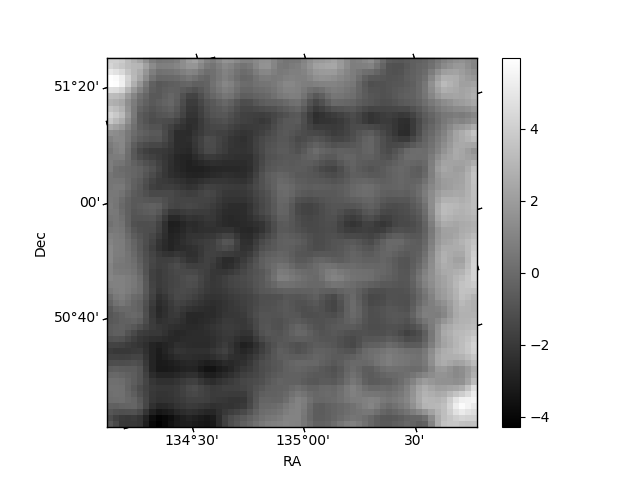
Histogram calculated using DETX and DETY for each event in the final _common_clean file
| Quadrant A | 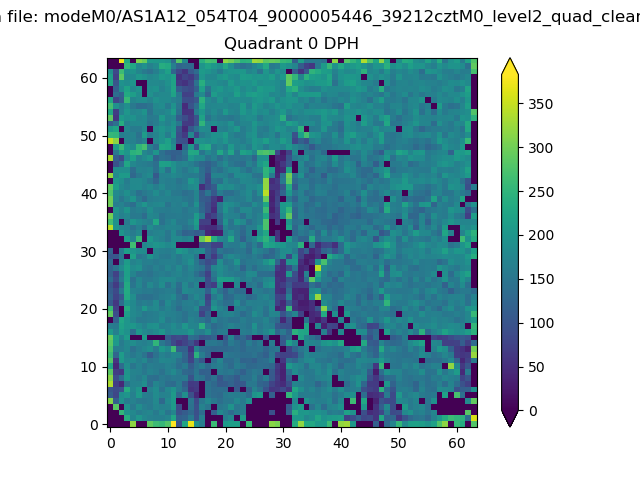 |
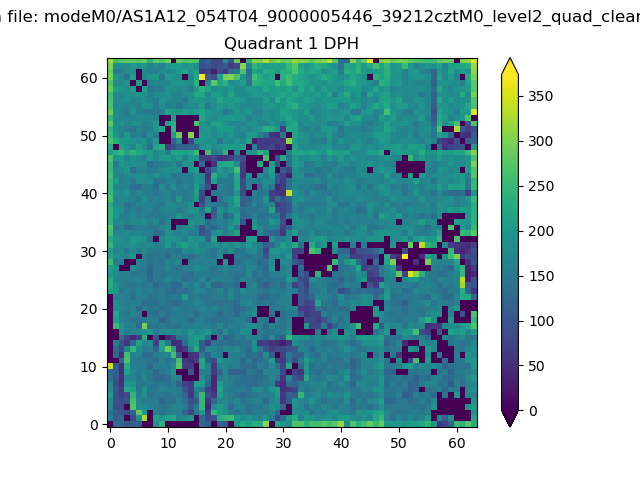 |
Quadrant B |
|---|---|---|---|
| Quadrant D | 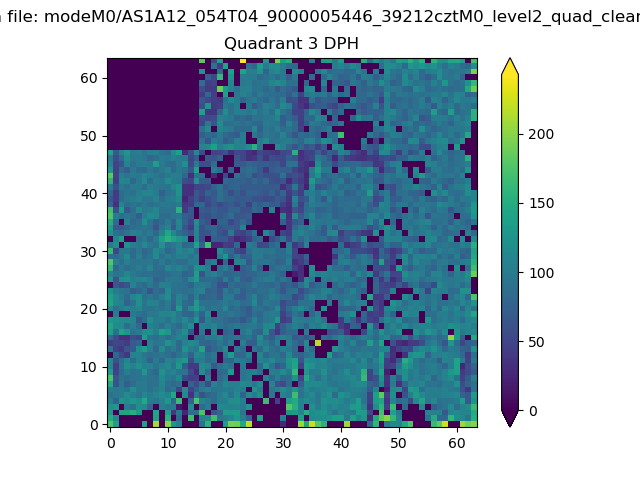 |
 |
Quadrant C |
| Plot type | Count rate plots | Images |
|---|---|---|
| Comparison with Poisson distribution Blue bars denote a histogram of data divided into 1 sec bins. Red curve is a Poisson curve with rate = median count rate of data. |
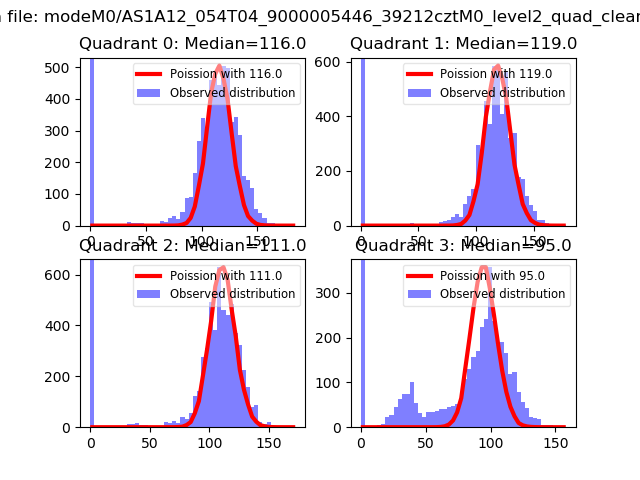 |
 |
| Quadrant-wise count rates Data is divided into 100 sec bins |
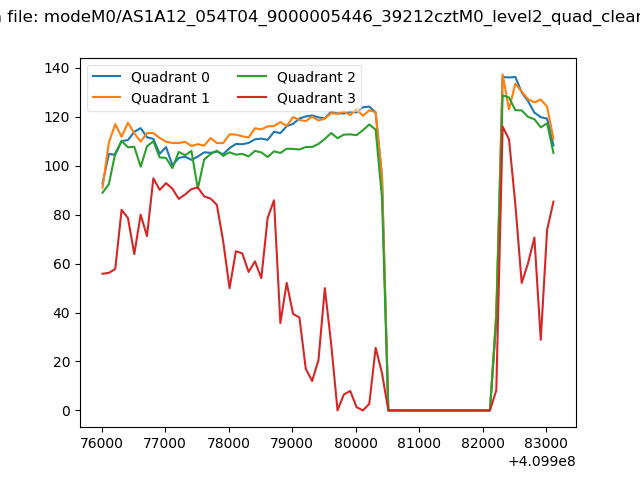 |
|
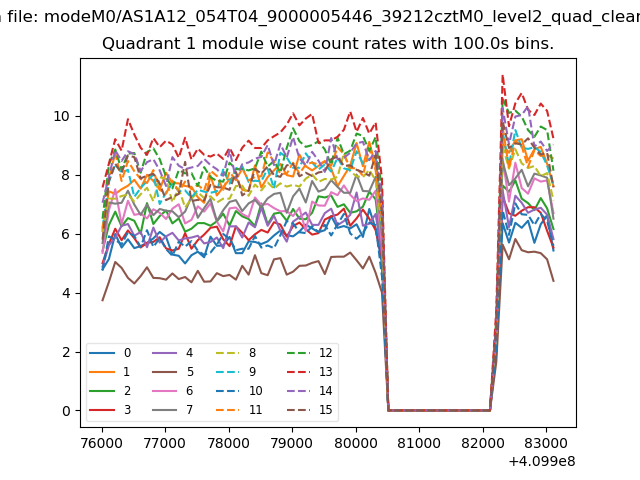
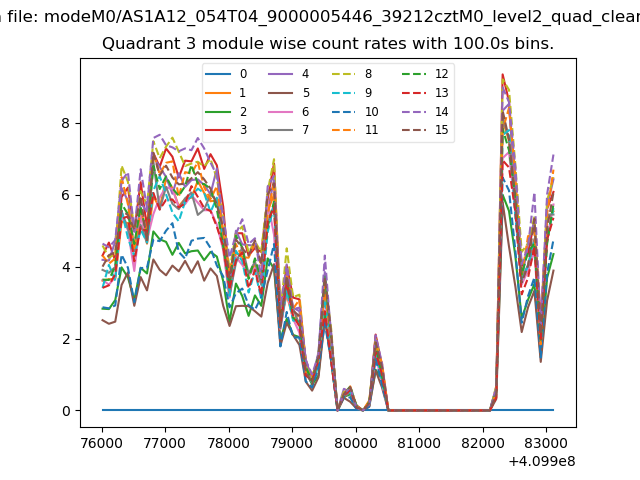
| Module-wise count rates for Quadrant A Data is divided into 100 sec bins |
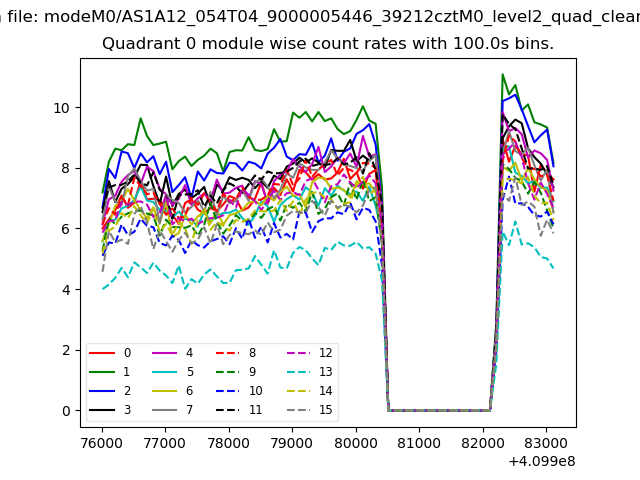 |
 |
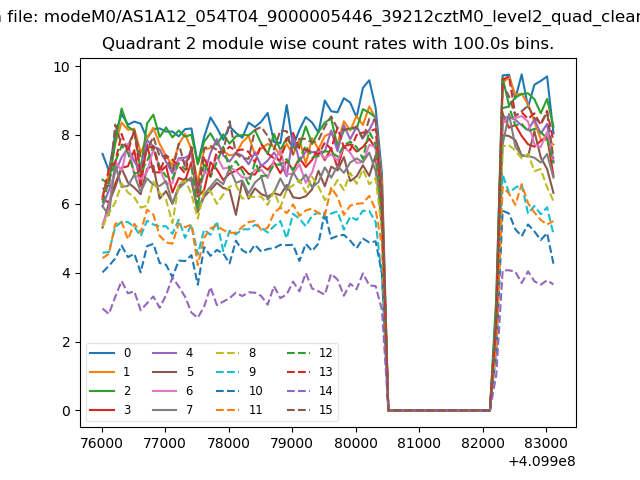
| Module-wise count rates for Quadrant B Data is divided into 100 sec bins |
 |
 |
| Module-wise count rates for Quadrant C Data is divided into 100 sec bins |
 |
 |
| Module-wise count rates for Quadrant D Data is divided into 100 sec bins |
 |
 |
| Parameter | Plot |
|---|---|
| CZT HV Monitor | 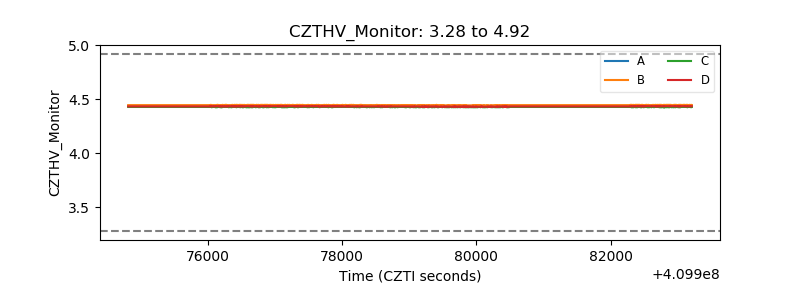 |
| D_VDD | 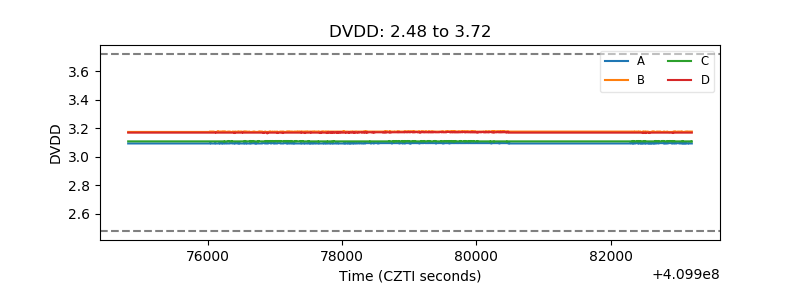 |
| Temperature 1 | 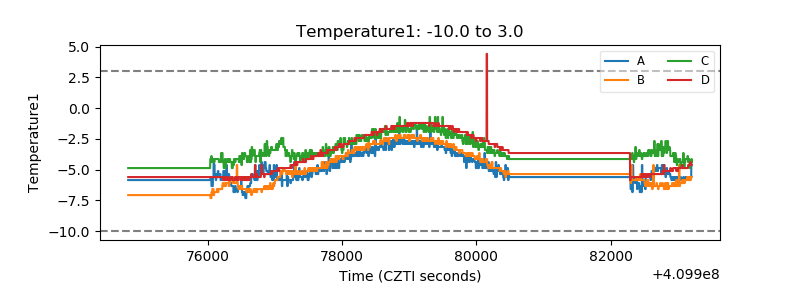 |
| Veto HV Monitor | 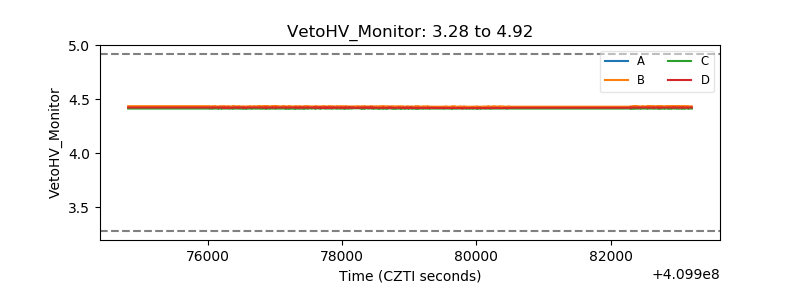 |
| Veto LLD | 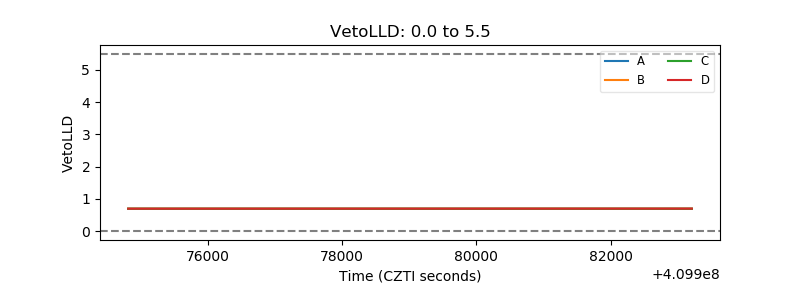 |
| Alpha Counter | 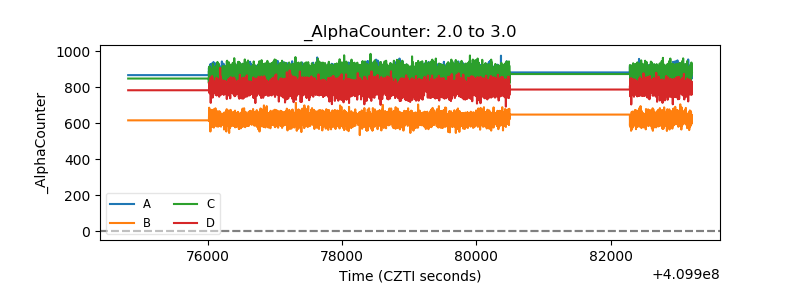 |
| _CPM_Rate | 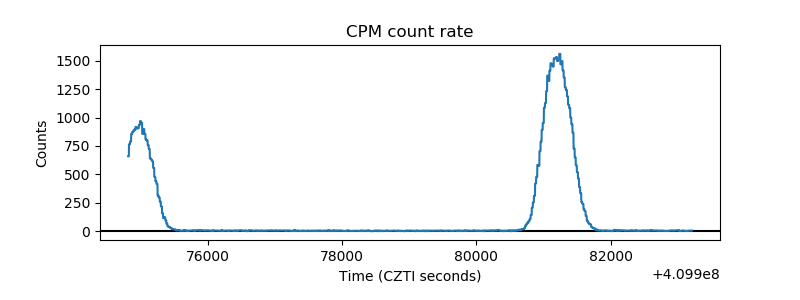 |
| CZT Counter | 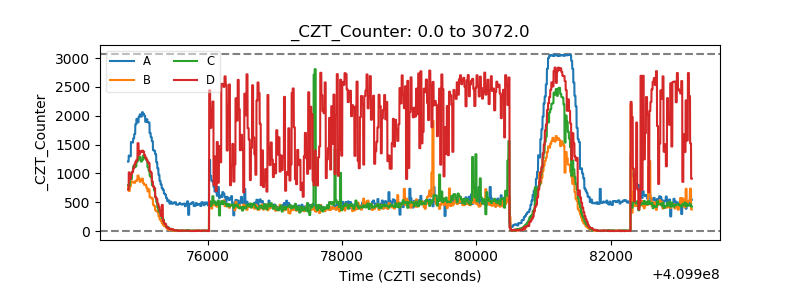 |
| +2.5 Volts monitor | 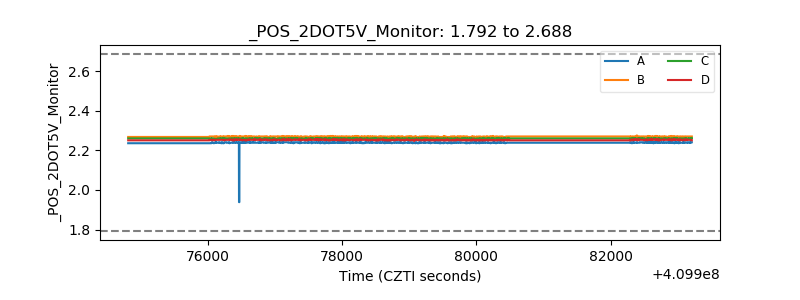 |
| +5 Volts monitor |  |
| _ROLL_ROT | 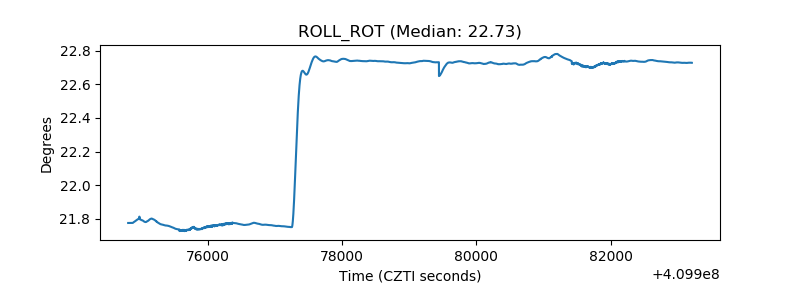 |
| _Roll_DEC | 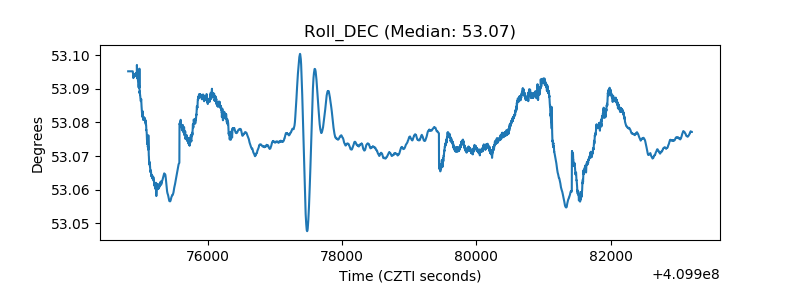 |
| _Roll_RA | 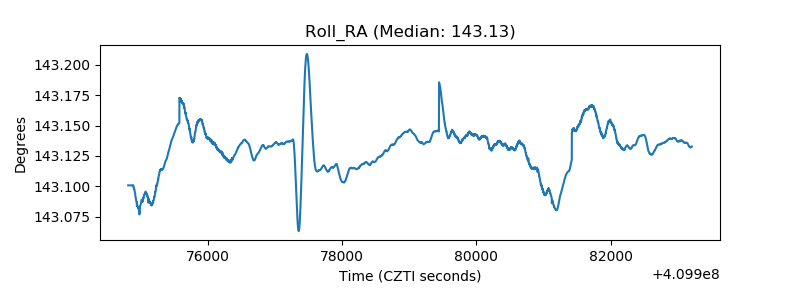 |
| Veto Counter | 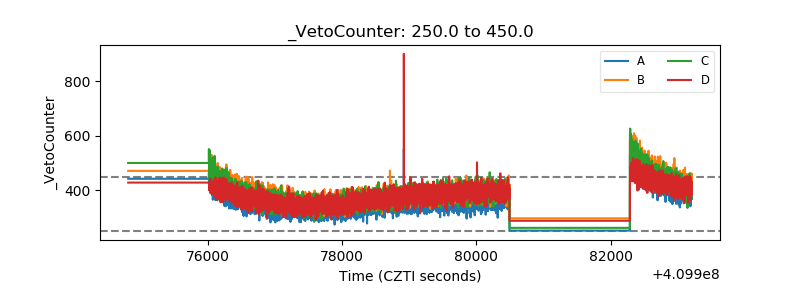 |