| Param | Original file | Final file |
|---|---|---|
| Filename | modeM0/AS1A12_054T04_9000005446_39216cztM0_level2.fits | modeM0/AS1A12_054T04_9000005446_39216cztM0_level2_quad_clean.evt |
| Size (bytes) | 538,842,240 | 81,633,600 |
| Size | 513.9 MB | 77.9 MB |
| Events in quadrant A | 2,869,510 | 661,445 |
| Events in quadrant B | 2,730,090 | 661,892 |
| Events in quadrant C | 2,521,095 | 614,460 |
| Events in quadrant D | 11,425,606 | 174,593 |
| Mode M9 | |||
|---|---|---|---|
| Quadrant | BADHDUFLAG | Total packets | Discarded packets |
| A | 0 | 24 | 0 |
| B | 0 | 24 | 0 |
| C | 0 | 24 | 0 |
| D | 0 | 25 | 0 |
| Mode M0 | |||
|---|---|---|---|
| Quadrant | BADHDUFLAG | Total packets | Discarded packets |
| A | 0 | 11475 | 3 |
| B | 0 | 11311 | 2 |
| C | 0 | 10378 | 2 |
| D | 0 | 37480 | 2 |
| Mode SS | |||
|---|---|---|---|
| Quadrant | BADHDUFLAG | Total packets | Discarded packets |
| A | 0 | 104 | 0 |
| B | 0 | 104 | 0 |
| C | 0 | 104 | 0 |
| D | 0 | 104 | 0 |
| Quadrant | Total seconds | Saturated seconds | Saturation percentage |
|---|---|---|---|
| A | 5131 | 24 | 0.467745% |
| B | 5131 | 72 | 1.403235% |
| C | 5131 | 6 | 0.116936% |
| D | 5131 | 3971 | 77.392321% |
Noise dominated data is calculated using 1-second bins in cleaned event files. If a bin has >2000 counts, and if more than 50% of those come from <1% of pixels, then it is considered to be noise-dominated and hence unusable.
| Quadrant | # 1 sec bins | Bins with >0 counts | Bins with >2000 counts | High rate bins dominated by noise | Noise dominated (total time) | Noise dominated (detector-on time) | Marked lightcurve |
|---|---|---|---|---|---|---|---|
| A | 7254 | 5132 | 13 | 13 | 0.18% | 0.25% | 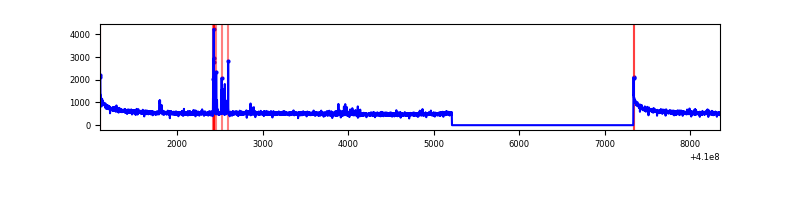 |
| B | 7254 | 5132 | 44 | 44 | 0.61% | 0.86% | 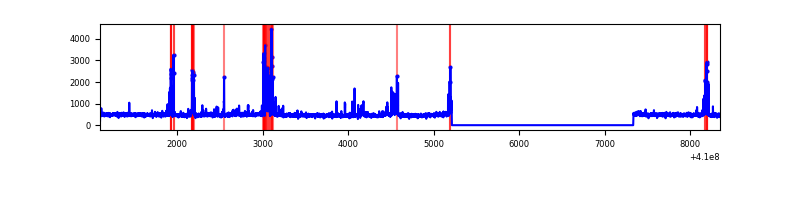 |
| C | 7254 | 5132 | 0 | 0 | 0.00% | 0.00% | 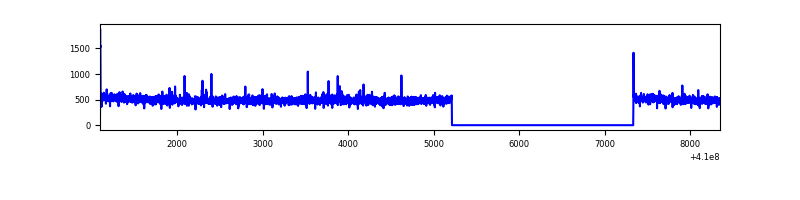 |
| D | 7254 | 5132 | 2898 | 2898 | 39.95% | 56.47% | 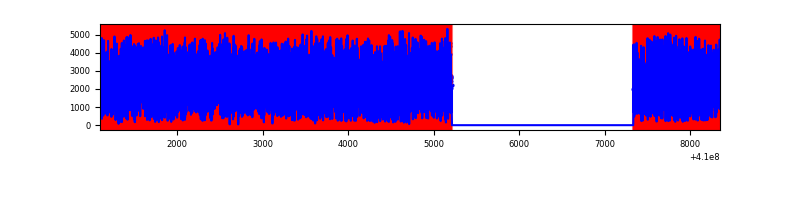 |
Top three noisy pixels from each quadrant. If the there are fewer than three noisy pixels in the level2.evt file, extra rows are filled as -1
| Pixel properties | Quadrant properties | ||||||
|---|---|---|---|---|---|---|---|
| Quadrant | DetID | PixID | Counts | Sigma | Mean | Median | Sigma |
| A | 10 | 83 | 432875 | 3518.39 | 610 | 598 | 122.9 |
| A | 13 | 248 | 68564 | 553.19 | 610 | 598 | 122.9 |
| A | 15 | 174 | 8071 | 60.82 | 610 | 598 | 122.9 |
| B | 5 | 172 | 243444 | 2140.79 | 596 | 582 | 113.4 |
| B | 0 | 190 | 48857 | 425.54 | 596 | 582 | 113.4 |
| B | 0 | 221 | 39310 | 341.38 | 596 | 582 | 113.4 |
| C | 15 | 214 | 215805 | 1611.94 | 582 | 587 | 133.5 |
| C | 3 | 233 | 10380 | 73.34 | 582 | 587 | 133.5 |
| C | 0 | 10 | 8625 | 60.2 | 582 | 587 | 133.5 |
| D | 12 | 235 | 9563366 | 108610.82 | 355 | 344 | 88.0 |
| D | 2 | 249 | 217675 | 2468.31 | 355 | 344 | 88.0 |
| D | 2 | 250 | 78747 | 890.45 | 355 | 344 | 88.0 |
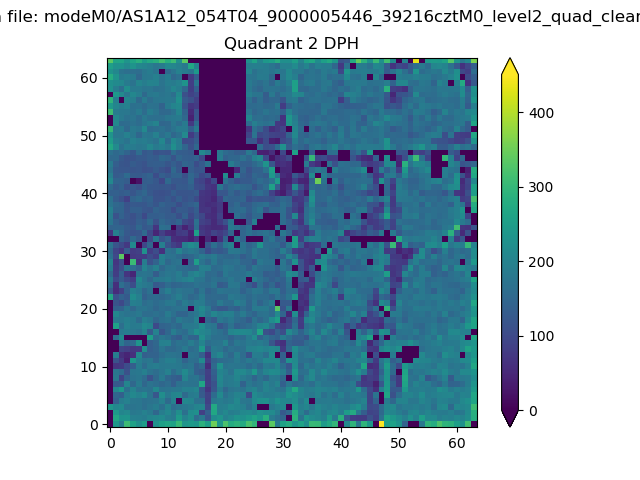
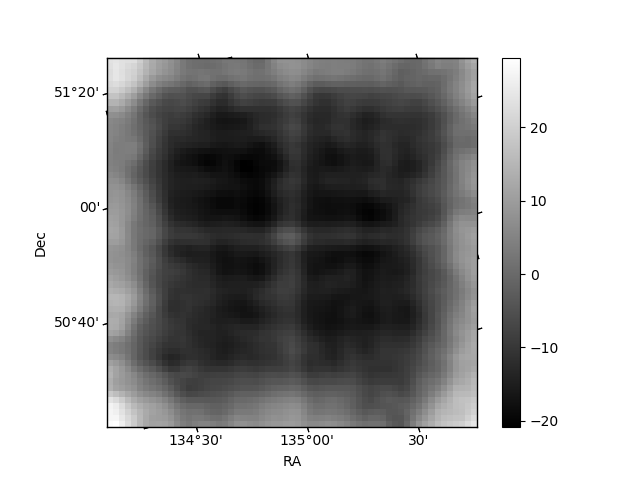
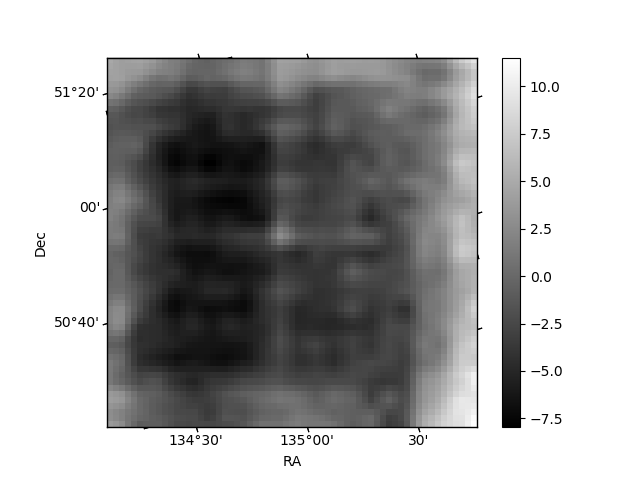
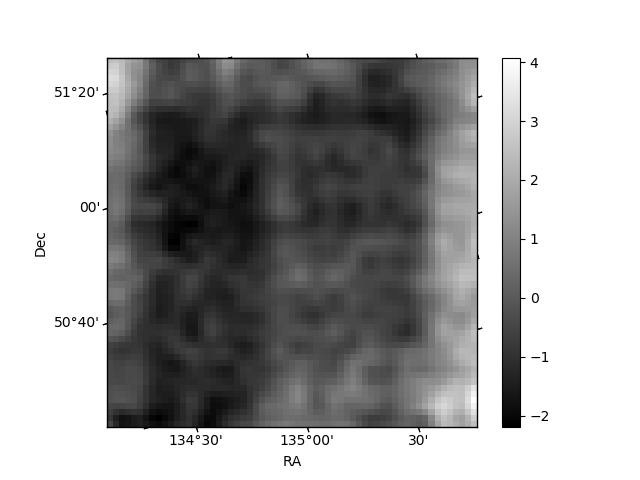
Histogram calculated using DETX and DETY for each event in the final _common_clean file
| Quadrant A | 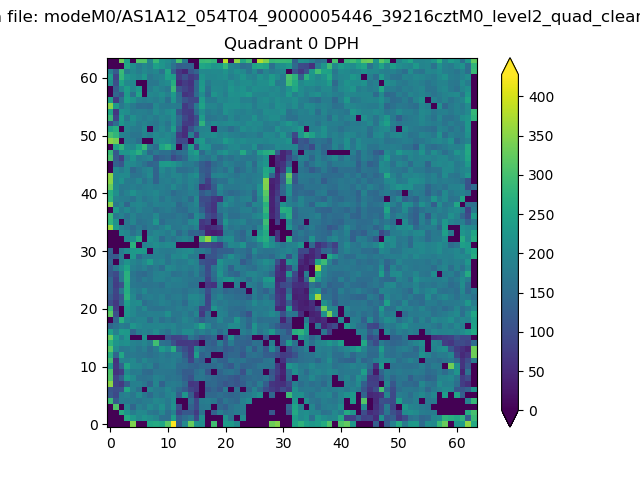 |
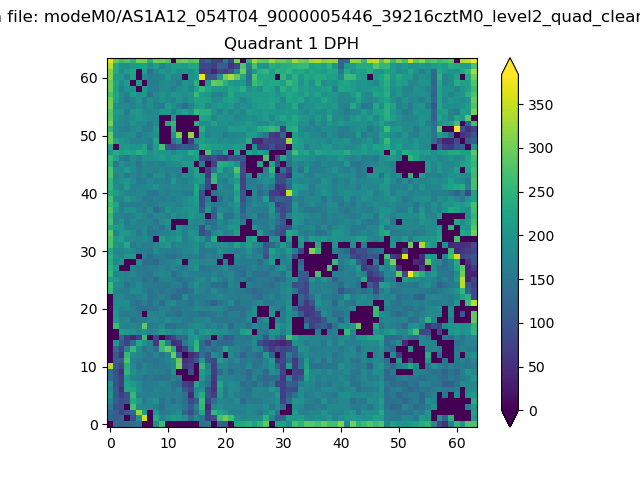 |
Quadrant B |
|---|---|---|---|
| Quadrant D | 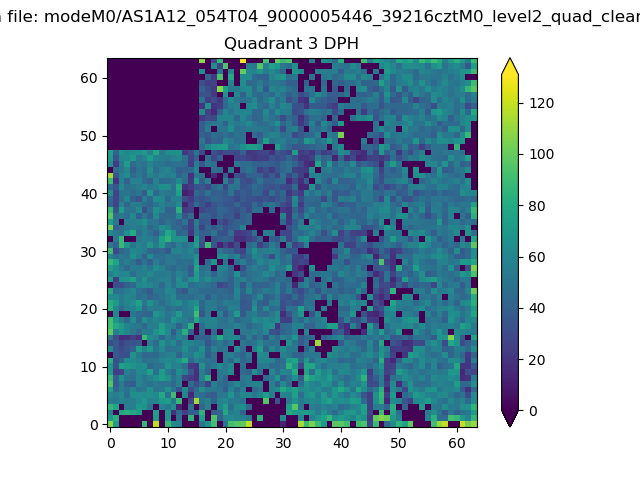 |
 |
Quadrant C |
| Plot type | Count rate plots | Images |
|---|---|---|
| Comparison with Poisson distribution Blue bars denote a histogram of data divided into 1 sec bins. Red curve is a Poisson curve with rate = median count rate of data. |
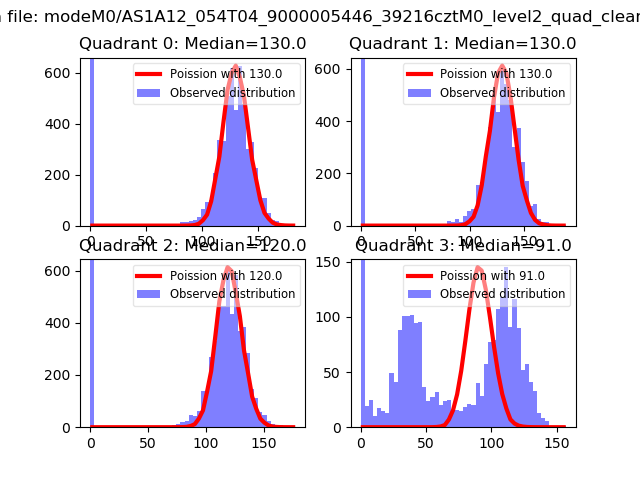 |
 |
| Quadrant-wise count rates Data is divided into 100 sec bins |
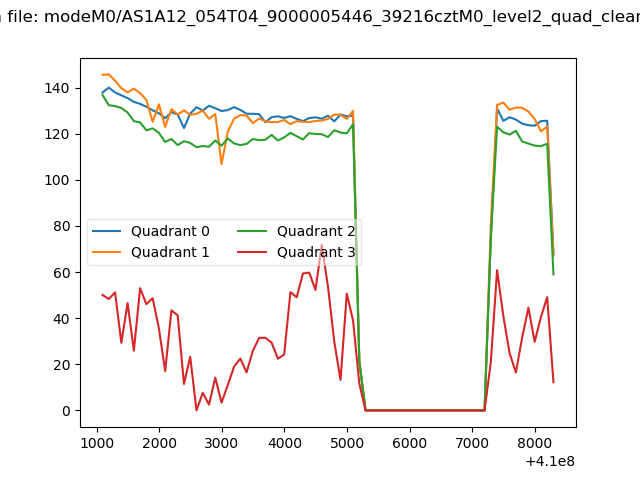 |
|
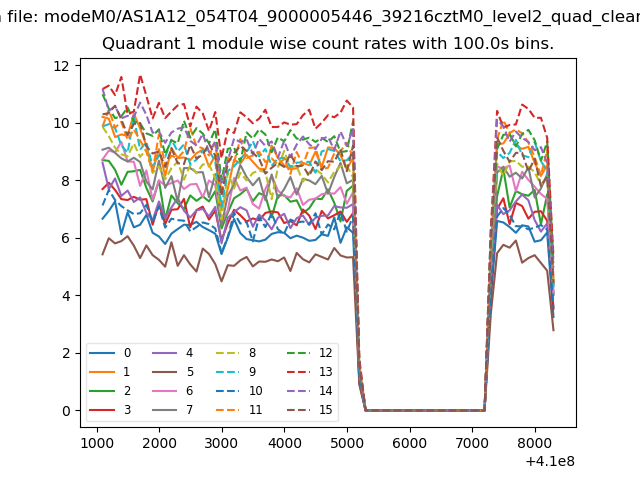
| Module-wise count rates for Quadrant A Data is divided into 100 sec bins |
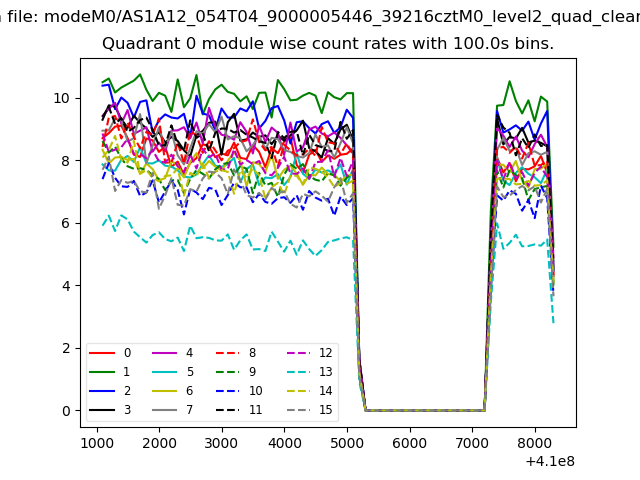 |
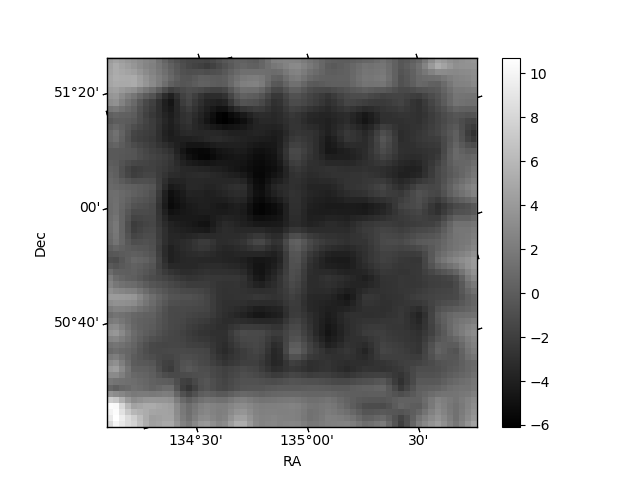 |
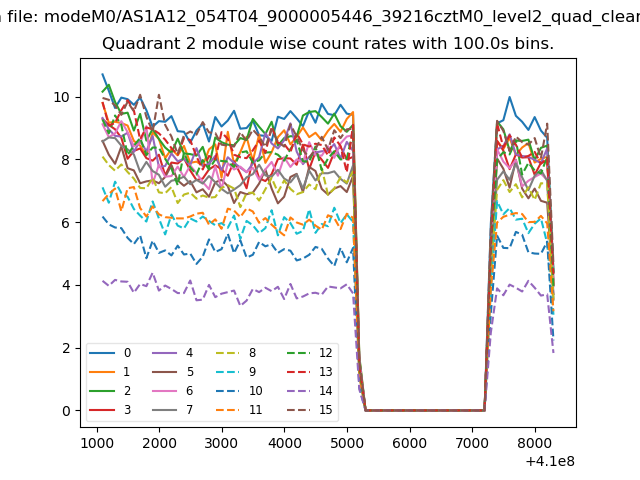
| Module-wise count rates for Quadrant B Data is divided into 100 sec bins |
 |
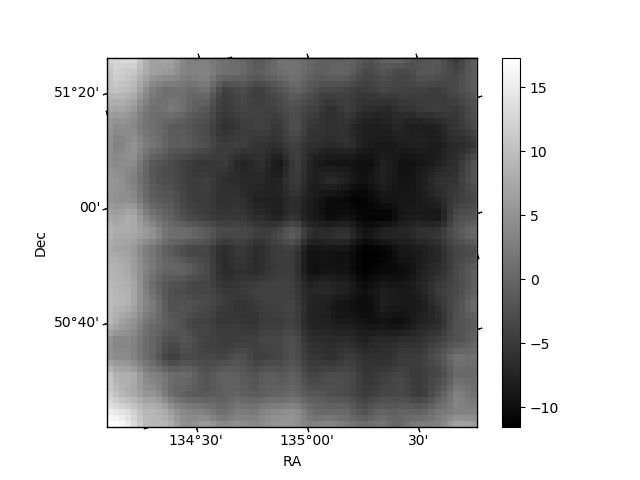 |
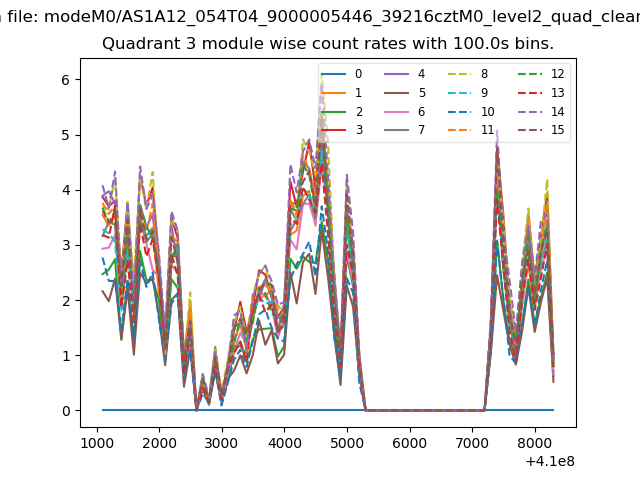
| Module-wise count rates for Quadrant C Data is divided into 100 sec bins |
 |
 |
| Module-wise count rates for Quadrant D Data is divided into 100 sec bins |
 |
 |
| Parameter | Plot |
|---|---|
| CZT HV Monitor | 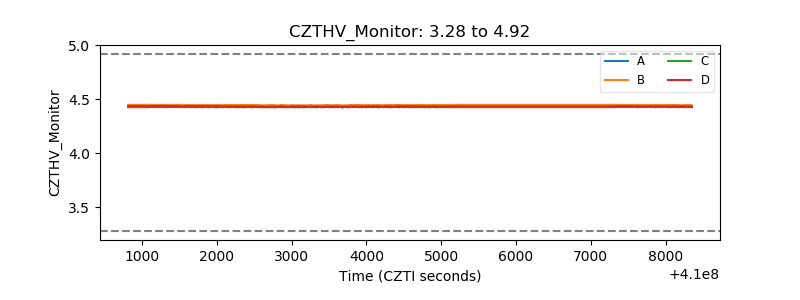 |
| D_VDD | 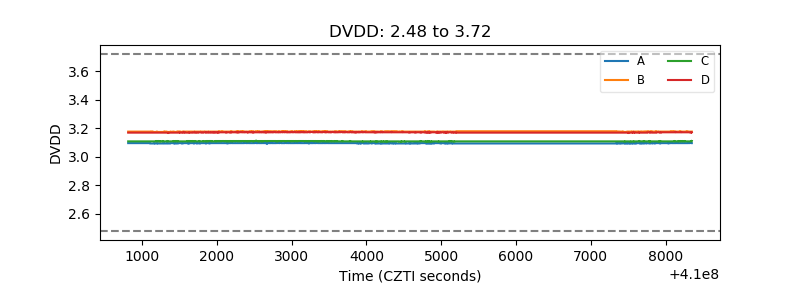 |
| Temperature 1 | 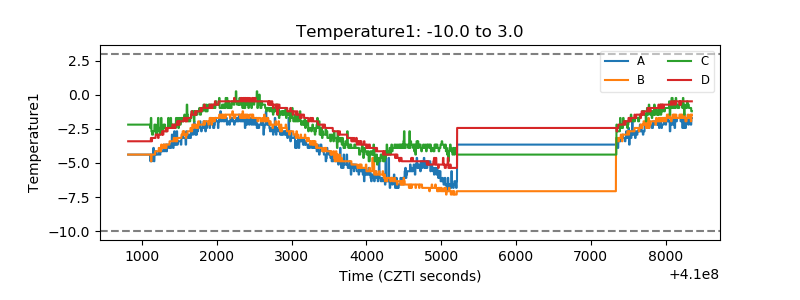 |
| Veto HV Monitor |  |
| Veto LLD | 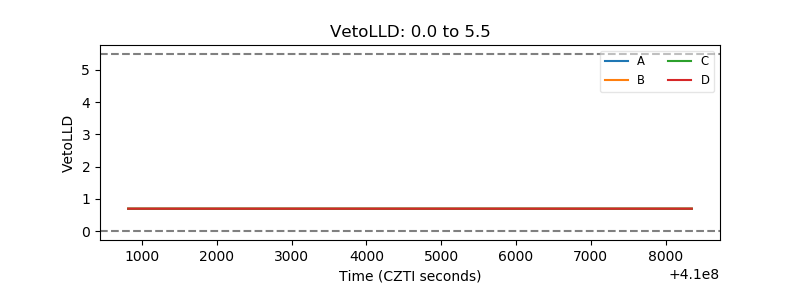 |
| Alpha Counter | 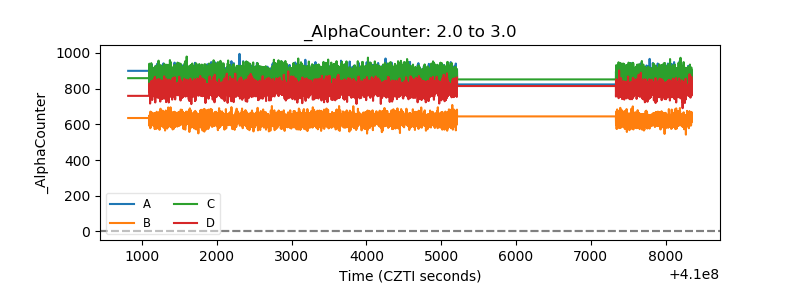 |
| _CPM_Rate | 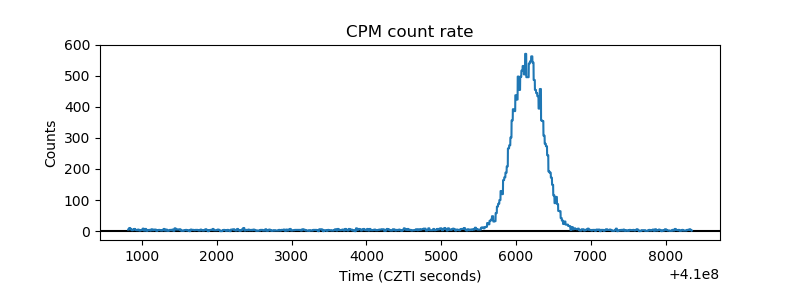 |
| CZT Counter | 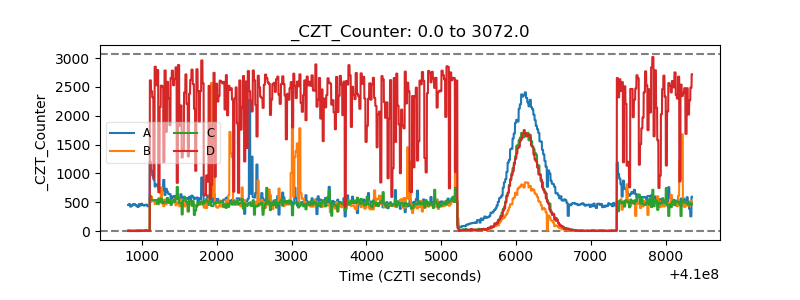 |
| +2.5 Volts monitor | 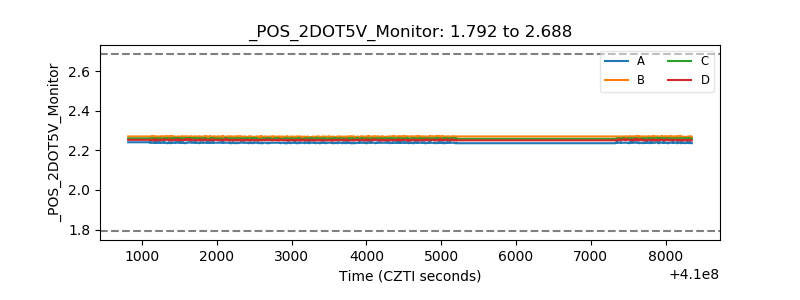 |
| +5 Volts monitor |  |
| _ROLL_ROT | 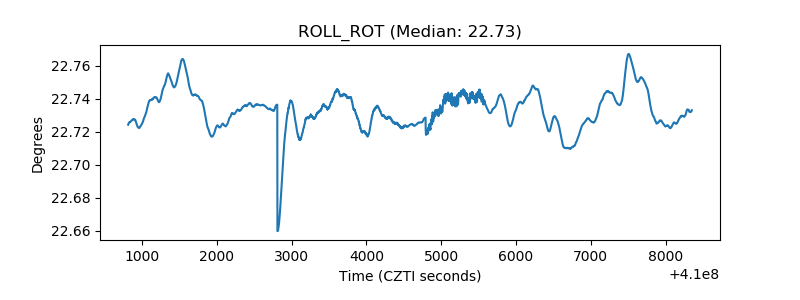 |
| _Roll_DEC | 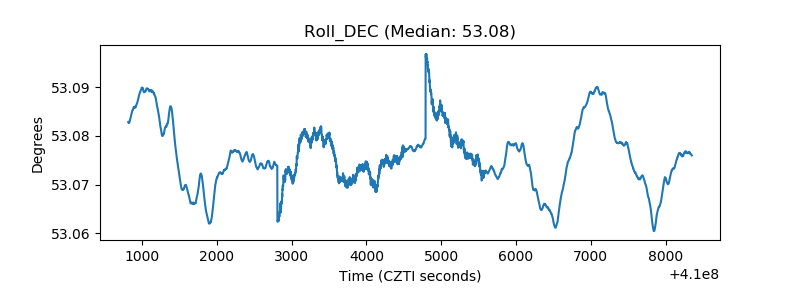 |
| _Roll_RA | 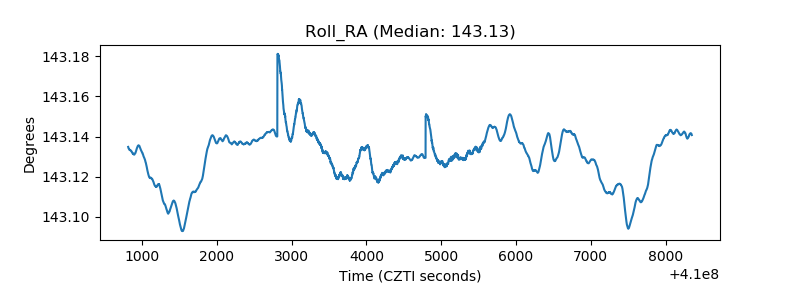 |
| Veto Counter | 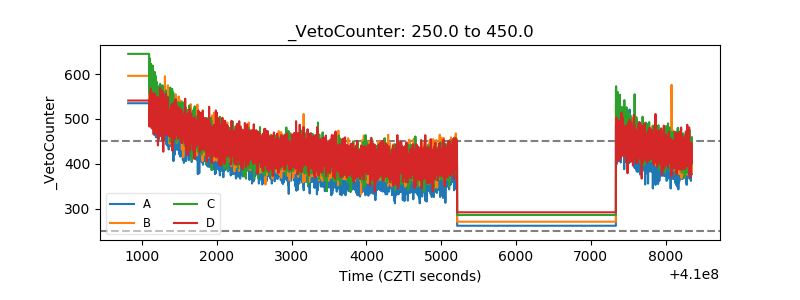 |