| Param | Original file | Final file |
|---|---|---|
| Filename | modeM0/AS1A12_054T04_9000005446_39217cztM0_level2.fits | modeM0/AS1A12_054T04_9000005446_39217cztM0_level2_quad_clean.evt |
| Size (bytes) | 544,487,040 | 81,552,960 |
| Size | 519.3 MB | 77.8 MB |
| Events in quadrant A | 2,978,443 | 641,210 |
| Events in quadrant B | 2,894,239 | 638,561 |
| Events in quadrant C | 2,501,935 | 597,197 |
| Events in quadrant D | 11,371,517 | 223,945 |
| Mode M9 | |||
|---|---|---|---|
| Quadrant | BADHDUFLAG | Total packets | Discarded packets |
| A | 0 | 28 | 0 |
| B | 0 | 28 | 0 |
| C | 0 | 28 | 0 |
| D | 0 | 29 | 0 |
| Mode M0 | |||
|---|---|---|---|
| Quadrant | BADHDUFLAG | Total packets | Discarded packets |
| A | 0 | 12006 | 3 |
| B | 0 | 12070 | 2 |
| C | 0 | 10585 | 2 |
| D | 0 | 37431 | 2 |
| Mode SS | |||
|---|---|---|---|
| Quadrant | BADHDUFLAG | Total packets | Discarded packets |
| A | 0 | 108 | 0 |
| B | 0 | 108 | 0 |
| C | 0 | 108 | 0 |
| D | 0 | 108 | 0 |
| Quadrant | Total seconds | Saturated seconds | Saturation percentage |
|---|---|---|---|
| A | 5256 | 47 | 0.894216% |
| B | 5256 | 120 | 2.283105% |
| C | 5256 | 5 | 0.095129% |
| D | 5256 | 3650 | 69.444444% |
Noise dominated data is calculated using 1-second bins in cleaned event files. If a bin has >2000 counts, and if more than 50% of those come from <1% of pixels, then it is considered to be noise-dominated and hence unusable.
| Quadrant | # 1 sec bins | Bins with >0 counts | Bins with >2000 counts | High rate bins dominated by noise | Noise dominated (total time) | Noise dominated (detector-on time) | Marked lightcurve |
|---|---|---|---|---|---|---|---|
| A | 7318 | 5257 | 39 | 39 | 0.53% | 0.74% | 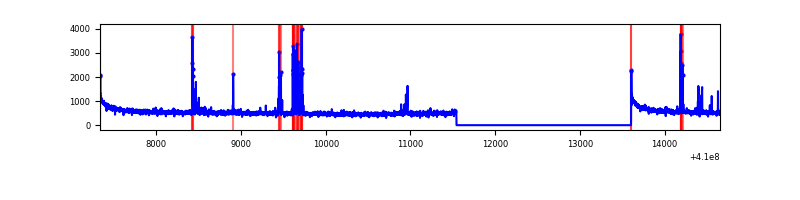 |
| B | 7318 | 5257 | 69 | 69 | 0.94% | 1.31% | 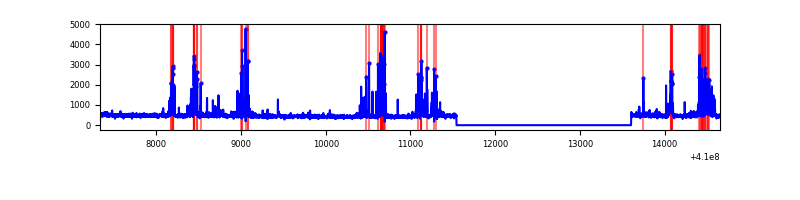 |
| C | 7318 | 5257 | 0 | 0 | 0.00% | 0.00% | 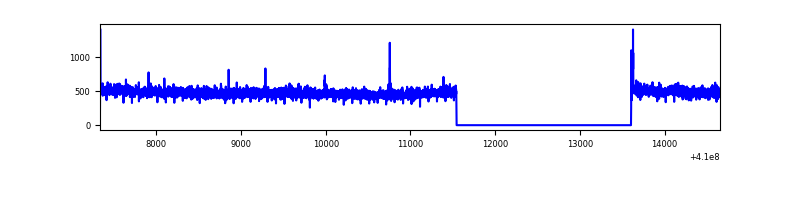 |
| D | 7318 | 5257 | 2789 | 2789 | 38.11% | 53.05% | 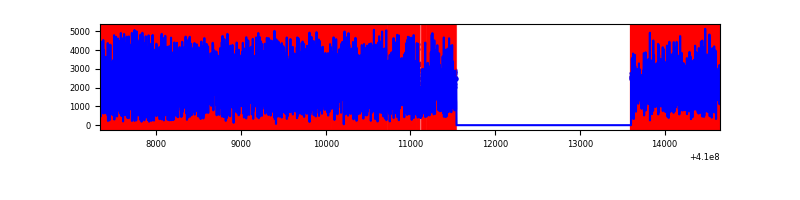 |
Top three noisy pixels from each quadrant. If the there are fewer than three noisy pixels in the level2.evt file, extra rows are filled as -1
| Pixel properties | Quadrant properties | ||||||
|---|---|---|---|---|---|---|---|
| Quadrant | DetID | PixID | Counts | Sigma | Mean | Median | Sigma |
| A | 10 | 83 | 444699 | 3649.84 | 601 | 588 | 121.7 |
| A | 13 | 248 | 168889 | 1383.15 | 601 | 588 | 121.7 |
| A | 0 | 8 | 23448 | 187.87 | 601 | 588 | 121.7 |
| B | 5 | 255 | 379708 | 3404.48 | 590 | 575 | 111.4 |
| B | 5 | 172 | 184628 | 1652.73 | 590 | 575 | 111.4 |
| B | 12 | 111 | 13514 | 116.19 | 590 | 575 | 111.4 |
| C | 15 | 214 | 218070 | 1606.01 | 579 | 582 | 135.4 |
| C | 3 | 233 | 11066 | 77.42 | 579 | 582 | 135.4 |
| C | 0 | 10 | 6192 | 41.43 | 579 | 582 | 135.4 |
| D | 12 | 235 | 9312726 | 97518.03 | 390 | 377 | 95.5 |
| D | 2 | 249 | 293033 | 3064.67 | 390 | 377 | 95.5 |
| D | 1 | 47 | 98997 | 1032.74 | 390 | 377 | 95.5 |
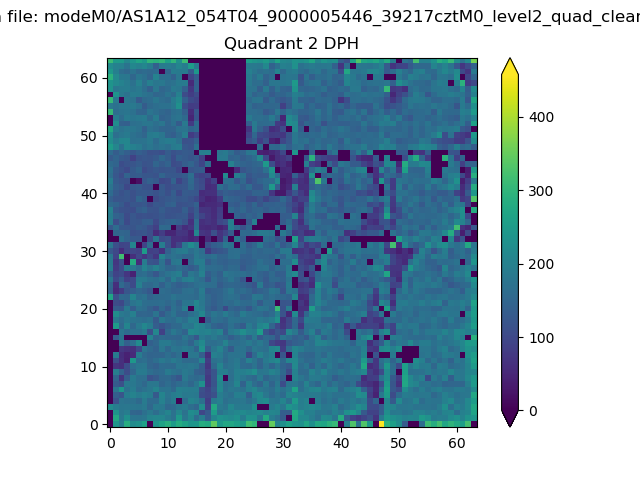
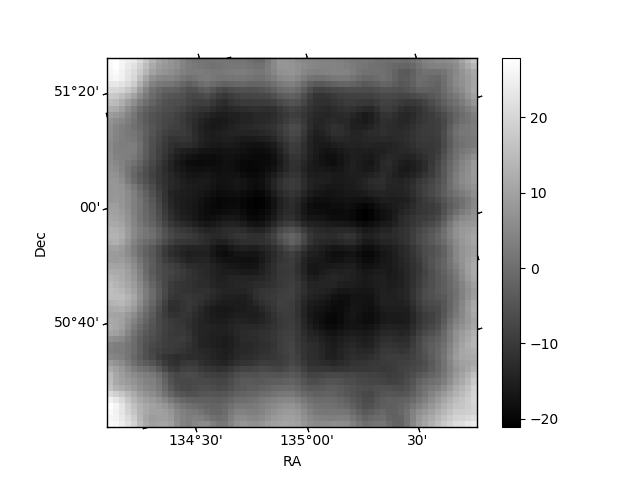
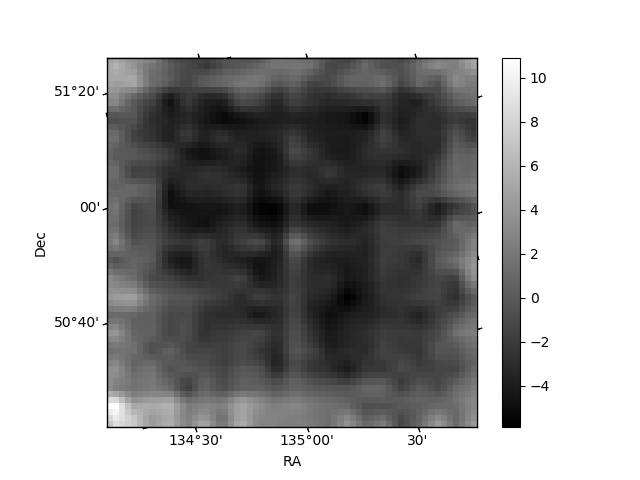
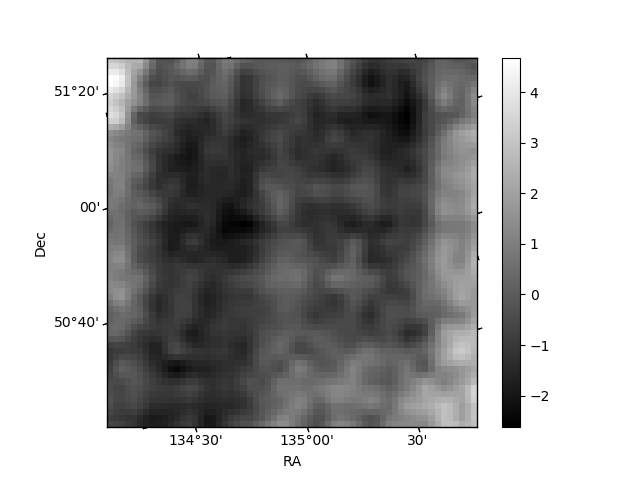
Histogram calculated using DETX and DETY for each event in the final _common_clean file
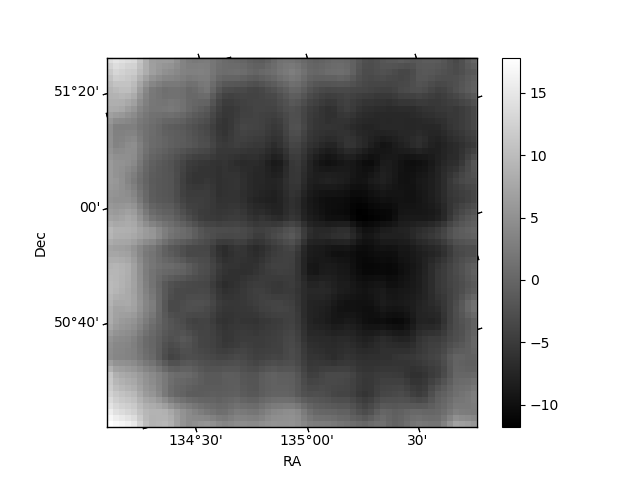
| Quadrant A | 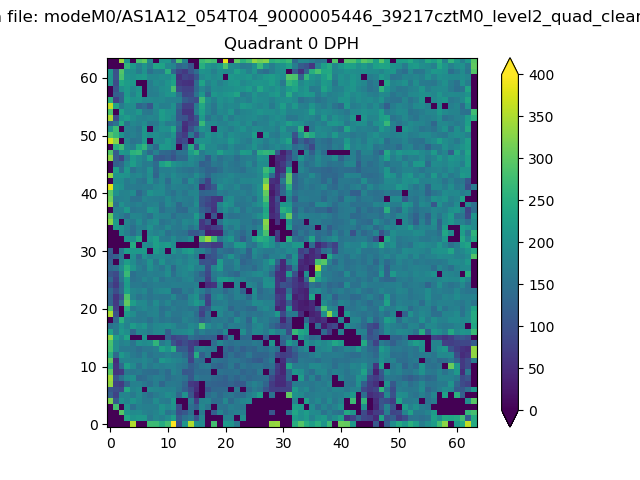 |
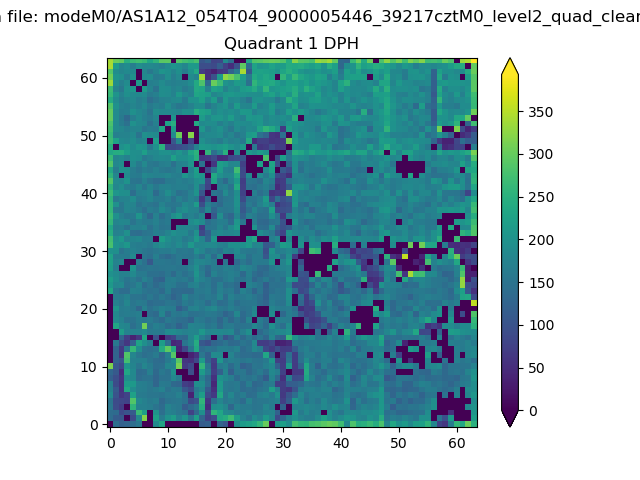 |
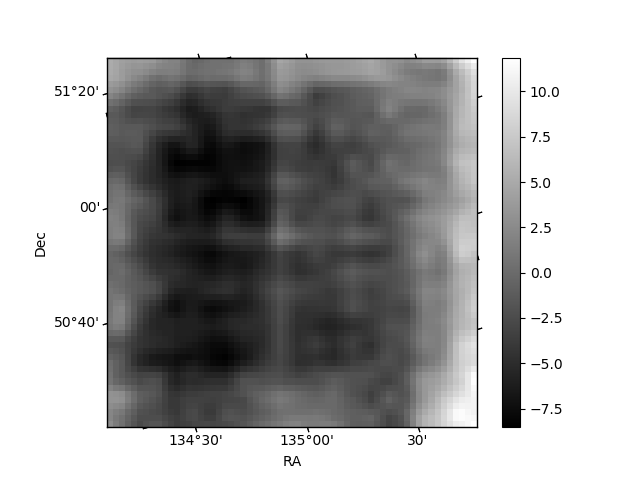
Quadrant B |
|---|---|---|---|
| Quadrant D | 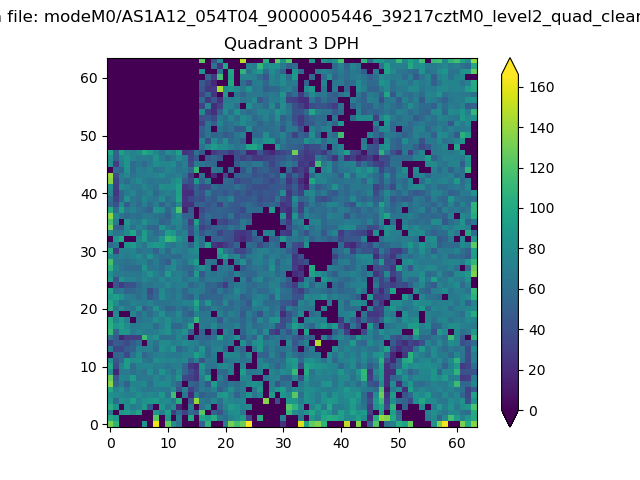 |
 |
Quadrant C |
| Plot type | Count rate plots | Images |
|---|---|---|
| Comparison with Poisson distribution Blue bars denote a histogram of data divided into 1 sec bins. Red curve is a Poisson curve with rate = median count rate of data. |
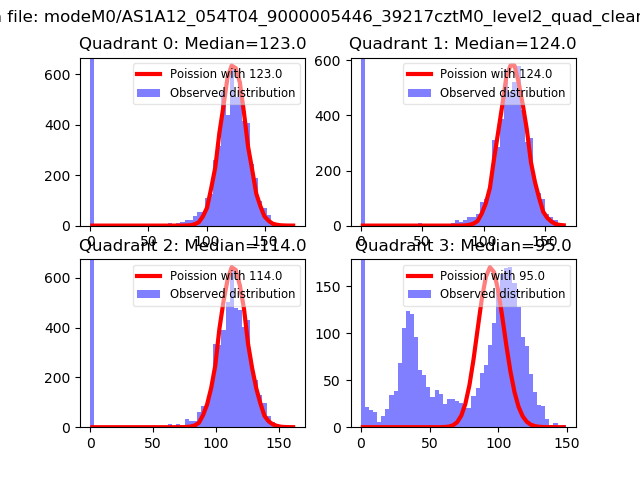 |
 |
| Quadrant-wise count rates Data is divided into 100 sec bins |
 |
|
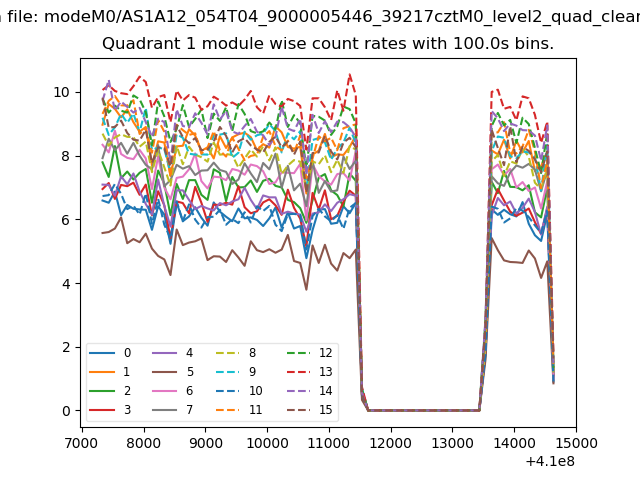
| Module-wise count rates for Quadrant A Data is divided into 100 sec bins |
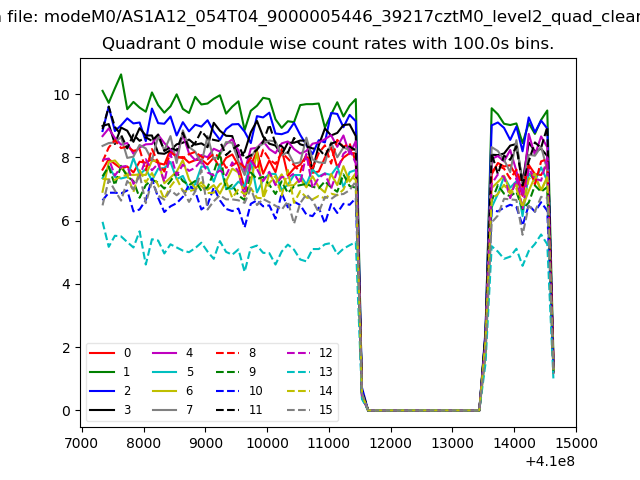 |
 |
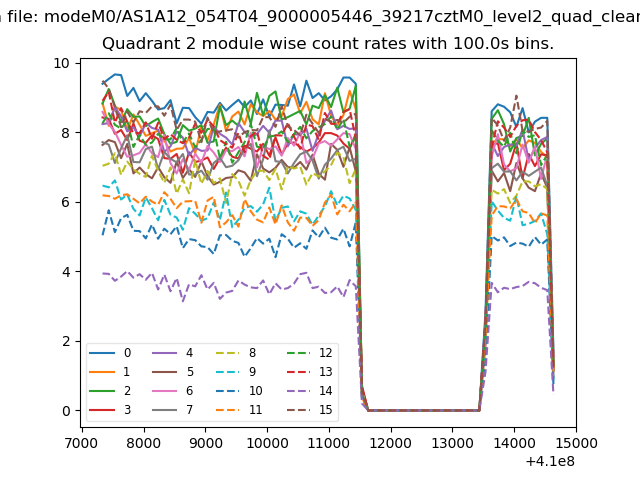
| Module-wise count rates for Quadrant B Data is divided into 100 sec bins |
 |
 |
| Module-wise count rates for Quadrant C Data is divided into 100 sec bins |
 |
 |
| Module-wise count rates for Quadrant D Data is divided into 100 sec bins |
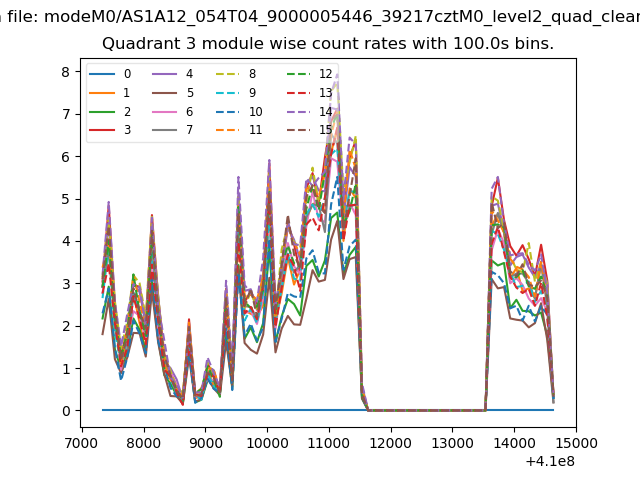 |
 |
| Parameter | Plot |
|---|---|
| CZT HV Monitor | 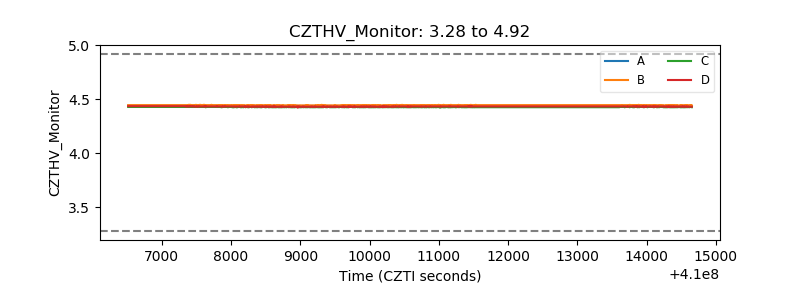 |
| D_VDD | 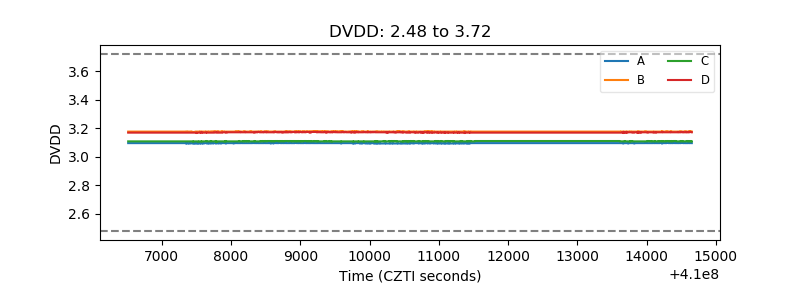 |
| Temperature 1 | 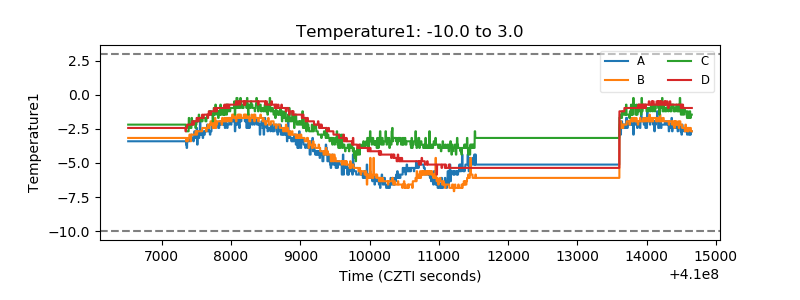 |
| Veto HV Monitor |  |
| Veto LLD | 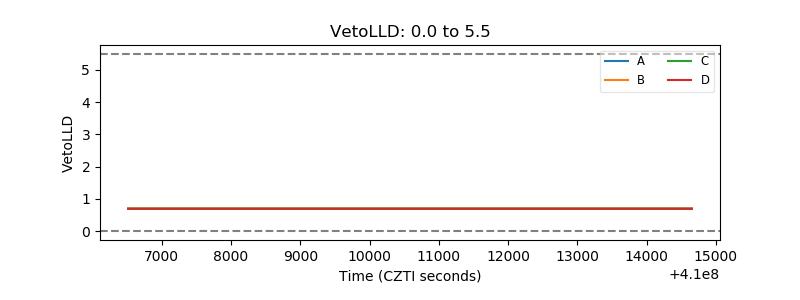 |
| Alpha Counter | 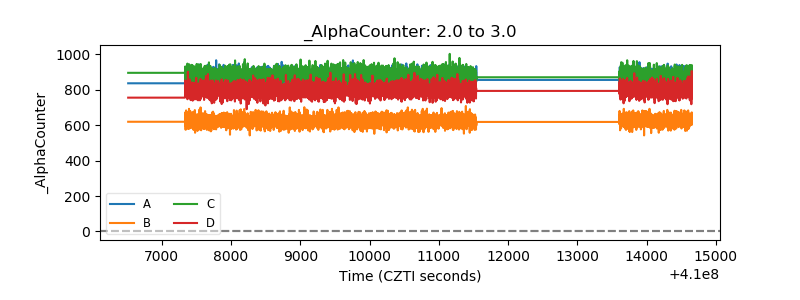 |
| _CPM_Rate |  |
| CZT Counter | 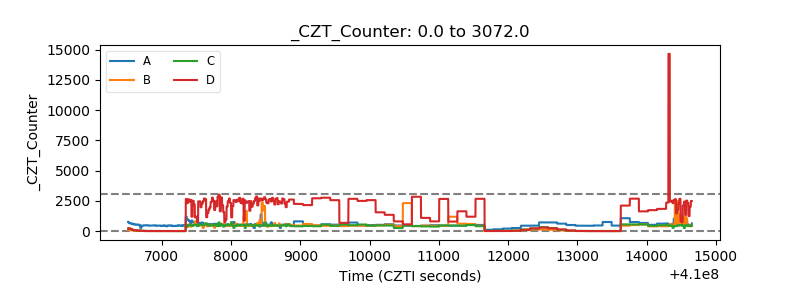 |
| +2.5 Volts monitor | 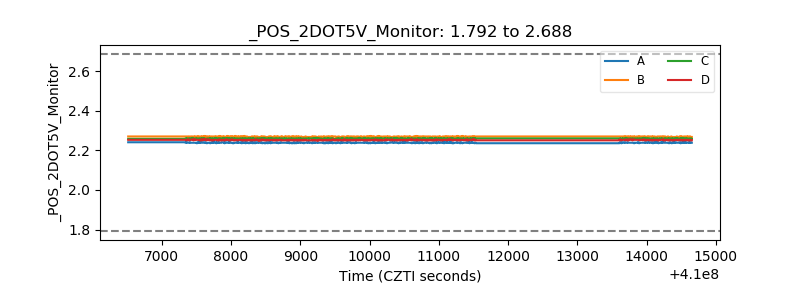 |
| +5 Volts monitor | 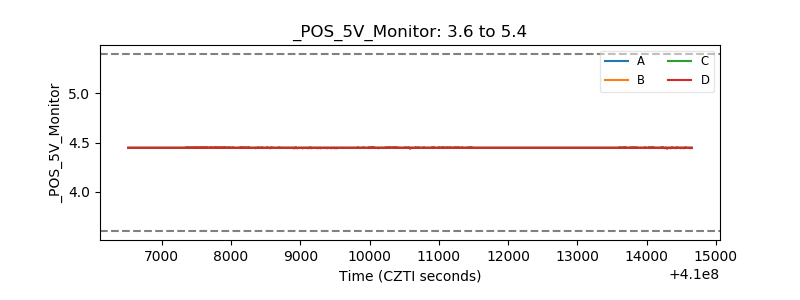 |
| _ROLL_ROT | 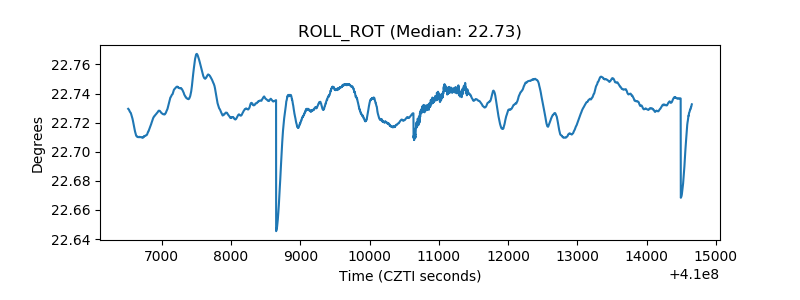 |
| _Roll_DEC | 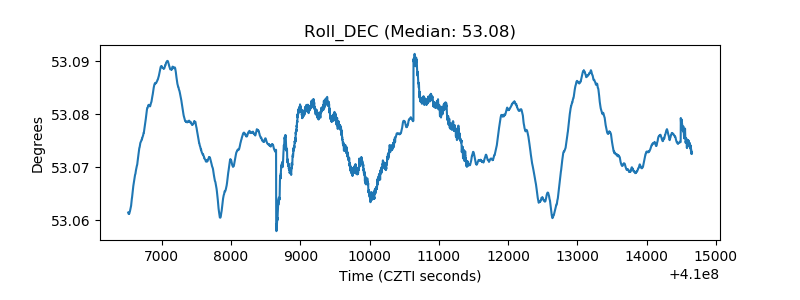 |
| _Roll_RA | 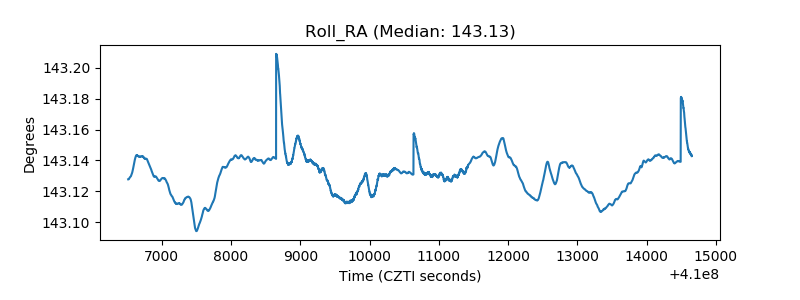 |
| Veto Counter | 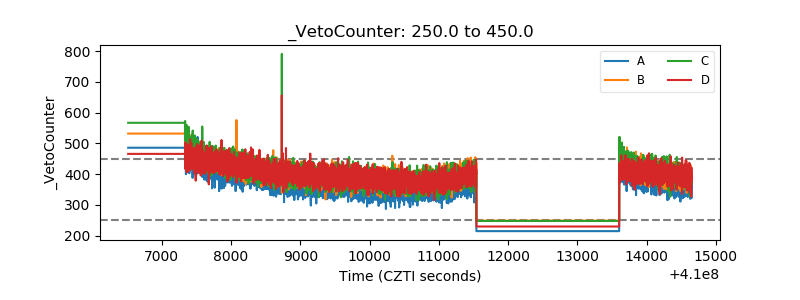 |