| Param | Original file | Final file |
|---|---|---|
| Filename | modeM0/AS1A12_054T04_9000005446_39218cztM0_level2.fits | modeM0/AS1A12_054T04_9000005446_39218cztM0_level2_quad_clean.evt |
| Size (bytes) | 521,377,920 | 82,535,040 |
| Size | 497.2 MB | 78.7 MB |
| Events in quadrant A | 2,871,174 | 623,060 |
| Events in quadrant B | 3,018,700 | 611,908 |
| Events in quadrant C | 2,499,095 | 582,518 |
| Events in quadrant D | 10,496,551 | 308,248 |
| Mode M9 | |||
|---|---|---|---|
| Quadrant | BADHDUFLAG | Total packets | Discarded packets |
| A | 0 | 20 | 0 |
| B | 0 | 20 | 0 |
| C | 0 | 20 | 0 |
| D | 0 | 21 | 0 |
| Mode M0 | |||
|---|---|---|---|
| Quadrant | BADHDUFLAG | Total packets | Discarded packets |
| A | 0 | 11871 | 3 |
| B | 0 | 12644 | 2 |
| C | 0 | 10778 | 2 |
| D | 0 | 34858 | 2 |
| Mode SS | |||
|---|---|---|---|
| Quadrant | BADHDUFLAG | Total packets | Discarded packets |
| A | 0 | 110 | 0 |
| B | 0 | 110 | 0 |
| C | 0 | 110 | 0 |
| D | 0 | 110 | 0 |
| Quadrant | Total seconds | Saturated seconds | Saturation percentage |
|---|---|---|---|
| A | 5323 | 50 | 0.939320% |
| B | 5323 | 156 | 2.930678% |
| C | 5323 | 8 | 0.150291% |
| D | 5323 | 2902 | 54.518129% |
Noise dominated data is calculated using 1-second bins in cleaned event files. If a bin has >2000 counts, and if more than 50% of those come from <1% of pixels, then it is considered to be noise-dominated and hence unusable.
| Quadrant | # 1 sec bins | Bins with >0 counts | Bins with >2000 counts | High rate bins dominated by noise | Noise dominated (total time) | Noise dominated (detector-on time) | Marked lightcurve |
|---|---|---|---|---|---|---|---|
| A | 7116 | 5324 | 26 | 26 | 0.37% | 0.49% | 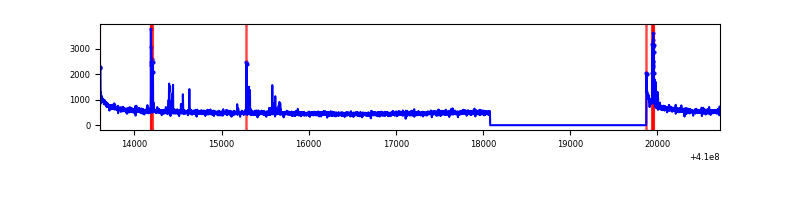 |
| B | 7116 | 5324 | 107 | 107 | 1.50% | 2.01% | 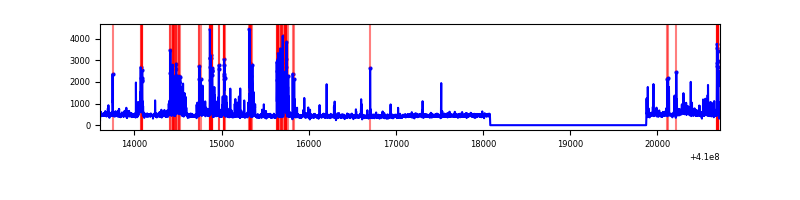 |
| C | 7116 | 5324 | 2 | 2 | 0.03% | 0.04% | 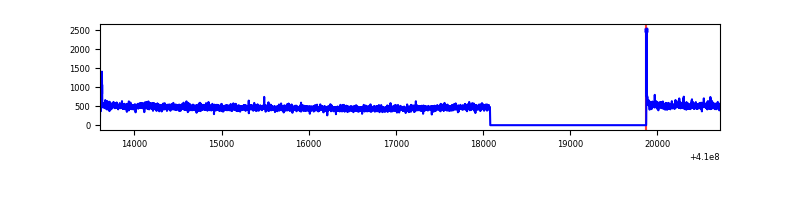 |
| D | 7116 | 5324 | 2438 | 2438 | 34.26% | 45.79% | 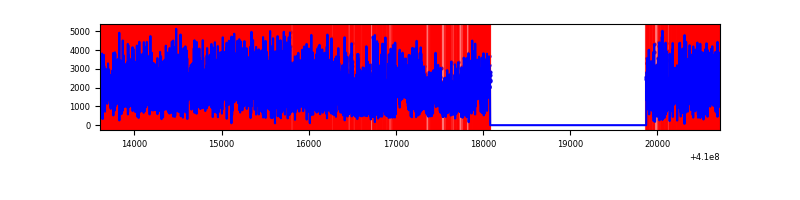 |
Top three noisy pixels from each quadrant. If the there are fewer than three noisy pixels in the level2.evt file, extra rows are filled as -1
| Pixel properties | Quadrant properties | ||||||
|---|---|---|---|---|---|---|---|
| Quadrant | DetID | PixID | Counts | Sigma | Mean | Median | Sigma |
| A | 10 | 83 | 441684 | 3681.83 | 590 | 578 | 119.8 |
| A | 13 | 248 | 118875 | 987.4 | 590 | 578 | 119.8 |
| A | 0 | 8 | 23454 | 190.94 | 590 | 578 | 119.8 |
| B | 5 | 255 | 514405 | 4645.16 | 579 | 564 | 110.6 |
| B | 5 | 172 | 199316 | 1796.73 | 579 | 564 | 110.6 |
| B | 0 | 190 | 23605 | 208.29 | 579 | 564 | 110.6 |
| C | 15 | 214 | 220032 | 1655.12 | 571 | 574 | 132.6 |
| C | 3 | 233 | 33890 | 251.26 | 571 | 574 | 132.6 |
| C | 0 | 10 | 9955 | 70.75 | 571 | 574 | 132.6 |
| D | 12 | 235 | 8046326 | 73144.06 | 450 | 437 | 110.0 |
| D | 1 | 47 | 257055 | 2332.88 | 450 | 437 | 110.0 |
| D | 2 | 249 | 192222 | 1743.49 | 450 | 437 | 110.0 |
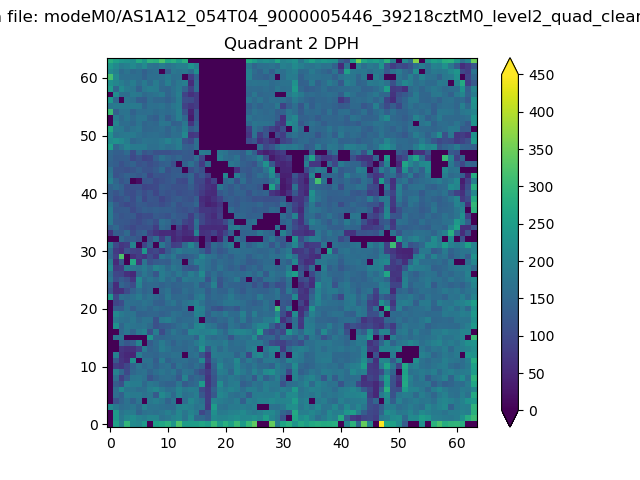
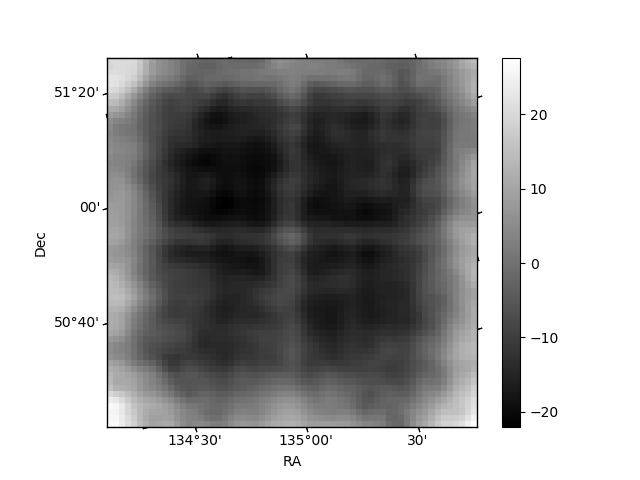
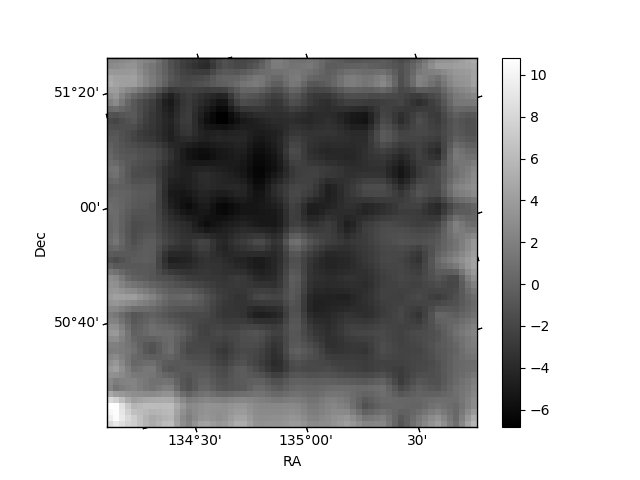
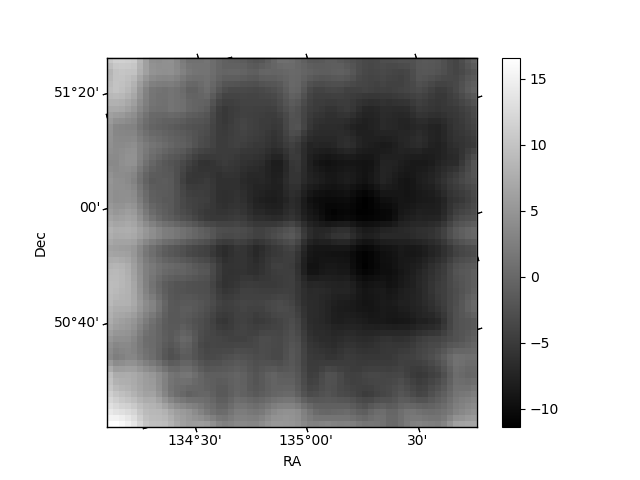
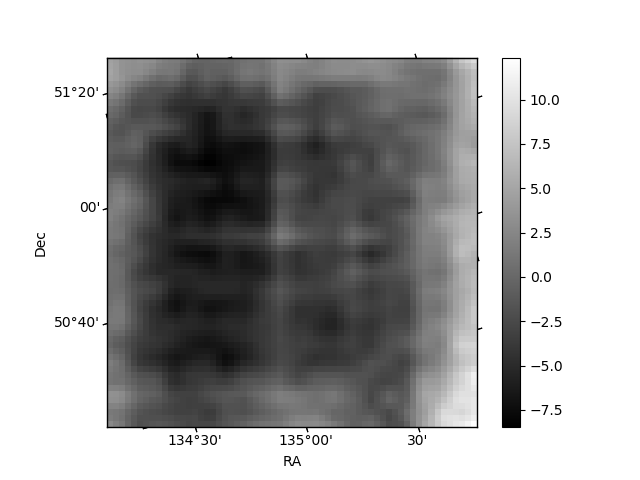
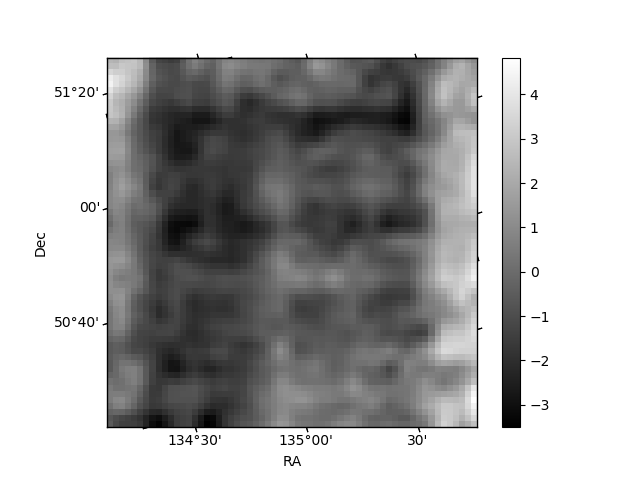
Histogram calculated using DETX and DETY for each event in the final _common_clean file
| Quadrant A | 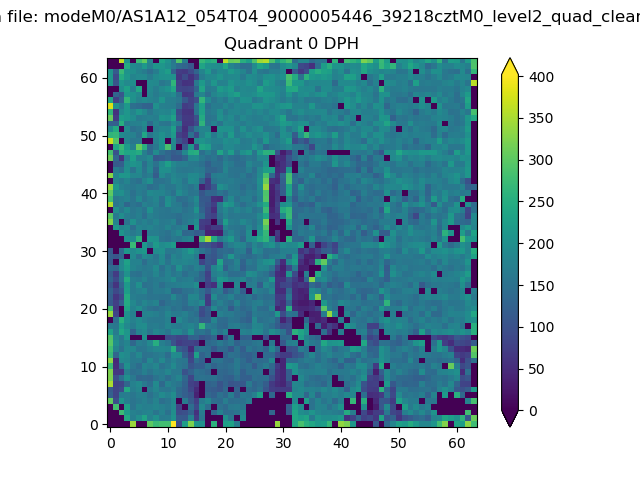 |
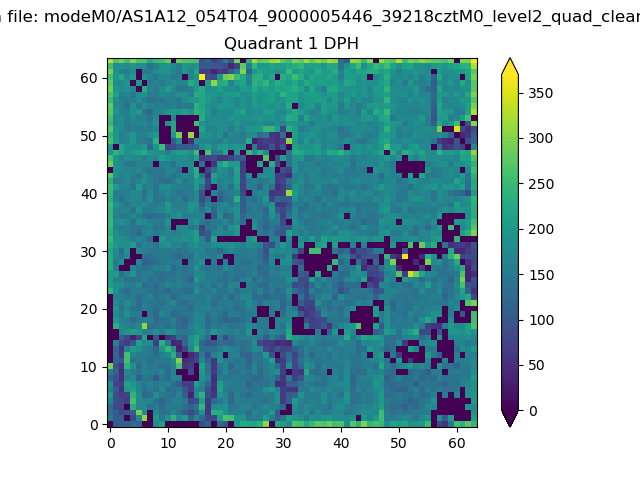 |
Quadrant B |
|---|---|---|---|
| Quadrant D | 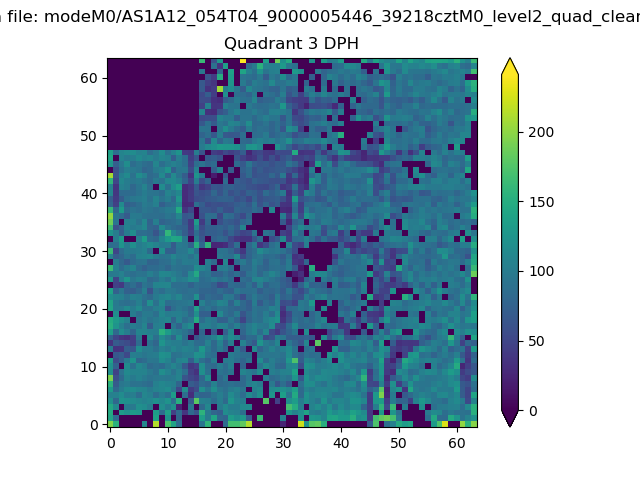 |
 |
Quadrant C |
| Plot type | Count rate plots | Images |
|---|---|---|
| Comparison with Poisson distribution Blue bars denote a histogram of data divided into 1 sec bins. Red curve is a Poisson curve with rate = median count rate of data. |
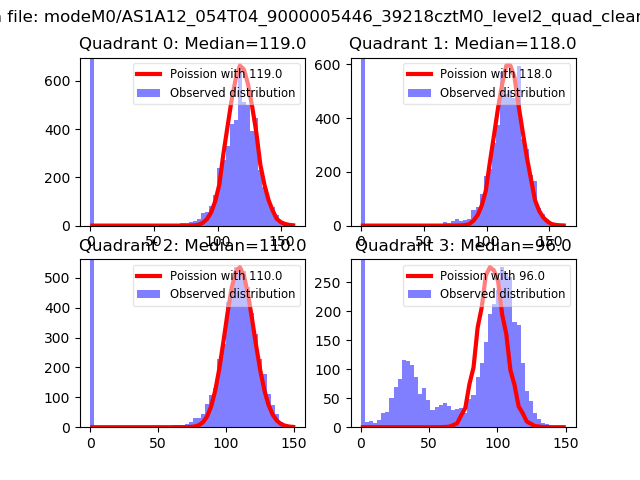 |
 |
| Quadrant-wise count rates Data is divided into 100 sec bins |
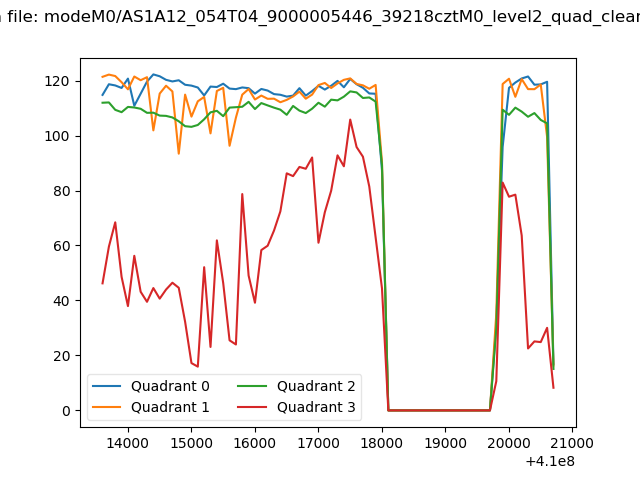 |
|
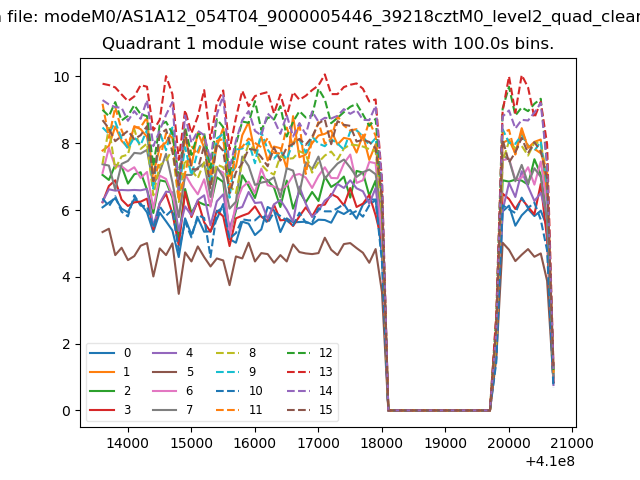
| Module-wise count rates for Quadrant A Data is divided into 100 sec bins |
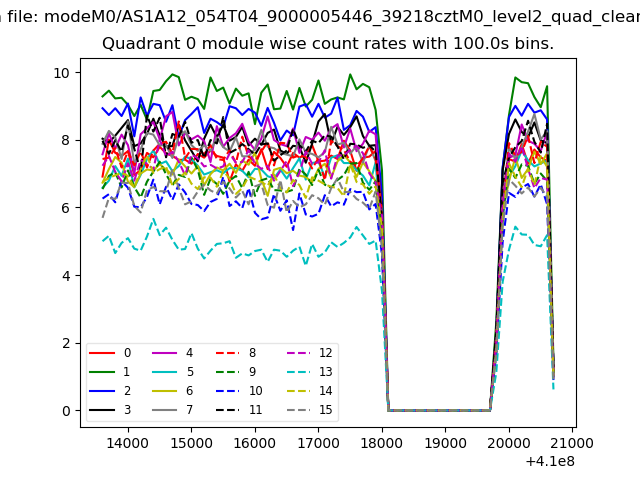 |
 |
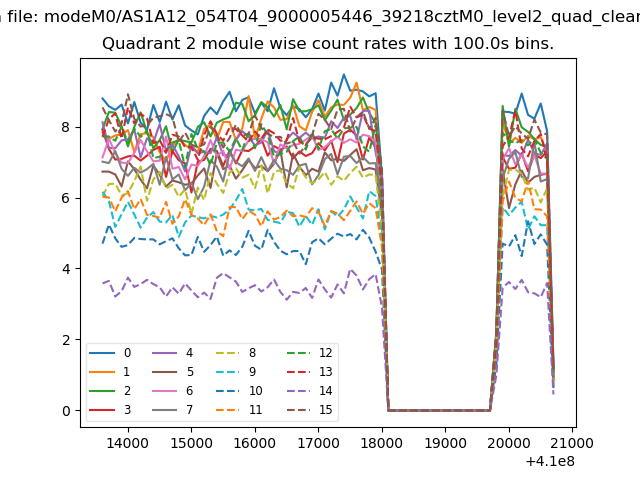
| Module-wise count rates for Quadrant B Data is divided into 100 sec bins |
 |
 |
| Module-wise count rates for Quadrant C Data is divided into 100 sec bins |
 |
 |
| Module-wise count rates for Quadrant D Data is divided into 100 sec bins |
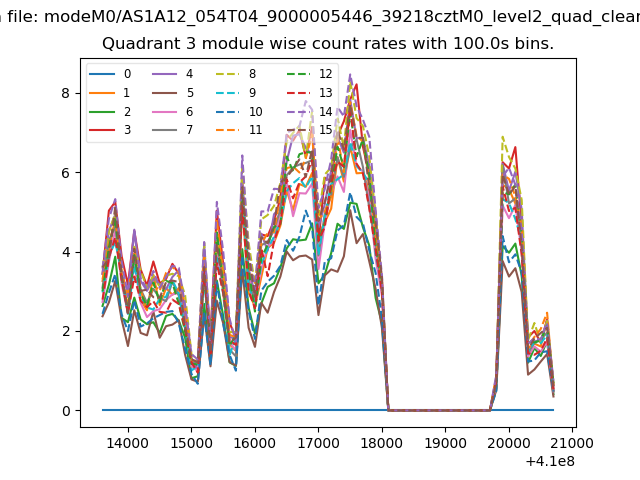 |
 |
| Parameter | Plot |
|---|---|
| CZT HV Monitor | 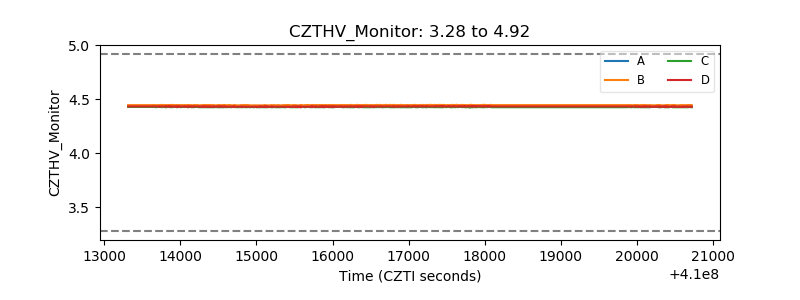 |
| D_VDD | 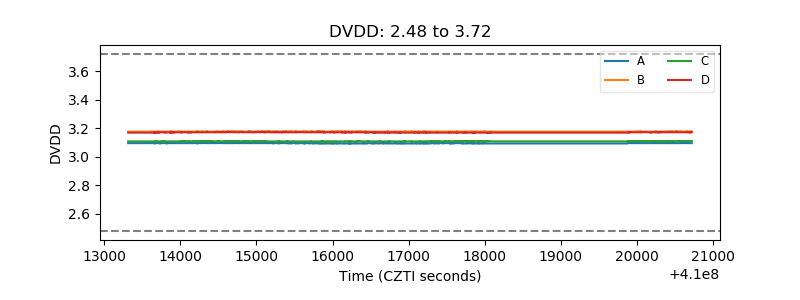 |
| Temperature 1 | 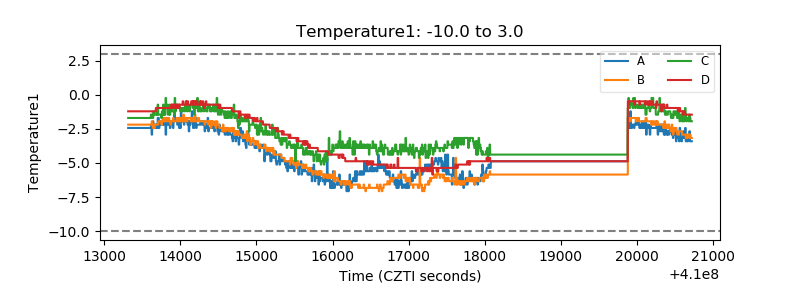 |
| Veto HV Monitor | 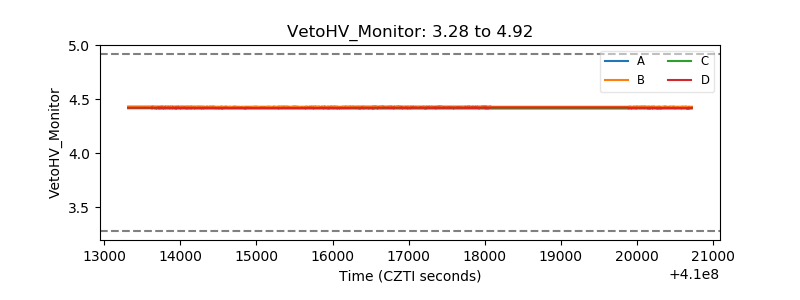 |
| Veto LLD | 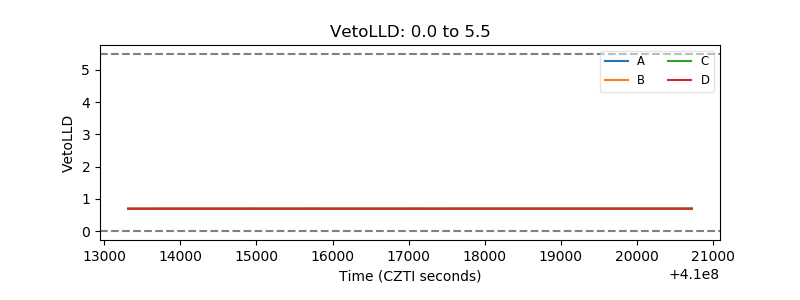 |
| Alpha Counter | 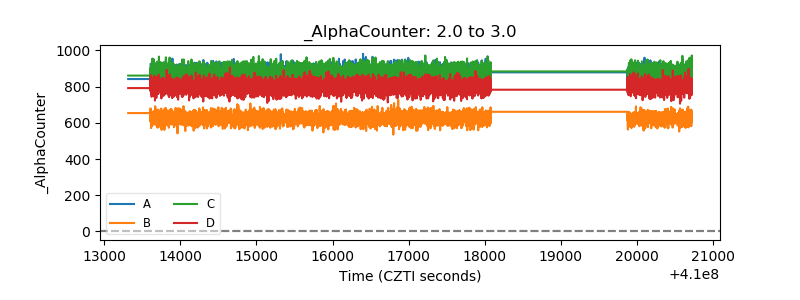 |
| _CPM_Rate | 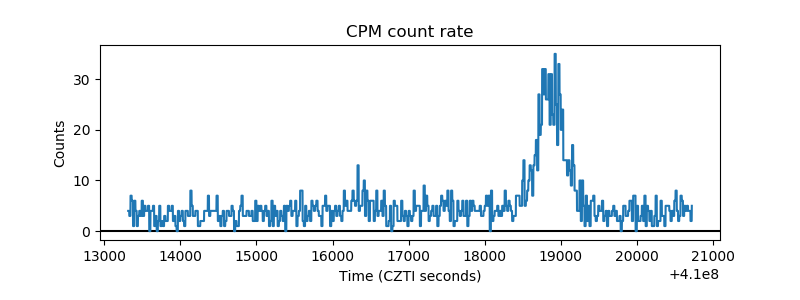 |
| CZT Counter | 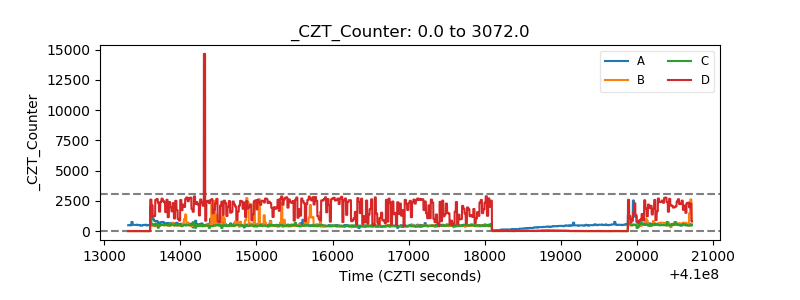 |
| +2.5 Volts monitor | 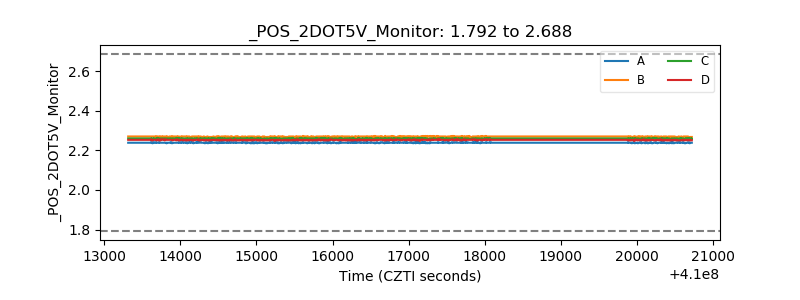 |
| +5 Volts monitor |  |
| _ROLL_ROT | 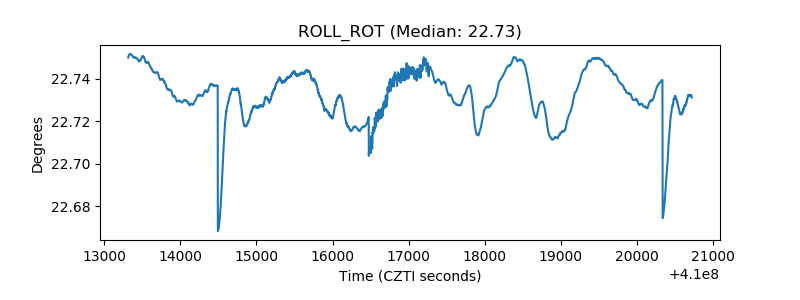 |
| _Roll_DEC | 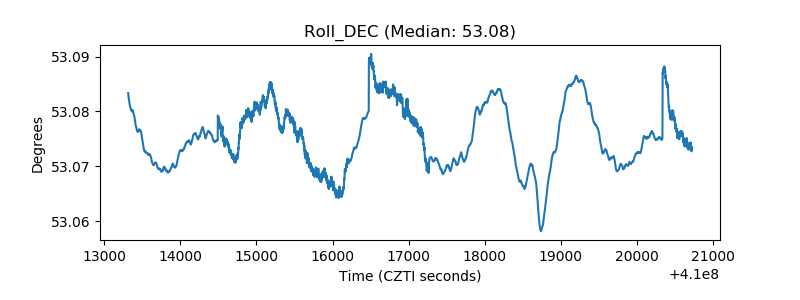 |
| _Roll_RA | 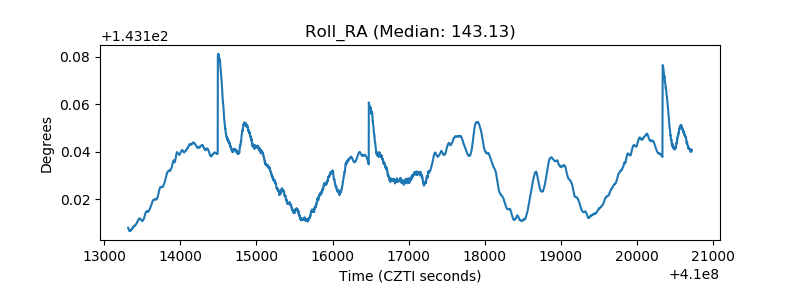 |
| Veto Counter | 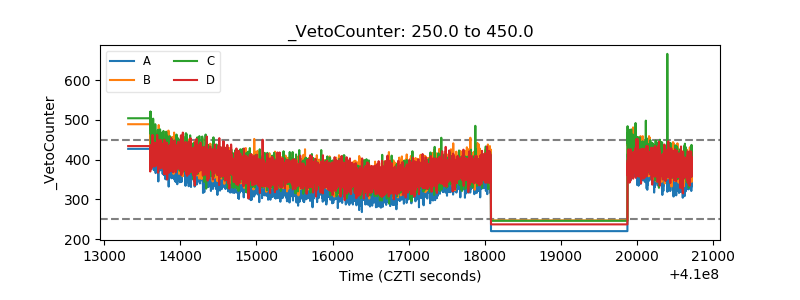 |