| Param | Original file | Final file |
|---|---|---|
| Filename | modeM0/AS1A12_054T04_9000005446_39219cztM0_level2.fits | modeM0/AS1A12_054T04_9000005446_39219cztM0_level2_quad_clean.evt |
| Size (bytes) | 588,519,360 | 80,303,040 |
| Size | 561.3 MB | 76.6 MB |
| Events in quadrant A | 2,995,316 | 640,854 |
| Events in quadrant B | 2,764,557 | 642,799 |
| Events in quadrant C | 2,694,006 | 606,875 |
| Events in quadrant D | 12,894,549 | 148,712 |
| Mode M9 | |||
|---|---|---|---|
| Quadrant | BADHDUFLAG | Total packets | Discarded packets |
| A | 0 | 23 | 0 |
| B | 0 | 23 | 0 |
| C | 0 | 23 | 0 |
| D | 0 | 24 | 0 |
| Mode M0 | |||
|---|---|---|---|
| Quadrant | BADHDUFLAG | Total packets | Discarded packets |
| A | 0 | 12489 | 3 |
| B | 0 | 12147 | 2 |
| C | 0 | 11551 | 2 |
| D | 0 | 42178 | 2 |
| Mode SS | |||
|---|---|---|---|
| Quadrant | BADHDUFLAG | Total packets | Discarded packets |
| A | 0 | 114 | 0 |
| B | 0 | 114 | 0 |
| C | 0 | 114 | 0 |
| D | 0 | 114 | 0 |
| Quadrant | Total seconds | Saturated seconds | Saturation percentage |
|---|---|---|---|
| A | 5606 | 52 | 0.927578% |
| B | 5606 | 57 | 1.016768% |
| C | 5606 | 8 | 0.142704% |
| D | 5606 | 4489 | 80.074920% |
Noise dominated data is calculated using 1-second bins in cleaned event files. If a bin has >2000 counts, and if more than 50% of those come from <1% of pixels, then it is considered to be noise-dominated and hence unusable.
| Quadrant | # 1 sec bins | Bins with >0 counts | Bins with >2000 counts | High rate bins dominated by noise | Noise dominated (total time) | Noise dominated (detector-on time) | Marked lightcurve |
|---|---|---|---|---|---|---|---|
| A | 7070 | 5607 | 31 | 31 | 0.44% | 0.55% | 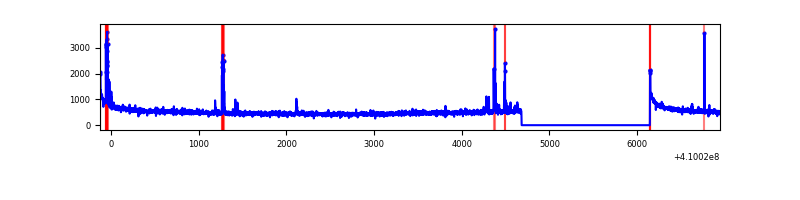 |
| B | 7070 | 5607 | 30 | 30 | 0.42% | 0.54% | 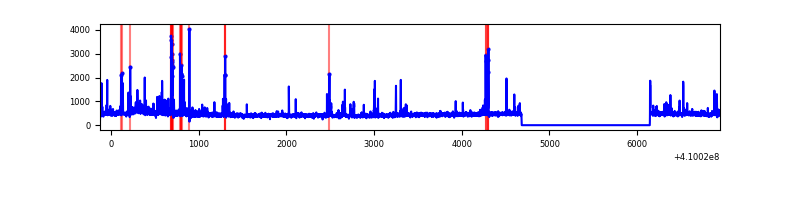 |
| C | 7070 | 5607 | 2 | 2 | 0.03% | 0.04% | 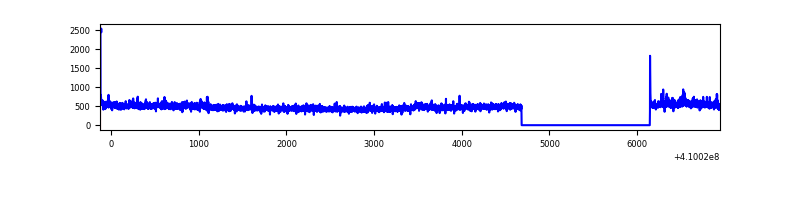 |
| D | 7070 | 5607 | 3522 | 3522 | 49.82% | 62.81% | 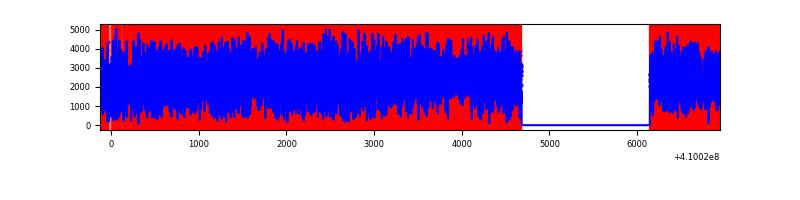 |
Top three noisy pixels from each quadrant. If the there are fewer than three noisy pixels in the level2.evt file, extra rows are filled as -1
| Pixel properties | Quadrant properties | ||||||
|---|---|---|---|---|---|---|---|
| Quadrant | DetID | PixID | Counts | Sigma | Mean | Median | Sigma |
| A | 10 | 83 | 450331 | 3564.35 | 618 | 605 | 126.2 |
| A | 13 | 248 | 145672 | 1149.74 | 618 | 605 | 126.2 |
| A | 13 | 254 | 7833 | 57.29 | 618 | 605 | 126.2 |
| B | 5 | 172 | 192053 | 1607.77 | 610 | 592 | 119.1 |
| B | 5 | 255 | 134734 | 1126.44 | 610 | 592 | 119.1 |
| B | 0 | 190 | 30501 | 251.15 | 610 | 592 | 119.1 |
| C | 15 | 214 | 236068 | 1685.11 | 598 | 602 | 139.7 |
| C | 3 | 233 | 96419 | 685.71 | 598 | 602 | 139.7 |
| C | 8 | 222 | 11283 | 76.44 | 598 | 602 | 139.7 |
| D | 12 | 235 | 8938849 | 97620.22 | 364 | 351 | 91.6 |
| D | 1 | 47 | 1851326 | 20215.1 | 364 | 351 | 91.6 |
| D | 2 | 249 | 463339 | 5056.44 | 364 | 351 | 91.6 |
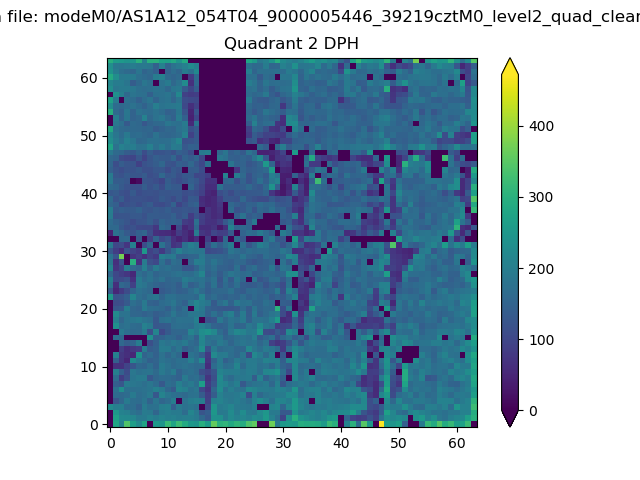
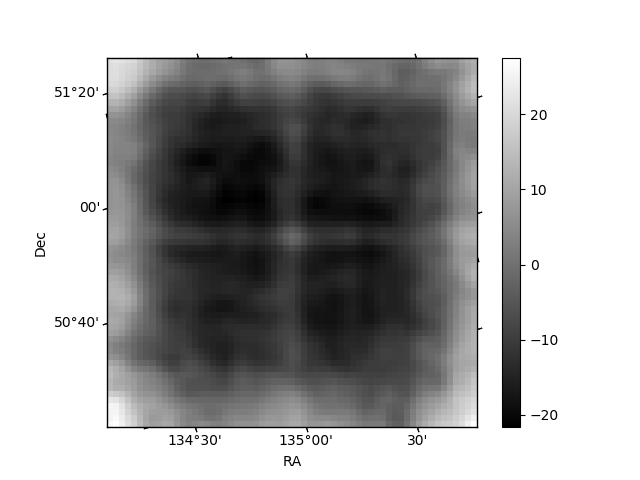
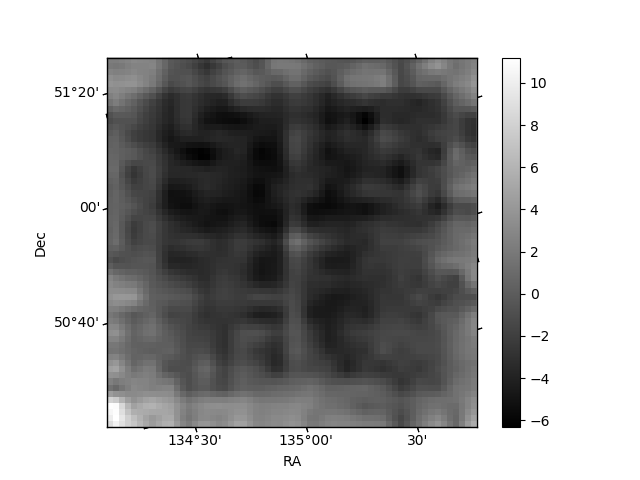
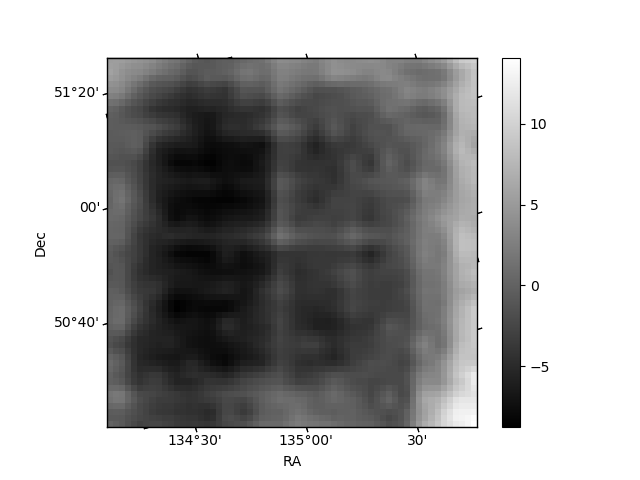
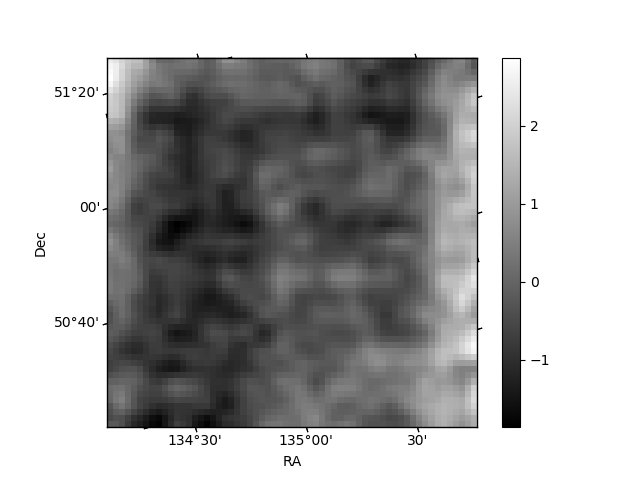
Histogram calculated using DETX and DETY for each event in the final _common_clean file
| Quadrant A | 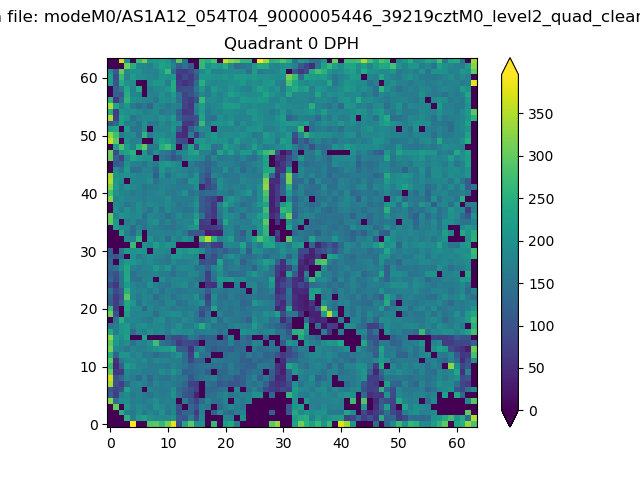 |
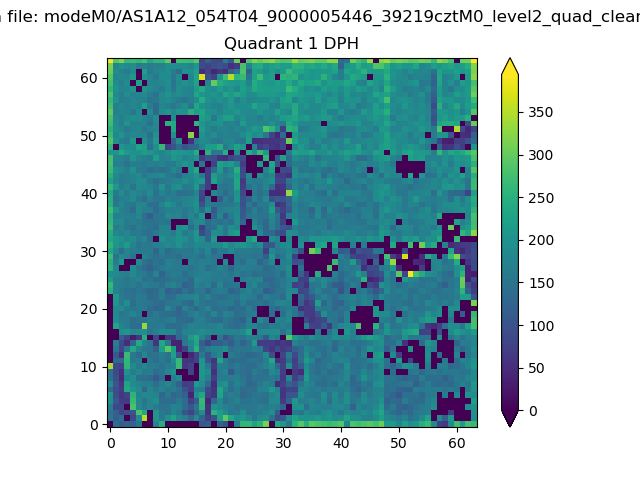 |
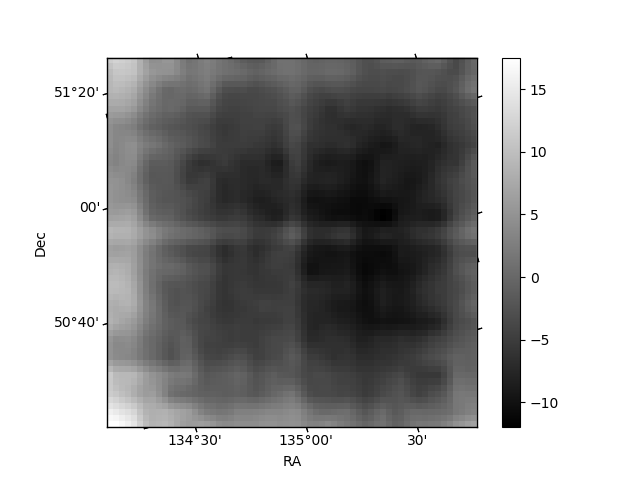
Quadrant B |
|---|---|---|---|
| Quadrant D | 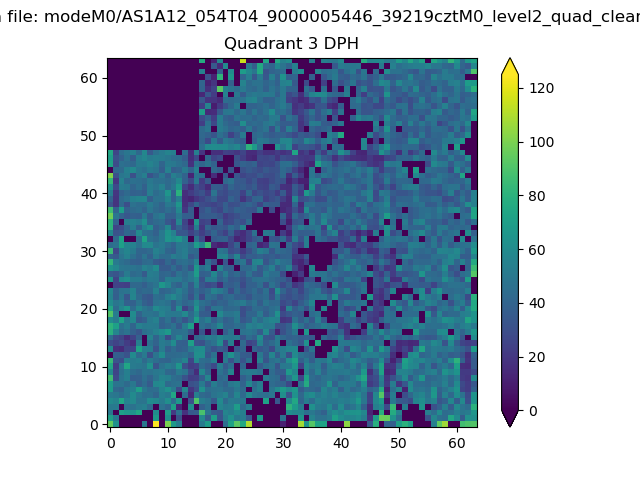 |
 |
Quadrant C |
| Plot type | Count rate plots | Images |
|---|---|---|
| Comparison with Poisson distribution Blue bars denote a histogram of data divided into 1 sec bins. Red curve is a Poisson curve with rate = median count rate of data. |
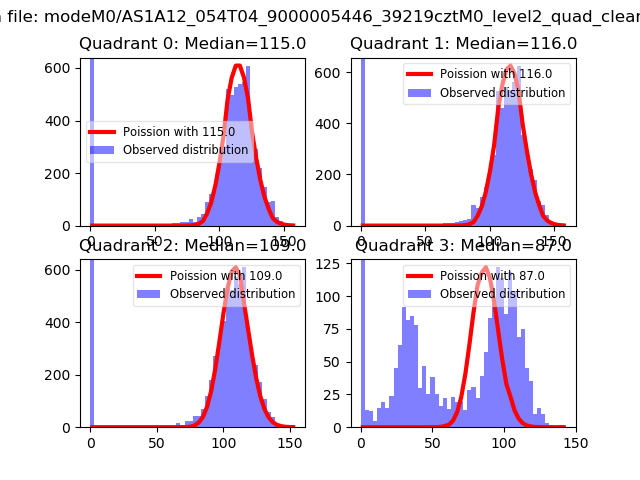 |
 |
| Quadrant-wise count rates Data is divided into 100 sec bins |
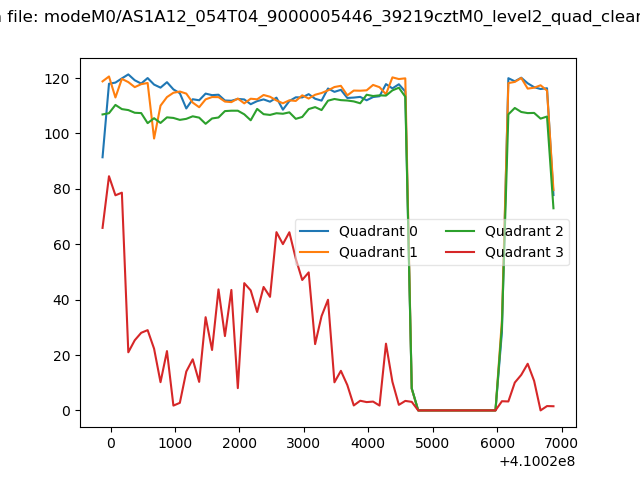 |
|
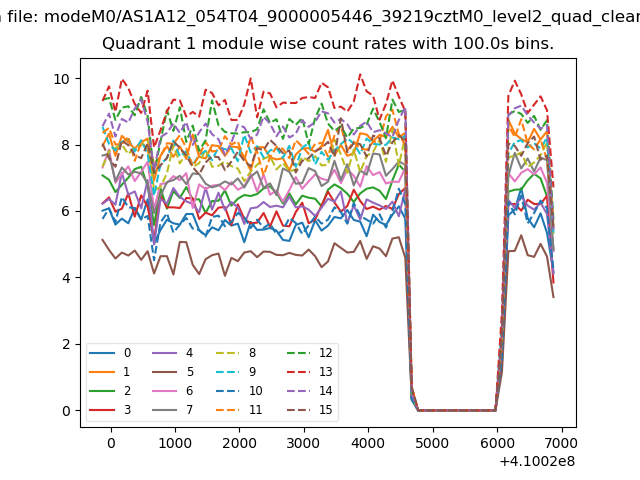
| Module-wise count rates for Quadrant A Data is divided into 100 sec bins |
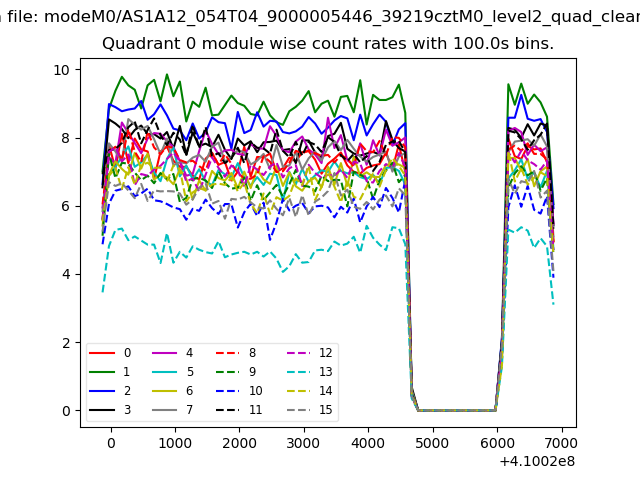 |
 |
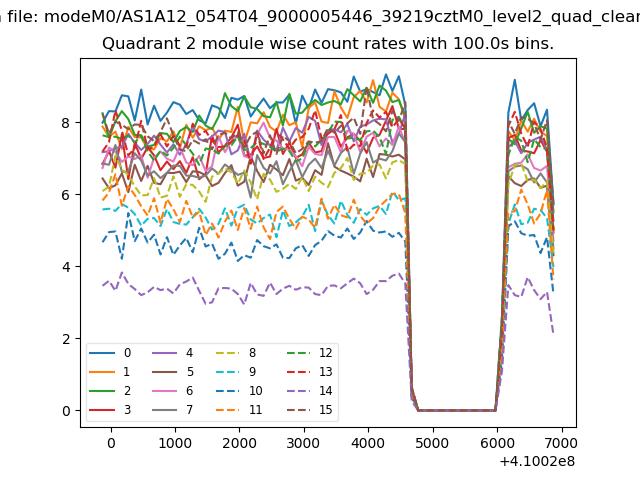
| Module-wise count rates for Quadrant B Data is divided into 100 sec bins |
 |
 |
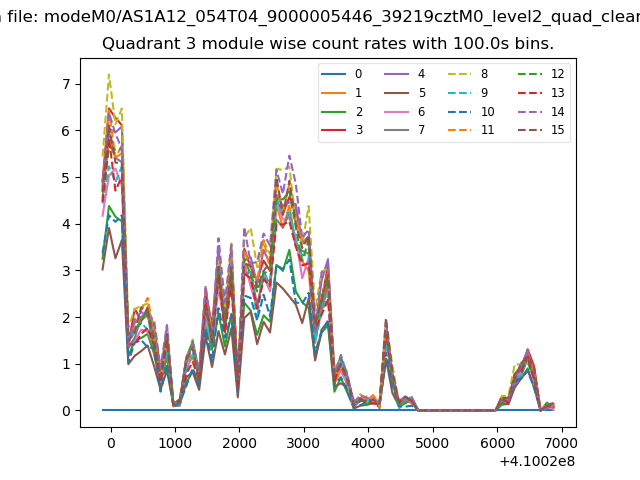
| Module-wise count rates for Quadrant C Data is divided into 100 sec bins |
 |
 |
| Module-wise count rates for Quadrant D Data is divided into 100 sec bins |
 |
 |
| Parameter | Plot |
|---|---|
| CZT HV Monitor | 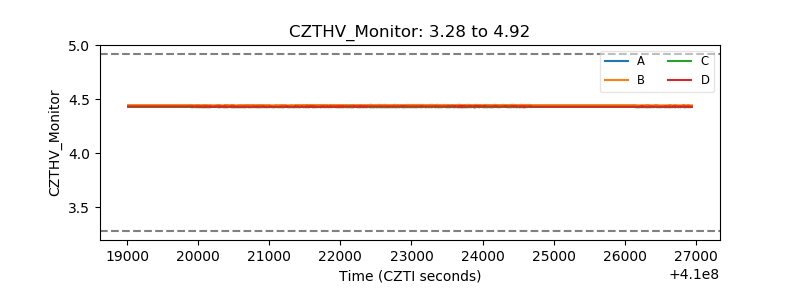 |
| D_VDD | 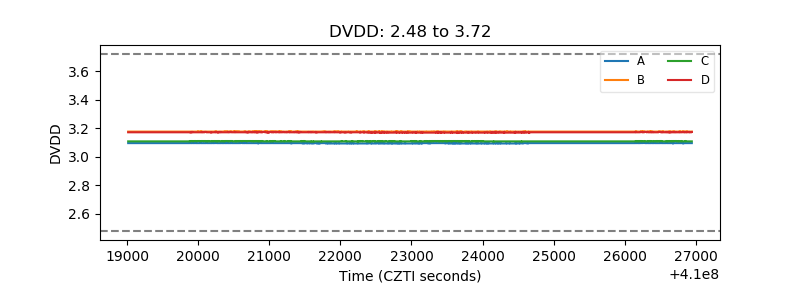 |
| Temperature 1 | 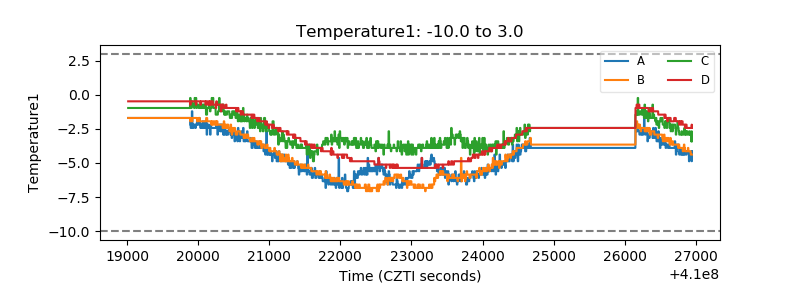 |
| Veto HV Monitor |  |
| Veto LLD | 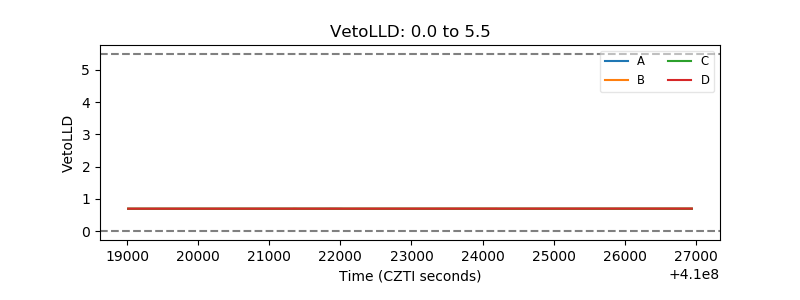 |
| Alpha Counter | 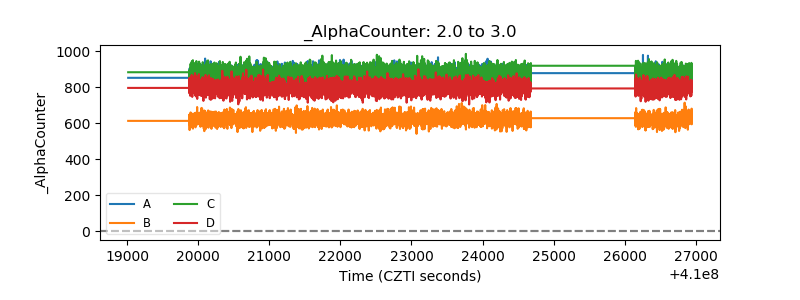 |
| _CPM_Rate | 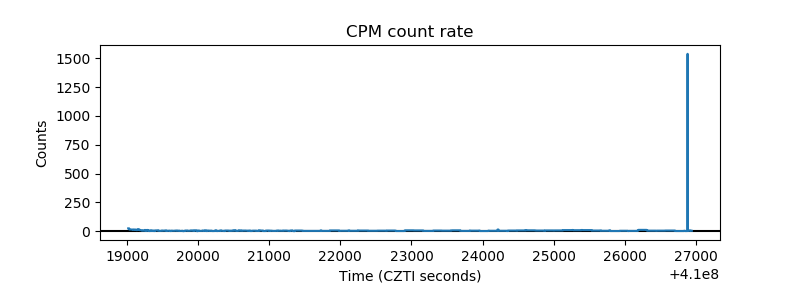 |
| CZT Counter | 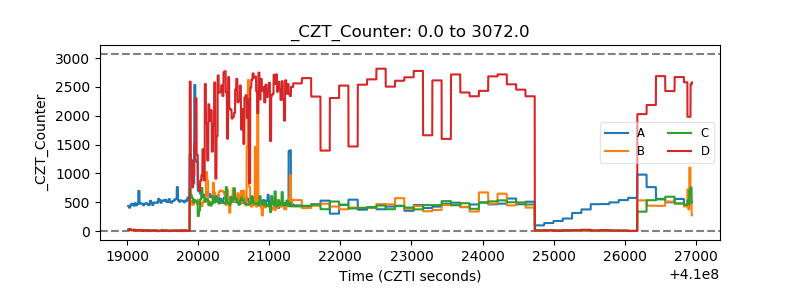 |
| +2.5 Volts monitor | 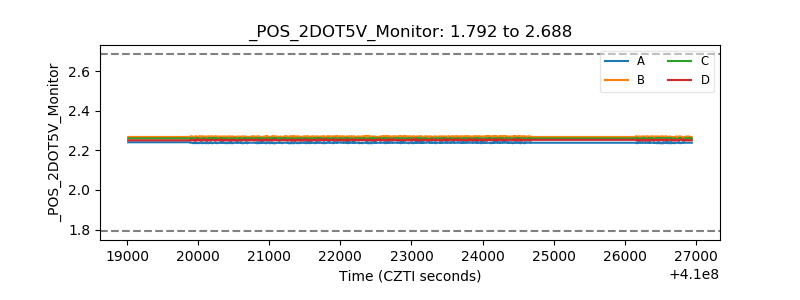 |
| +5 Volts monitor | 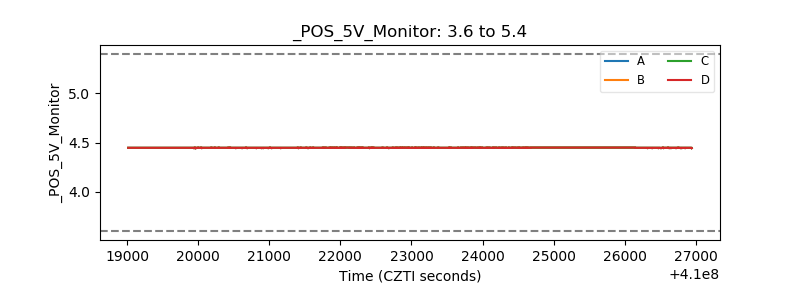 |
| _ROLL_ROT | 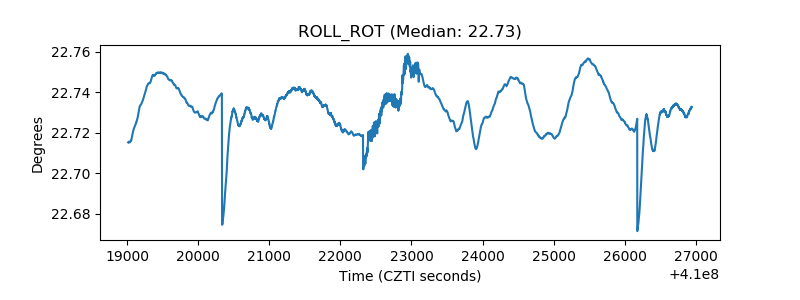 |
| _Roll_DEC | 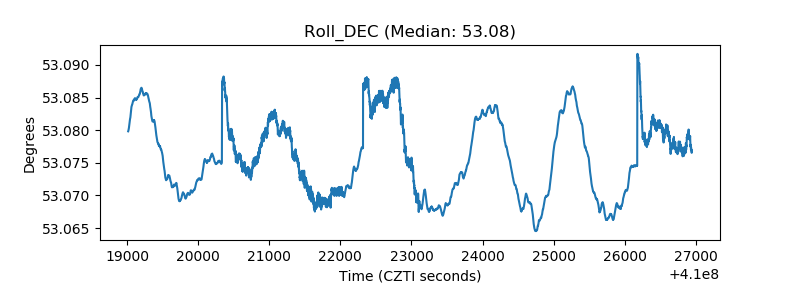 |
| _Roll_RA | 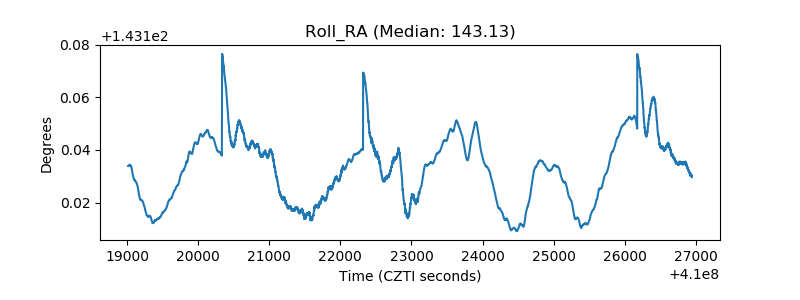 |
| Veto Counter | 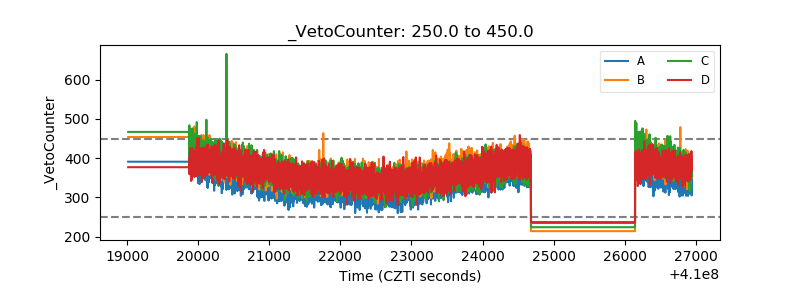 |