| Param | Original file | Final file |
|---|---|---|
| Filename | modeM0/AS1A12_054T04_9000005446_39220cztM0_level2.fits | modeM0/AS1A12_054T04_9000005446_39220cztM0_level2_quad_clean.evt |
| Size (bytes) | 625,239,360 | 89,366,400 |
| Size | 596.3 MB | 85.2 MB |
| Events in quadrant A | 3,202,072 | 699,034 |
| Events in quadrant B | 3,085,714 | 695,613 |
| Events in quadrant C | 3,075,522 | 666,589 |
| Events in quadrant D | 13,300,600 | 214,160 |
| Mode M9 | |||
|---|---|---|---|
| Quadrant | BADHDUFLAG | Total packets | Discarded packets |
| A | 0 | 29 | 0 |
| B | 0 | 29 | 0 |
| C | 0 | 29 | 0 |
| D | 0 | 29 | 0 |
| Mode M0 | |||
|---|---|---|---|
| Quadrant | BADHDUFLAG | Total packets | Discarded packets |
| A | 0 | 13420 | 3 |
| B | 0 | 13458 | 2 |
| C | 0 | 13171 | 2 |
| D | 0 | 43732 | 2 |
| Mode SS | |||
|---|---|---|---|
| Quadrant | BADHDUFLAG | Total packets | Discarded packets |
| A | 0 | 124 | 0 |
| B | 0 | 124 | 0 |
| C | 0 | 124 | 0 |
| D | 0 | 124 | 0 |
| Quadrant | Total seconds | Saturated seconds | Saturation percentage |
|---|---|---|---|
| A | 6174 | 37 | 0.599287% |
| B | 6174 | 99 | 1.603499% |
| C | 6174 | 5 | 0.080985% |
| D | 6174 | 4440 | 71.914480% |
Noise dominated data is calculated using 1-second bins in cleaned event files. If a bin has >2000 counts, and if more than 50% of those come from <1% of pixels, then it is considered to be noise-dominated and hence unusable.
| Quadrant | # 1 sec bins | Bins with >0 counts | Bins with >2000 counts | High rate bins dominated by noise | Noise dominated (total time) | Noise dominated (detector-on time) | Marked lightcurve |
|---|---|---|---|---|---|---|---|
| A | 8951 | 6176 | 23 | 23 | 0.26% | 0.37% | 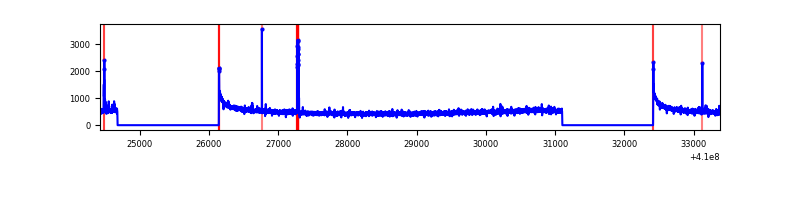 |
| B | 8951 | 6176 | 54 | 54 | 0.60% | 0.87% | 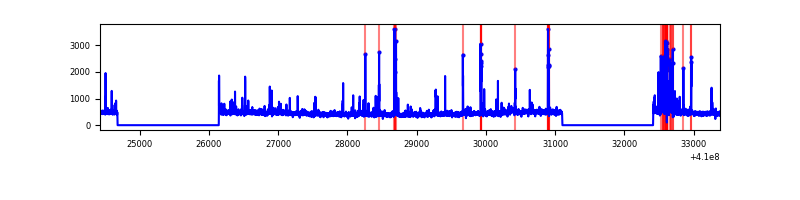 |
| C | 8951 | 6176 | 3 | 3 | 0.03% | 0.05% | 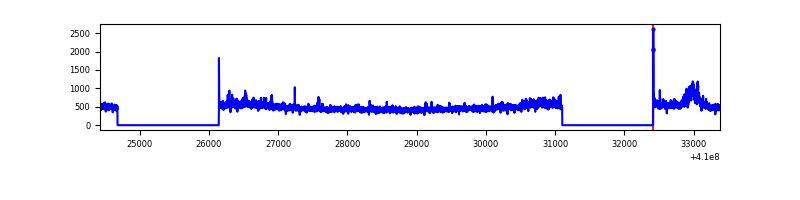 |
| D | 8951 | 6176 | 3433 | 3433 | 38.35% | 55.59% | 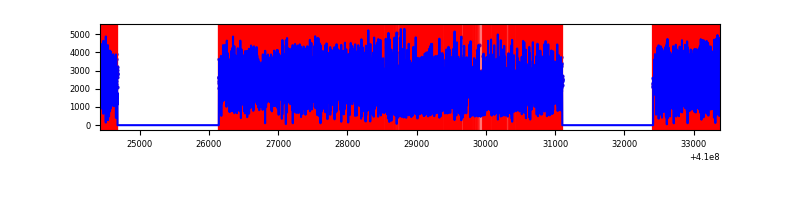 |
Top three noisy pixels from each quadrant. If the there are fewer than three noisy pixels in the level2.evt file, extra rows are filled as -1
| Pixel properties | Quadrant properties | ||||||
|---|---|---|---|---|---|---|---|
| Quadrant | DetID | PixID | Counts | Sigma | Mean | Median | Sigma |
| A | 10 | 83 | 485058 | 3514.11 | 681 | 665 | 137.8 |
| A | 13 | 248 | 80079 | 576.12 | 681 | 665 | 137.8 |
| A | 13 | 254 | 8291 | 55.32 | 681 | 665 | 137.8 |
| B | 5 | 172 | 188170 | 1430.18 | 669 | 650 | 131.1 |
| B | 5 | 255 | 174316 | 1324.51 | 669 | 650 | 131.1 |
| B | 0 | 190 | 61882 | 467.0 | 669 | 650 | 131.1 |
| C | 15 | 214 | 255711 | 1657.77 | 658 | 661 | 153.9 |
| C | 3 | 233 | 229996 | 1490.63 | 658 | 661 | 153.9 |
| C | 0 | 10 | 11354 | 69.5 | 658 | 661 | 153.9 |
| D | 12 | 235 | 9071613 | 89436.08 | 415 | 403 | 101.4 |
| D | 1 | 47 | 1818146 | 17921.73 | 415 | 403 | 101.4 |
| D | 2 | 249 | 428701 | 4222.73 | 415 | 403 | 101.4 |
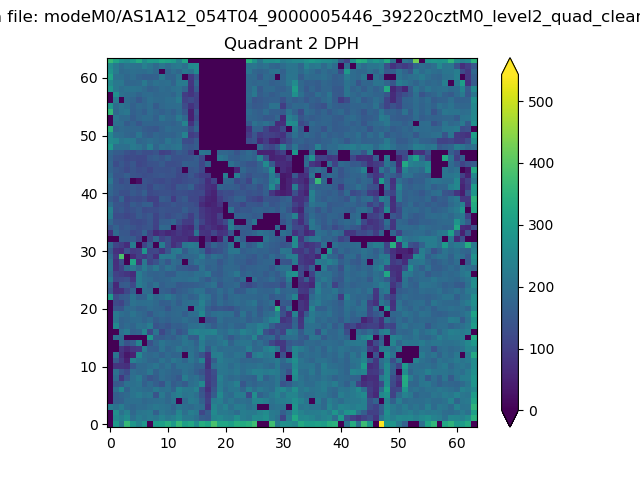
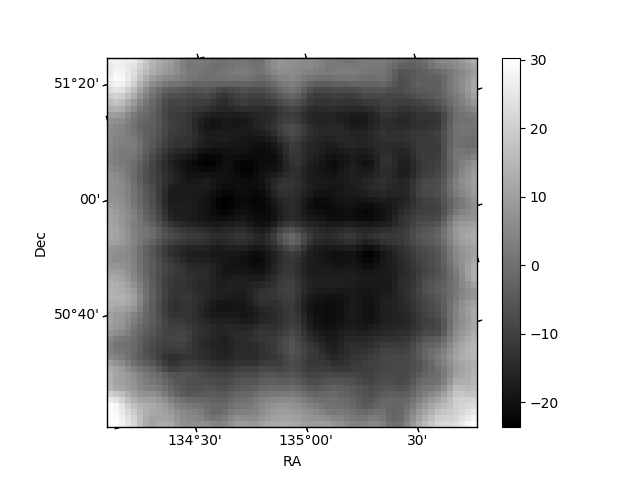
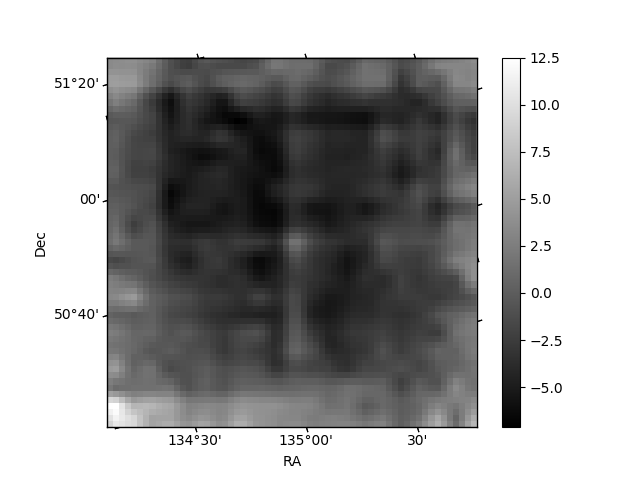
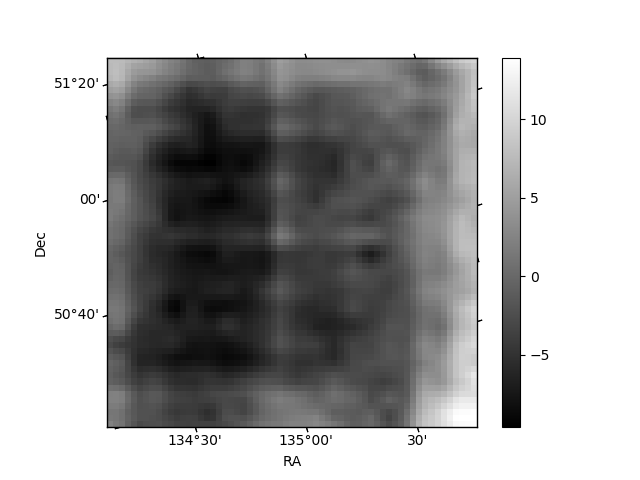
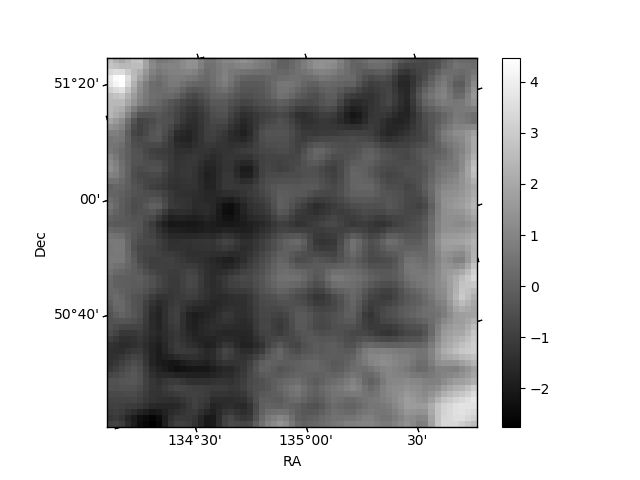
Histogram calculated using DETX and DETY for each event in the final _common_clean file
| Quadrant A | 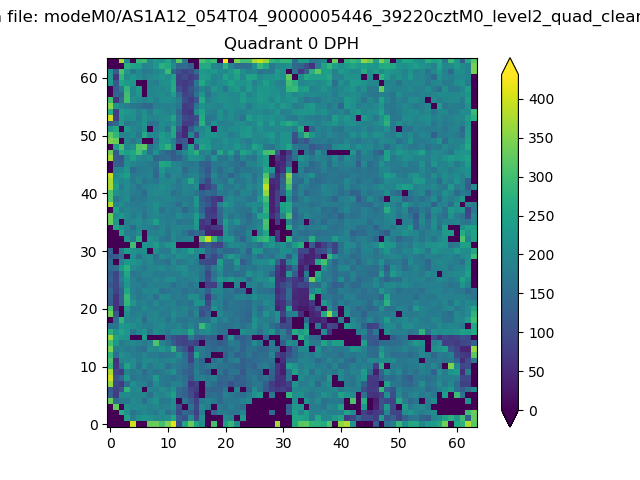 |
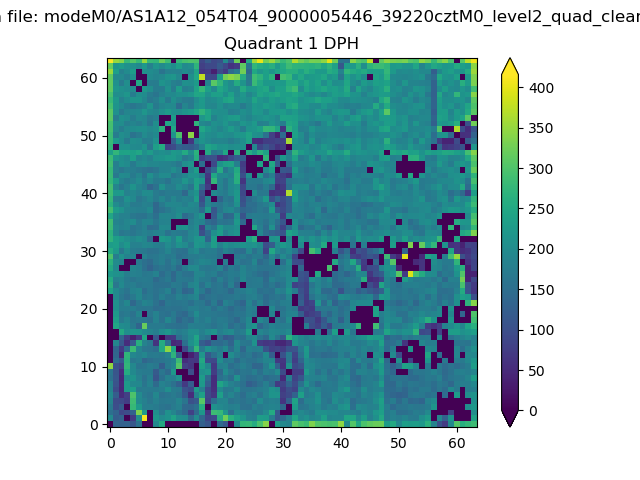 |
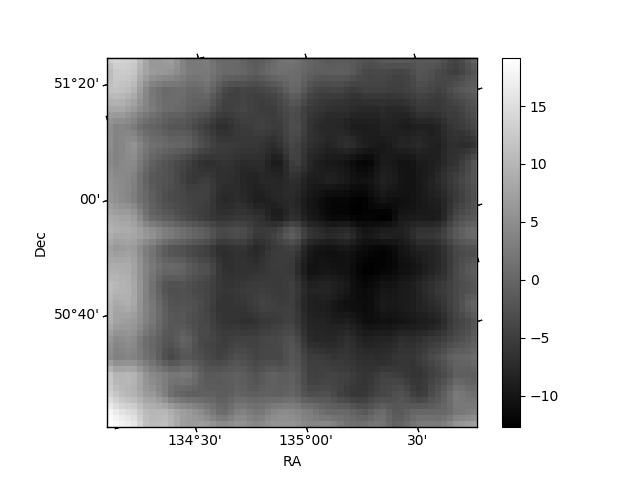
Quadrant B |
|---|---|---|---|
| Quadrant D | 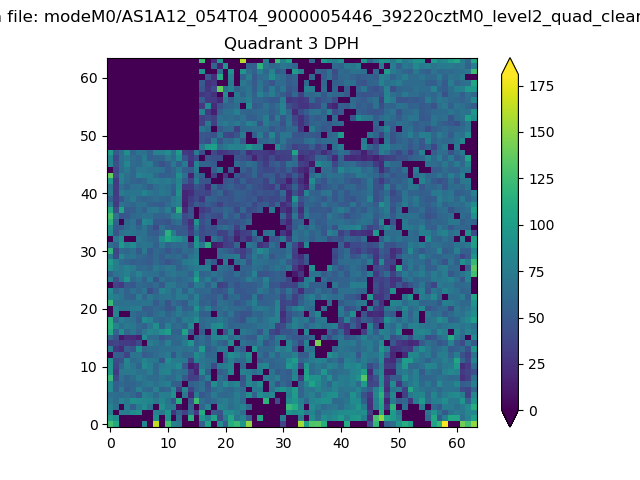 |
 |
Quadrant C |
| Plot type | Count rate plots | Images |
|---|---|---|
| Comparison with Poisson distribution Blue bars denote a histogram of data divided into 1 sec bins. Red curve is a Poisson curve with rate = median count rate of data. |
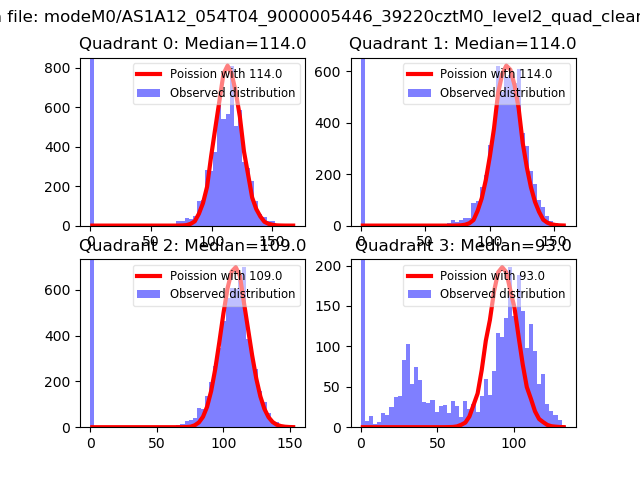 |
 |
| Quadrant-wise count rates Data is divided into 100 sec bins |
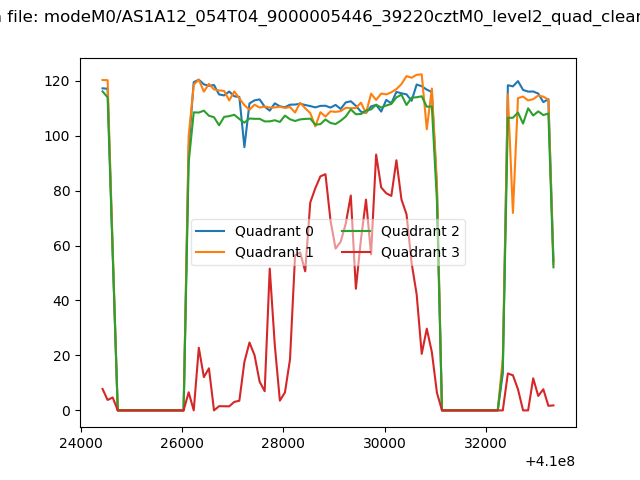 |
|
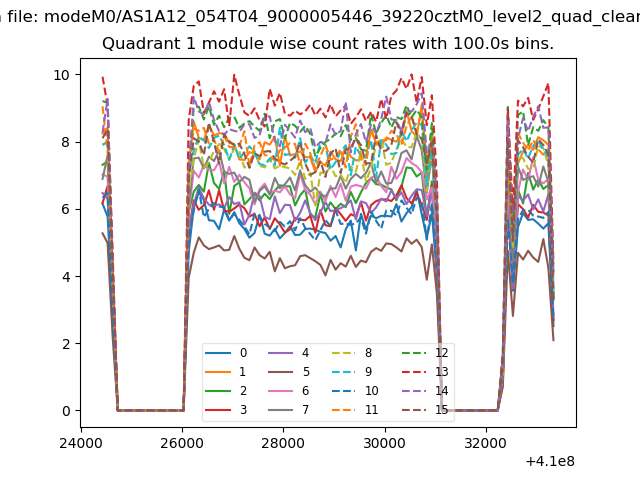
| Module-wise count rates for Quadrant A Data is divided into 100 sec bins |
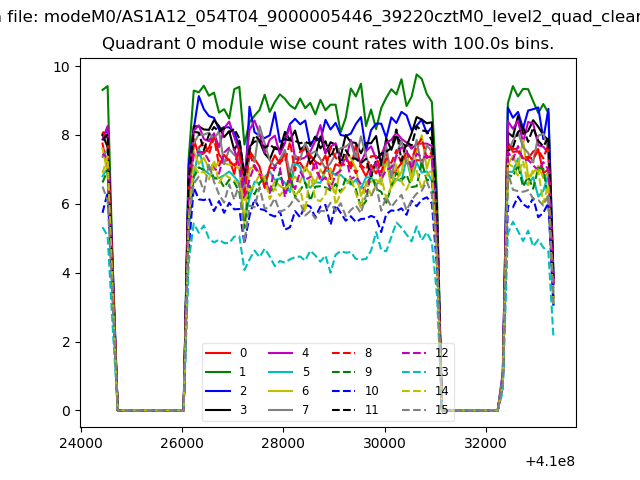 |
 |
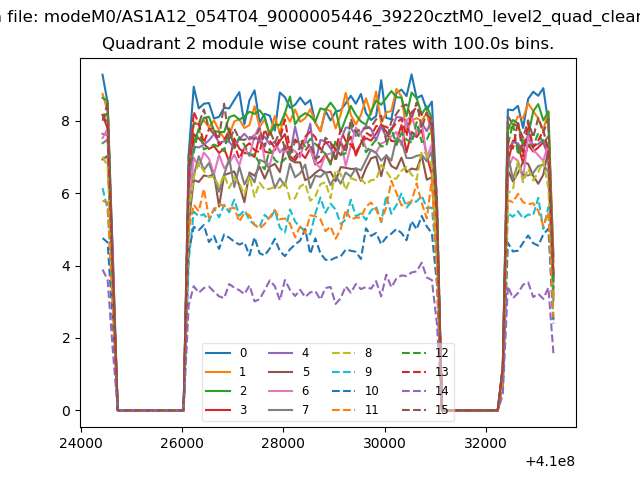
| Module-wise count rates for Quadrant B Data is divided into 100 sec bins |
 |
 |
| Module-wise count rates for Quadrant C Data is divided into 100 sec bins |
 |
 |
| Module-wise count rates for Quadrant D Data is divided into 100 sec bins |
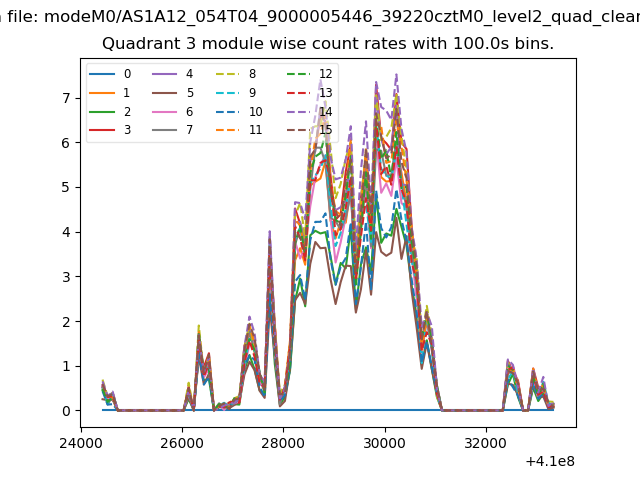 |
 |
| Parameter | Plot |
|---|---|
| CZT HV Monitor | 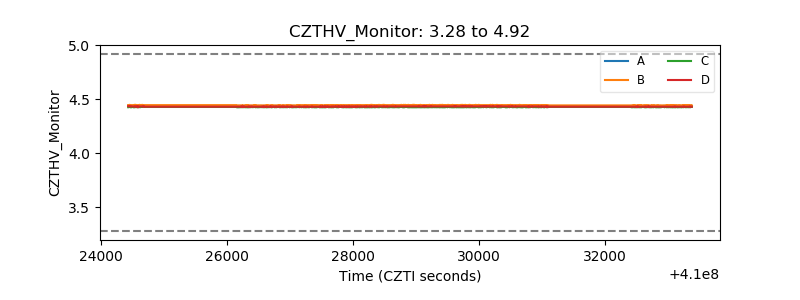 |
| D_VDD | 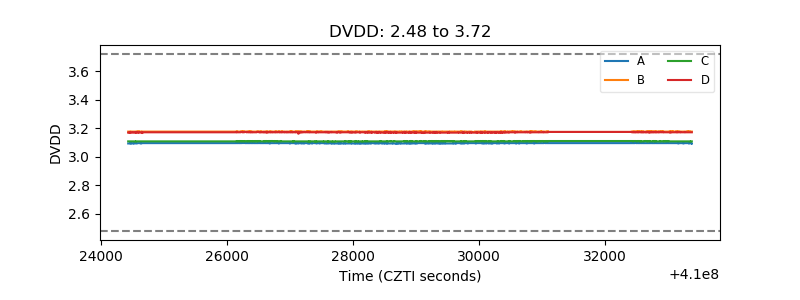 |
| Temperature 1 | 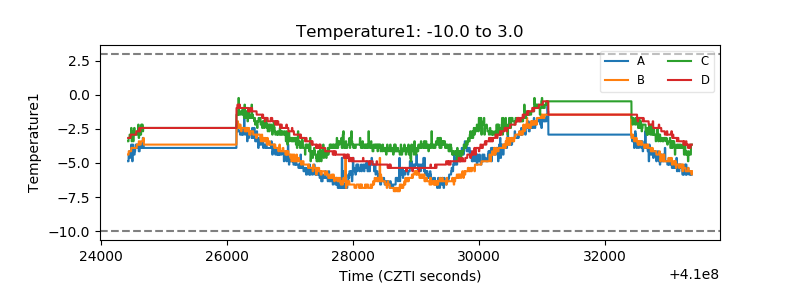 |
| Veto HV Monitor | 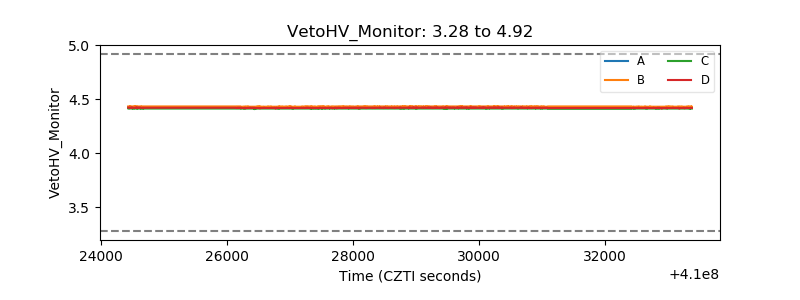 |
| Veto LLD | 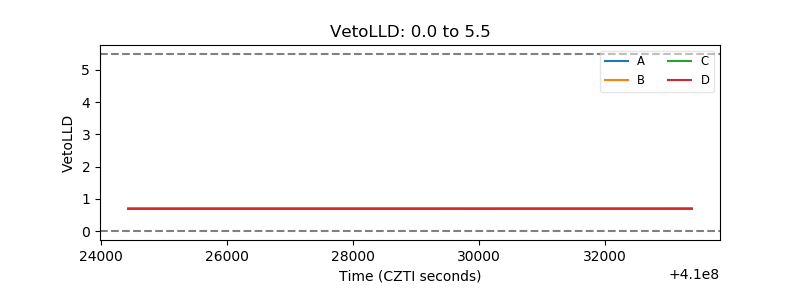 |
| Alpha Counter | 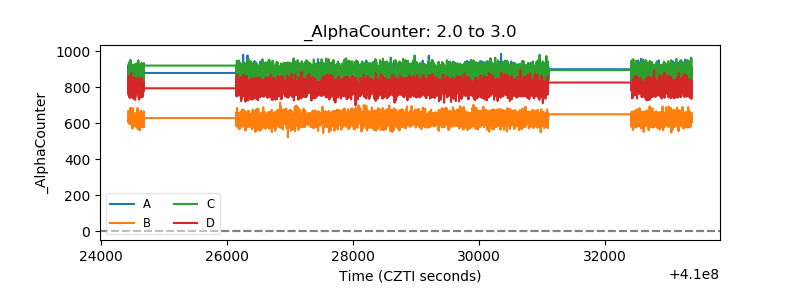 |
| _CPM_Rate | 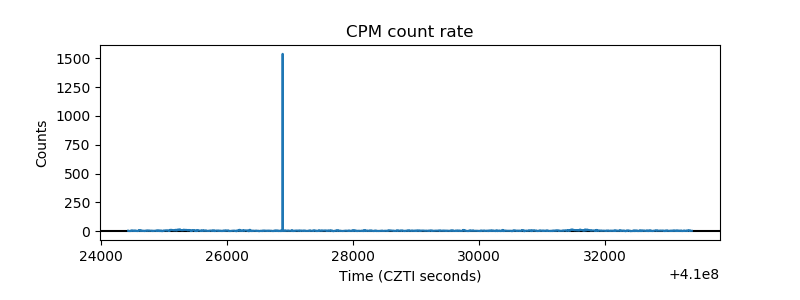 |
| CZT Counter | 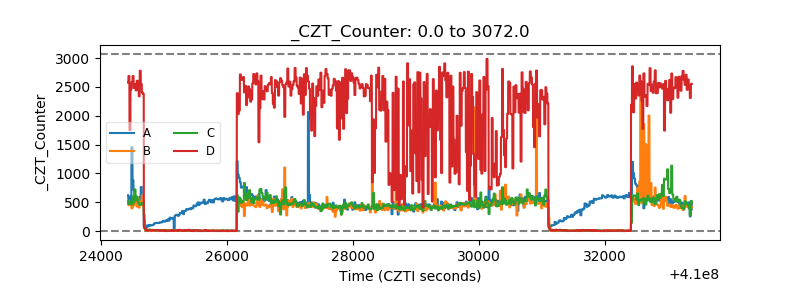 |
| +2.5 Volts monitor |  |
| +5 Volts monitor |  |
| _ROLL_ROT | 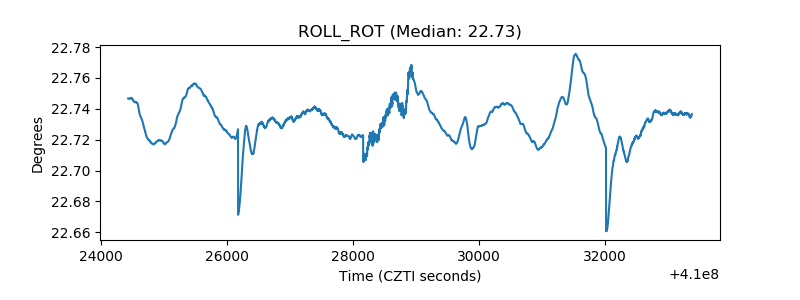 |
| _Roll_DEC |  |
| _Roll_RA | 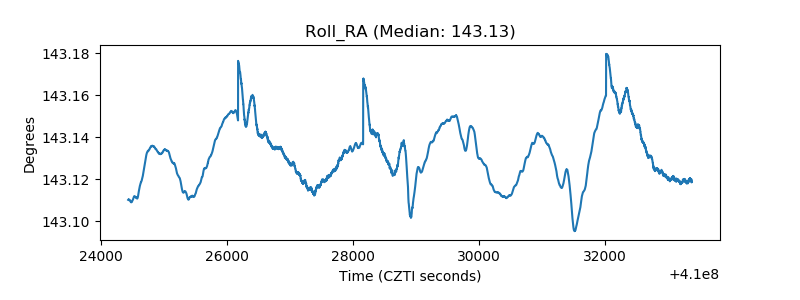 |
| Veto Counter | 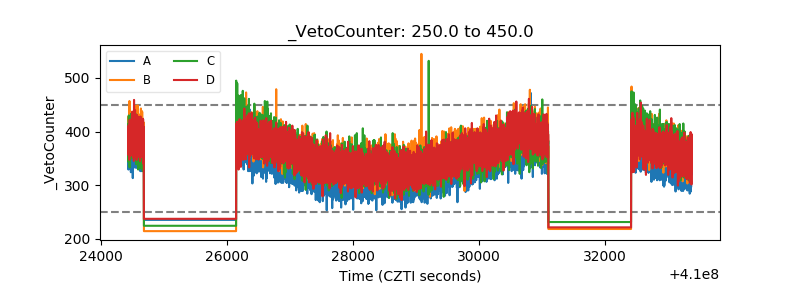 |