| Param | Original file | Final file |
|---|---|---|
| Filename | modeM0/AS1A12_054T04_9000005446_39221cztM0_level2.fits | modeM0/AS1A12_054T04_9000005446_39221cztM0_level2_quad_clean.evt |
| Size (bytes) | 533,888,640 | 66,142,080 |
| Size | 509.2 MB | 63.1 MB |
| Events in quadrant A | 2,381,196 | 544,948 |
| Events in quadrant B | 2,710,824 | 534,982 |
| Events in quadrant C | 2,390,135 | 522,639 |
| Events in quadrant D | 11,900,939 | 58,792 |
| Mode M9 | |||
|---|---|---|---|
| Quadrant | BADHDUFLAG | Total packets | Discarded packets |
| A | 0 | 14 | 0 |
| B | 0 | 14 | 0 |
| C | 0 | 14 | 0 |
| D | 0 | 14 | 0 |
| Mode M0 | |||
|---|---|---|---|
| Quadrant | BADHDUFLAG | Total packets | Discarded packets |
| A | 0 | 10235 | 2 |
| B | 0 | 11536 | 1 |
| C | 0 | 10268 | 1 |
| D | 0 | 38661 | 1 |
| Mode SS | |||
|---|---|---|---|
| Quadrant | BADHDUFLAG | Total packets | Discarded packets |
| A | 0 | 98 | 0 |
| B | 0 | 98 | 0 |
| C | 0 | 98 | 0 |
| D | 0 | 98 | 0 |
| Quadrant | Total seconds | Saturated seconds | Saturation percentage |
|---|---|---|---|
| A | 4867 | 8 | 0.164372% |
| B | 4867 | 163 | 3.349086% |
| C | 4867 | 5 | 0.102733% |
| D | 4867 | 4430 | 91.021163% |
Noise dominated data is calculated using 1-second bins in cleaned event files. If a bin has >2000 counts, and if more than 50% of those come from <1% of pixels, then it is considered to be noise-dominated and hence unusable.
| Quadrant | # 1 sec bins | Bins with >0 counts | Bins with >2000 counts | High rate bins dominated by noise | Noise dominated (total time) | Noise dominated (detector-on time) | Marked lightcurve |
|---|---|---|---|---|---|---|---|
| A | 6180 | 4868 | 3 | 3 | 0.05% | 0.06% | 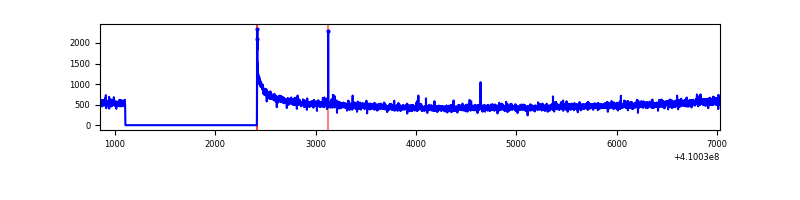 |
| B | 6180 | 4868 | 113 | 113 | 1.83% | 2.32% | 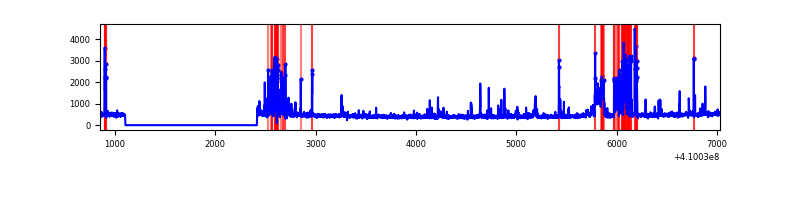 |
| C | 6180 | 4868 | 3 | 3 | 0.05% | 0.06% | 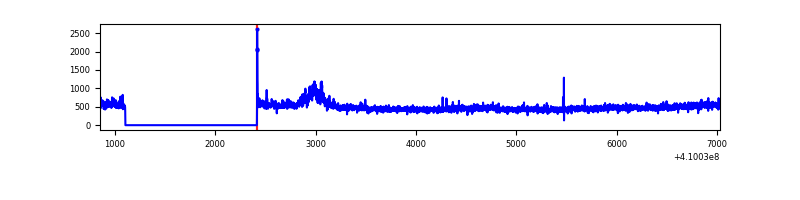 |
| D | 6179 | 4867 | 3558 | 3558 | 57.58% | 73.10% | 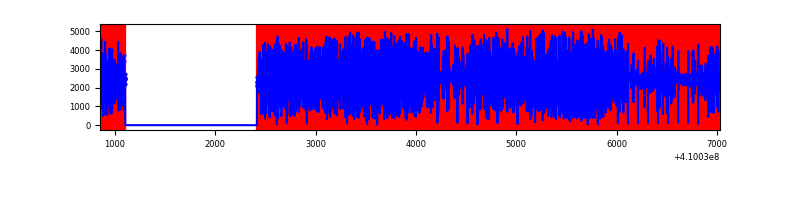 |
Top three noisy pixels from each quadrant. If the there are fewer than three noisy pixels in the level2.evt file, extra rows are filled as -1
| Pixel properties | Quadrant properties | ||||||
|---|---|---|---|---|---|---|---|
| Quadrant | DetID | PixID | Counts | Sigma | Mean | Median | Sigma |
| A | 10 | 83 | 325801 | 3005.85 | 528 | 517 | 108.2 |
| A | 13 | 248 | 7065 | 60.51 | 528 | 517 | 108.2 |
| A | 2 | 79 | 6537 | 55.63 | 528 | 517 | 108.2 |
| B | 5 | 255 | 474210 | 4635.79 | 516 | 499 | 102.2 |
| B | 5 | 172 | 166595 | 1625.44 | 516 | 499 | 102.2 |
| B | 0 | 190 | 32819 | 316.29 | 516 | 499 | 102.2 |
| C | 15 | 214 | 199025 | 1650.85 | 510 | 512 | 120.2 |
| C | 3 | 233 | 178632 | 1481.26 | 510 | 512 | 120.2 |
| C | 0 | 239 | 9975 | 78.7 | 510 | 512 | 120.2 |
| D | 12 | 235 | 7377286 | 135307.72 | 219 | 212 | 54.5 |
| D | 1 | 47 | 3467370 | 63593.4 | 219 | 212 | 54.5 |
| D | 2 | 249 | 85494 | 1564.21 | 219 | 212 | 54.5 |
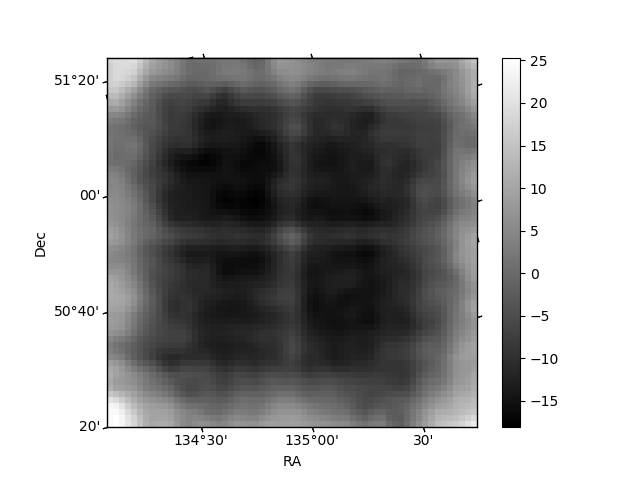
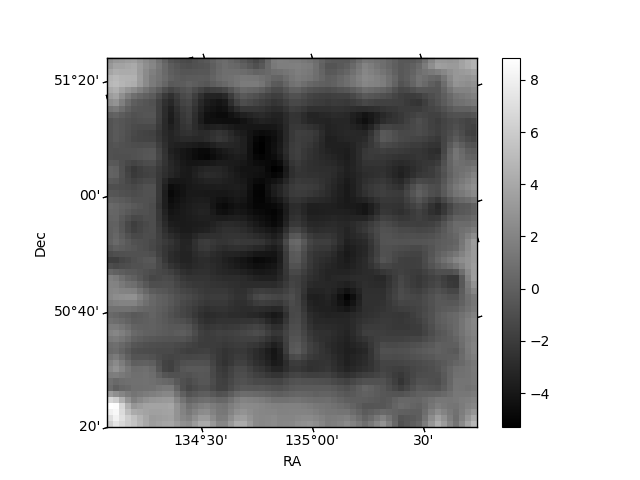
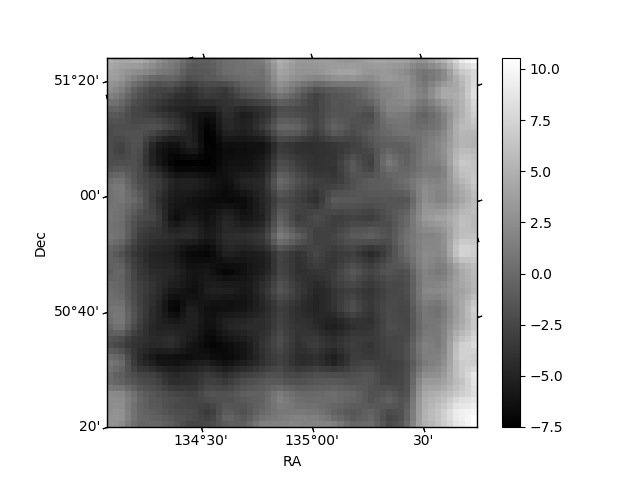
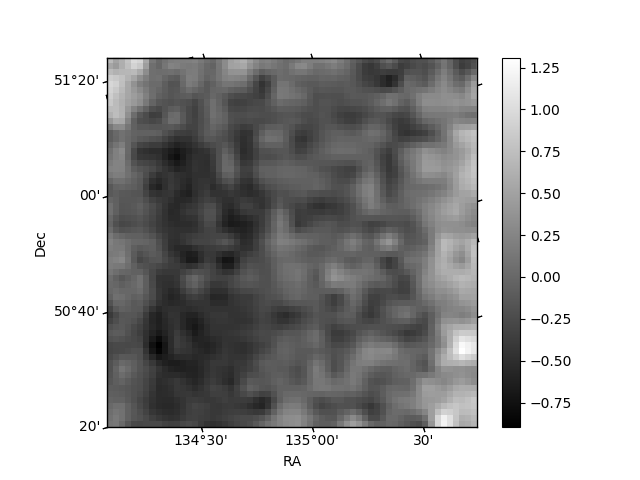
Histogram calculated using DETX and DETY for each event in the final _common_clean file
| Quadrant A | 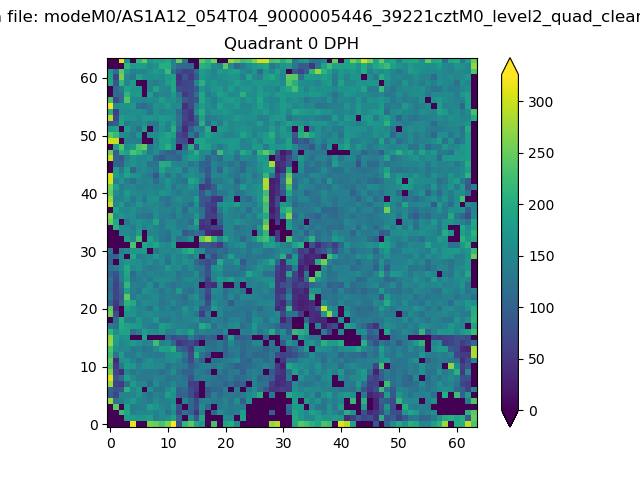 |
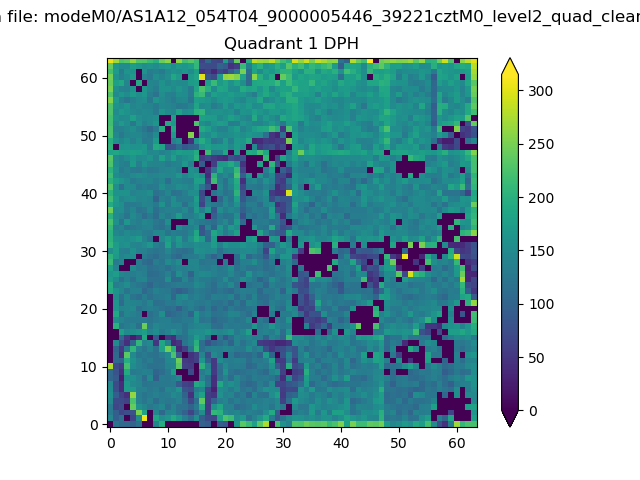 |
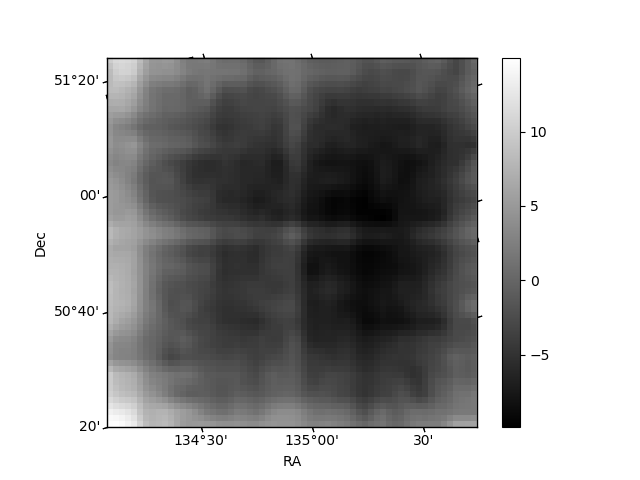
Quadrant B |
|---|---|---|---|
| Quadrant D | 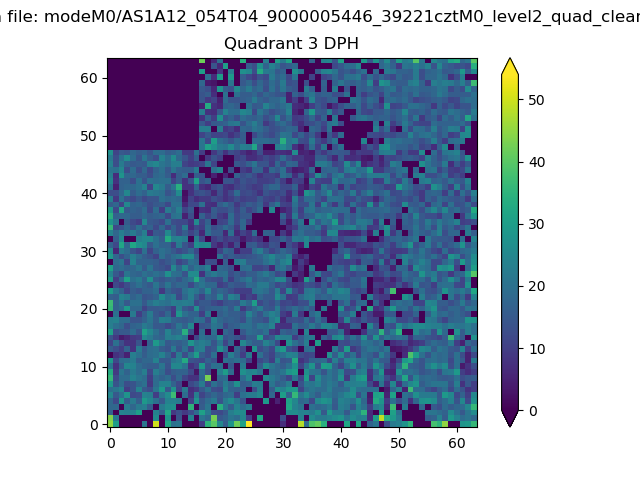 |
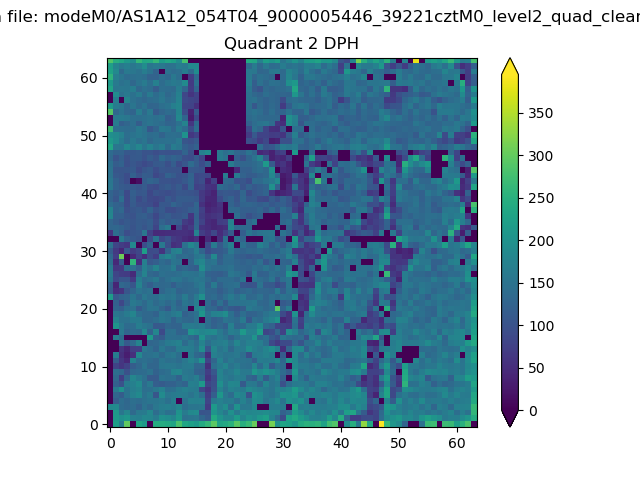 |
Quadrant C |
| Plot type | Count rate plots | Images |
|---|---|---|
| Comparison with Poisson distribution Blue bars denote a histogram of data divided into 1 sec bins. Red curve is a Poisson curve with rate = median count rate of data. |
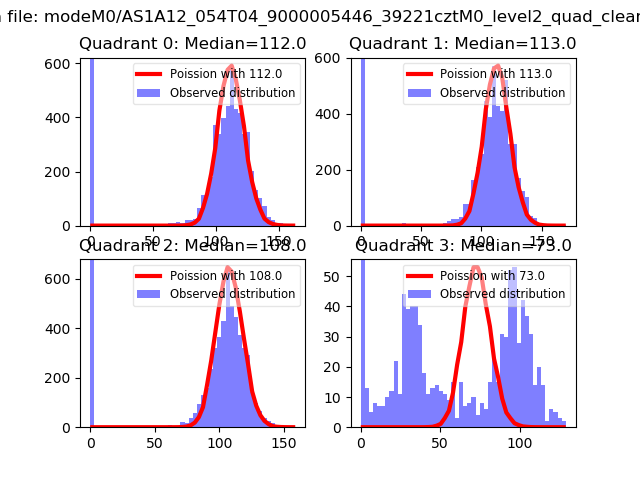 |
 |
| Quadrant-wise count rates Data is divided into 100 sec bins |
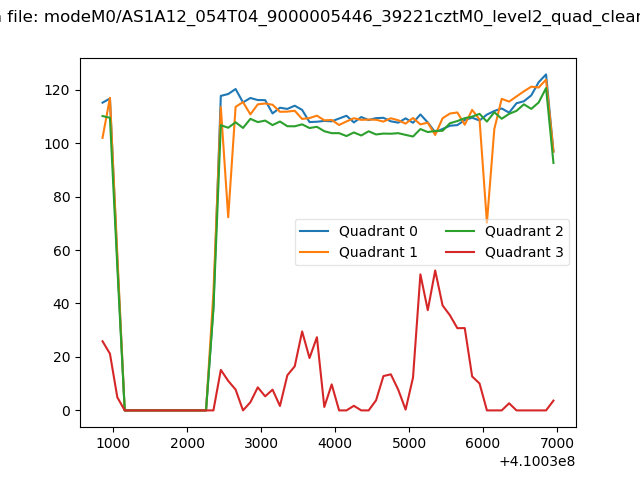 |
|
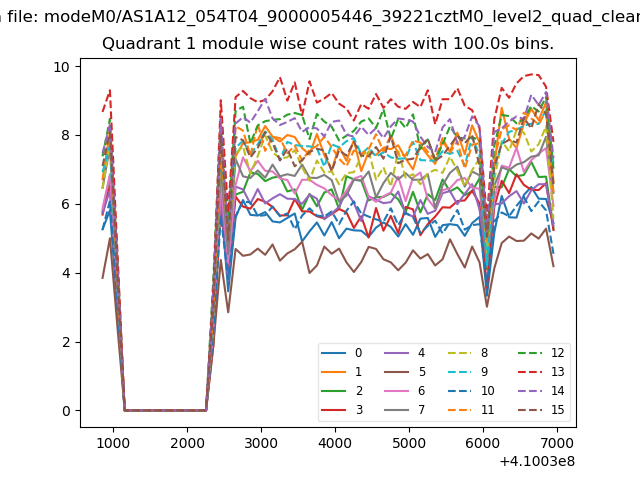
| Module-wise count rates for Quadrant A Data is divided into 100 sec bins |
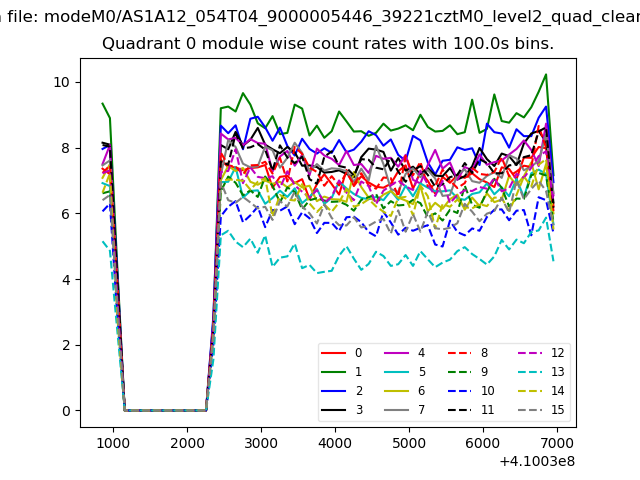 |
 |
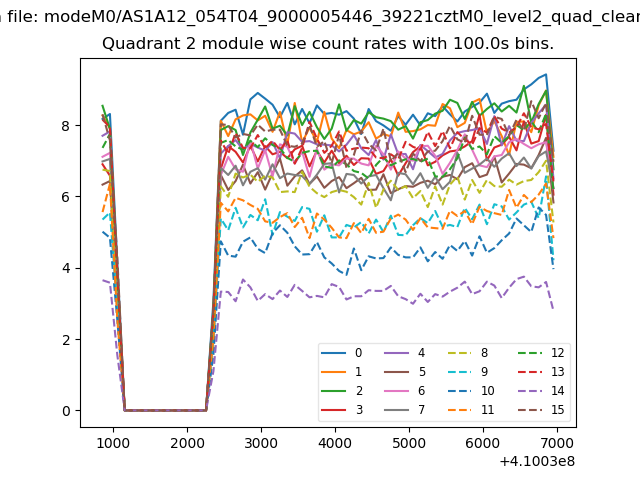
| Module-wise count rates for Quadrant B Data is divided into 100 sec bins |
 |
 |
| Module-wise count rates for Quadrant C Data is divided into 100 sec bins |
 |
 |
| Module-wise count rates for Quadrant D Data is divided into 100 sec bins |
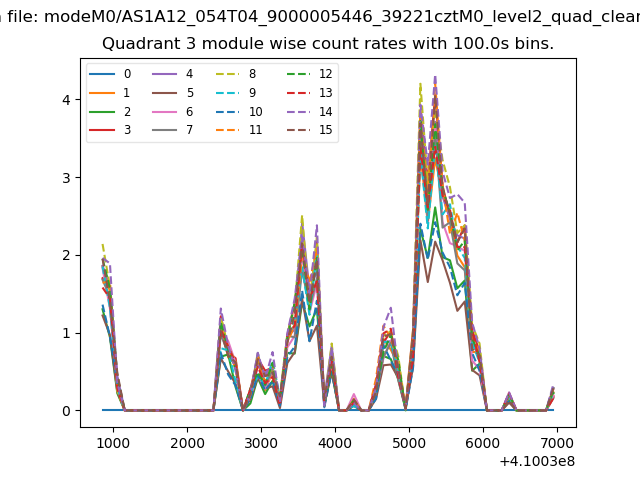 |
 |
| Parameter | Plot |
|---|---|
| CZT HV Monitor | 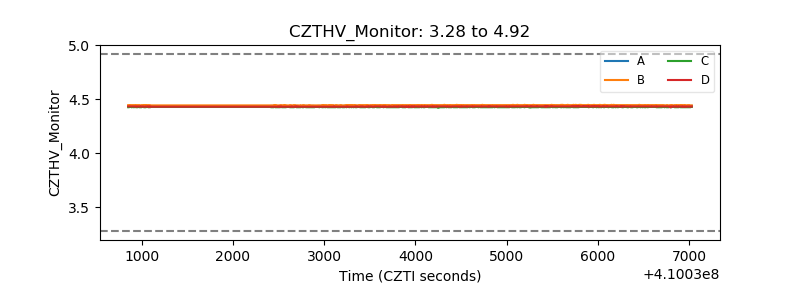 |
| D_VDD | 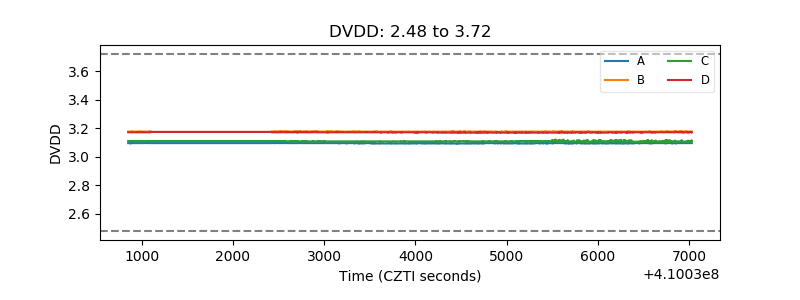 |
| Temperature 1 | 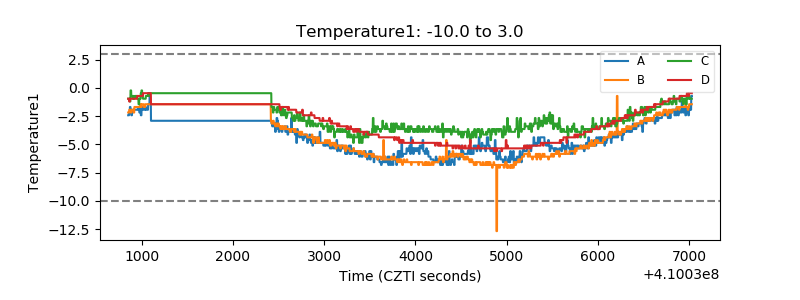 |
| Veto HV Monitor | 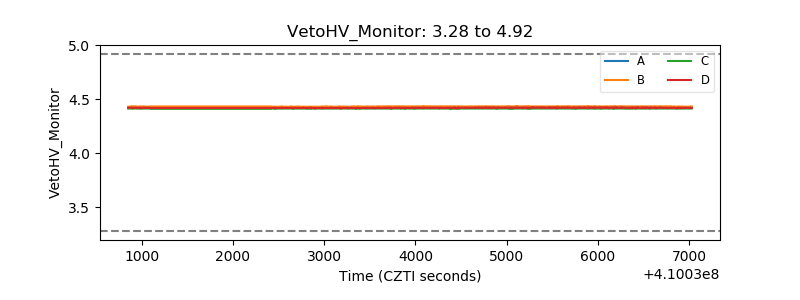 |
| Veto LLD | 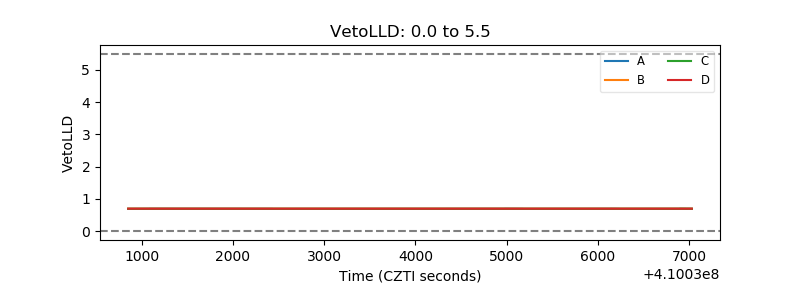 |
| Alpha Counter | 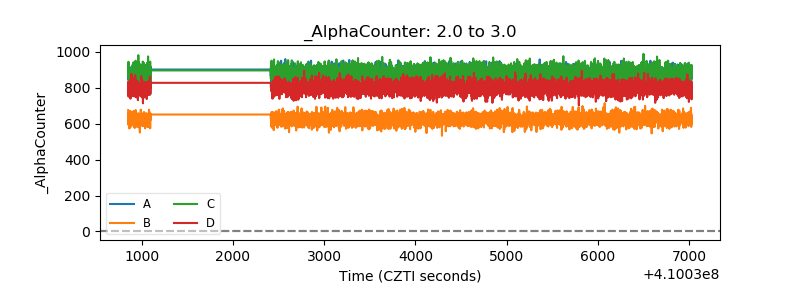 |
| _CPM_Rate | 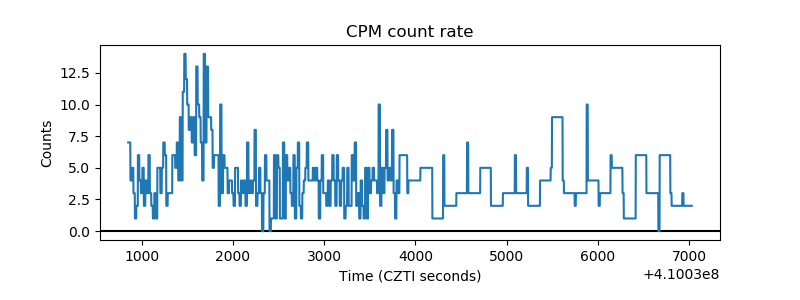 |
| CZT Counter | 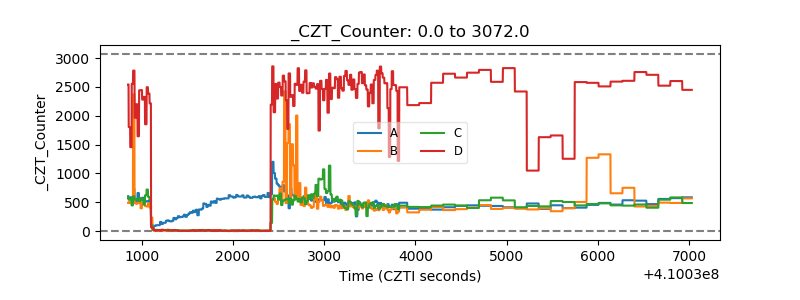 |
| +2.5 Volts monitor | 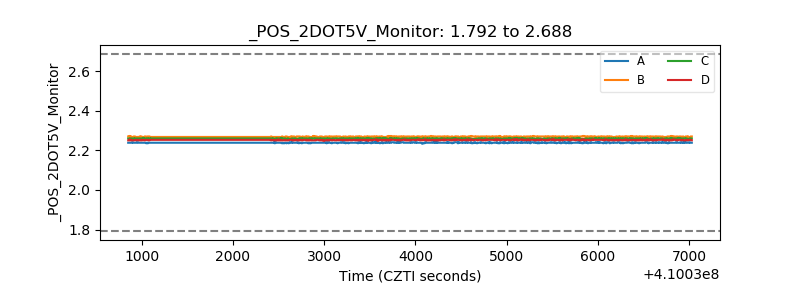 |
| +5 Volts monitor | 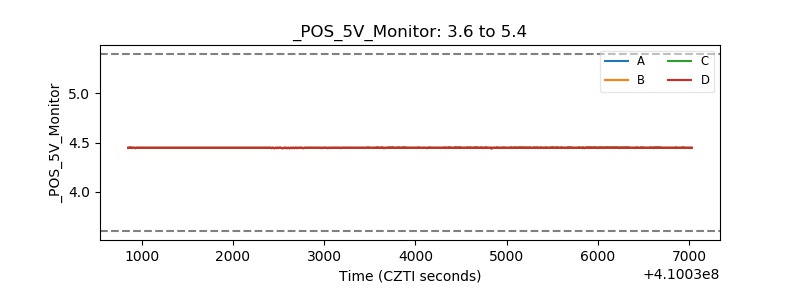 |
| _ROLL_ROT | 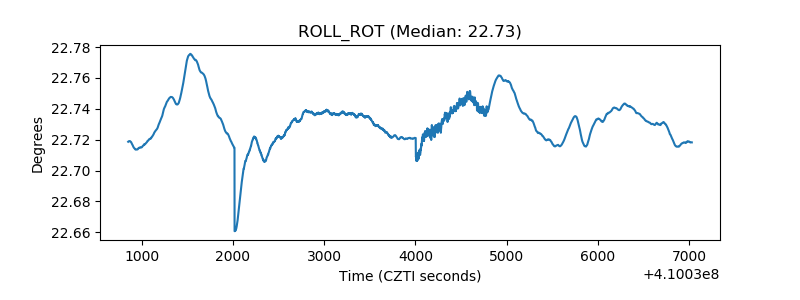 |
| _Roll_DEC | 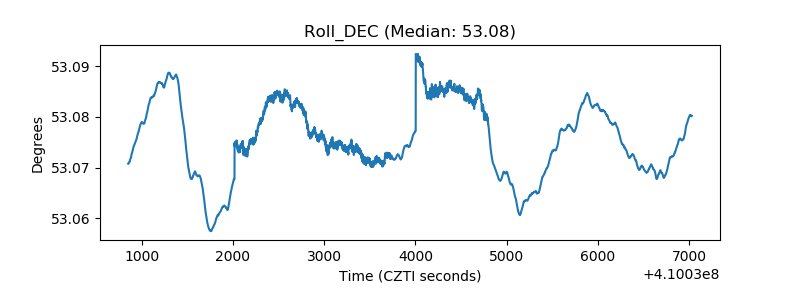 |
| _Roll_RA | 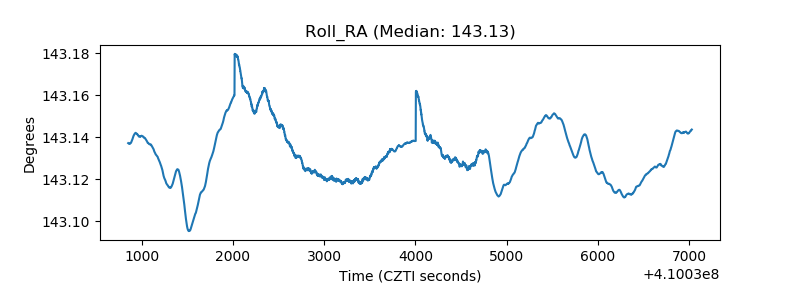 |
| Veto Counter | 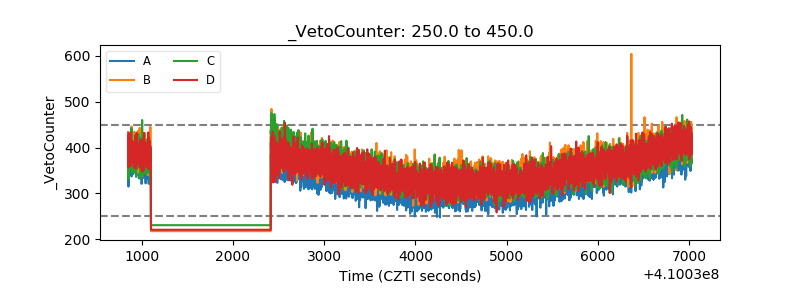 |