| Param | Original file | Final file |
|---|---|---|
| Filename | modeM0/AS1A12_054T04_9000005446_39223cztM0_level2.fits | modeM0/AS1A12_054T04_9000005446_39223cztM0_level2_quad_clean.evt |
| Size (bytes) | 1,284,396,480 | 157,409,280 |
| Size | 1.2 GB | 150.1 MB |
| Events in quadrant A | 6,146,041 | 1,287,172 |
| Events in quadrant B | 6,572,613 | 1,256,153 |
| Events in quadrant C | 5,359,354 | 1,245,280 |
| Events in quadrant D | 28,563,452 | 171,841 |
| Mode M9 | |||
|---|---|---|---|
| Quadrant | BADHDUFLAG | Total packets | Discarded packets |
| A | 0 | 42 | 0 |
| B | 0 | 42 | 0 |
| C | 0 | 42 | 0 |
| D | 0 | 42 | 0 |
| Mode M0 | |||
|---|---|---|---|
| Quadrant | BADHDUFLAG | Total packets | Discarded packets |
| A | 0 | 25897 | 4 |
| B | 0 | 27971 | 3 |
| C | 0 | 23583 | 3 |
| D | 0 | 92801 | 3 |
| Mode SS | |||
|---|---|---|---|
| Quadrant | BADHDUFLAG | Total packets | Discarded packets |
| A | 0 | 238 | 0 |
| B | 0 | 238 | 0 |
| C | 0 | 238 | 0 |
| D | 0 | 238 | 0 |
| Quadrant | Total seconds | Saturated seconds | Saturation percentage |
|---|---|---|---|
| A | 11639 | 136 | 1.168485% |
| B | 11639 | 550 | 4.725492% |
| C | 11639 | 9 | 0.077326% |
| D | 11639 | 10300 | 88.495575% |
Noise dominated data is calculated using 1-second bins in cleaned event files. If a bin has >2000 counts, and if more than 50% of those come from <1% of pixels, then it is considered to be noise-dominated and hence unusable.
| Quadrant | # 1 sec bins | Bins with >0 counts | Bins with >2000 counts | High rate bins dominated by noise | Noise dominated (total time) | Noise dominated (detector-on time) | Marked lightcurve |
|---|---|---|---|---|---|---|---|
| A | 15788 | 11642 | 83 | 83 | 0.53% | 0.71% | 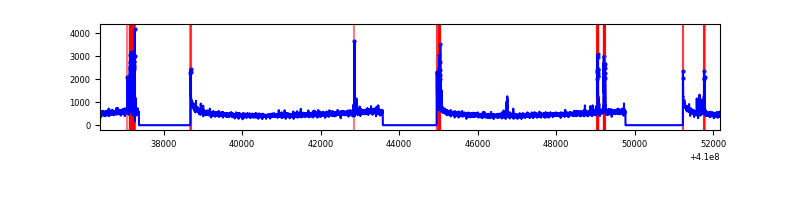 |
| B | 15788 | 11642 | 348 | 348 | 2.20% | 2.99% | 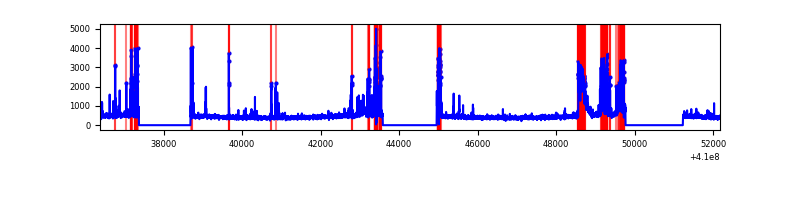 |
| C | 15788 | 11642 | 1 | 1 | 0.01% | 0.01% | 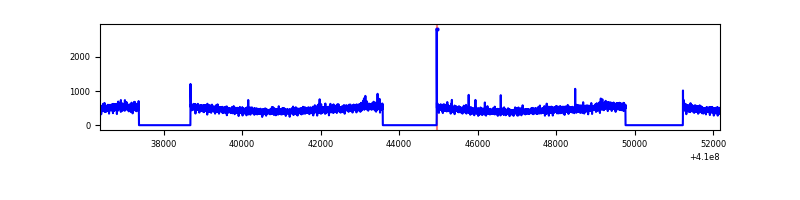 |
| D | 15788 | 11641 | 8812 | 8812 | 55.81% | 75.70% | 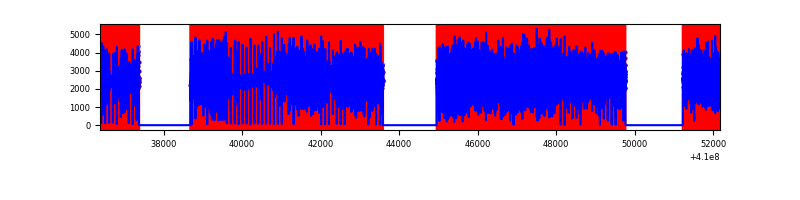 |
Top three noisy pixels from each quadrant. If the there are fewer than three noisy pixels in the level2.evt file, extra rows are filled as -1
| Pixel properties | Quadrant properties | ||||||
|---|---|---|---|---|---|---|---|
| Quadrant | DetID | PixID | Counts | Sigma | Mean | Median | Sigma |
| A | 10 | 83 | 827826 | 3203.76 | 1278 | 1252 | 258.0 |
| A | 13 | 248 | 311942 | 1204.22 | 1278 | 1252 | 258.0 |
| A | 15 | 174 | 62836 | 238.7 | 1278 | 1252 | 258.0 |
| B | 5 | 172 | 630364 | 2637.73 | 1241 | 1205 | 238.5 |
| B | 5 | 255 | 438286 | 1832.45 | 1241 | 1205 | 238.5 |
| B | 12 | 18 | 434812 | 1817.88 | 1241 | 1205 | 238.5 |
| C | 15 | 214 | 477471 | 1646.84 | 1240 | 1245 | 289.2 |
| C | 0 | 239 | 20459 | 66.44 | 1240 | 1245 | 289.2 |
| C | 3 | 233 | 12427 | 38.67 | 1240 | 1245 | 289.2 |
| D | 12 | 235 | 19231833 | 138666.15 | 573 | 555 | 138.7 |
| D | 1 | 47 | 6116529 | 44098.92 | 573 | 555 | 138.7 |
| D | 5 | 222 | 318140 | 2289.93 | 573 | 555 | 138.7 |
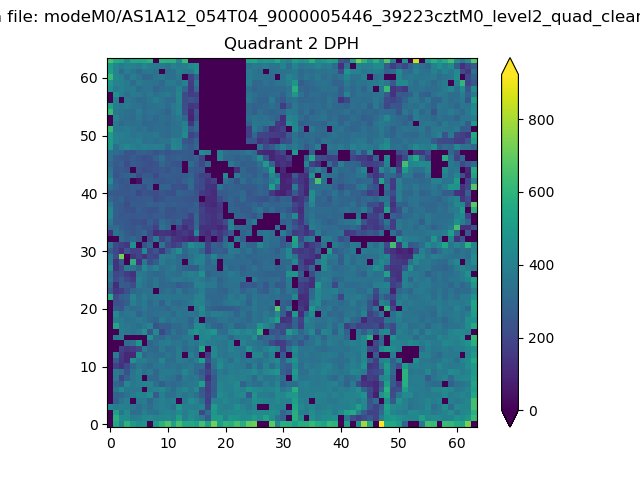
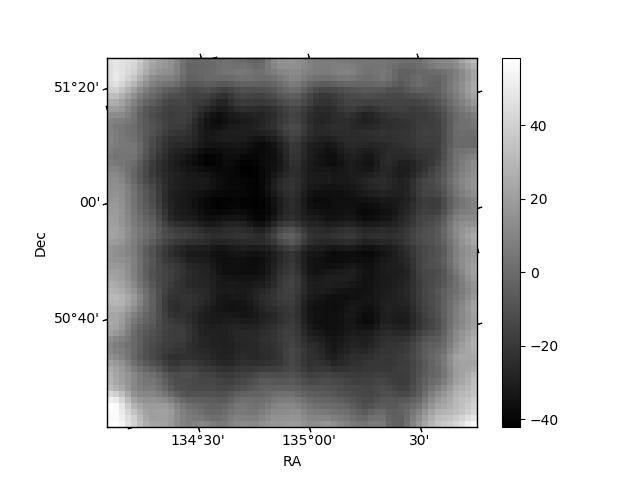
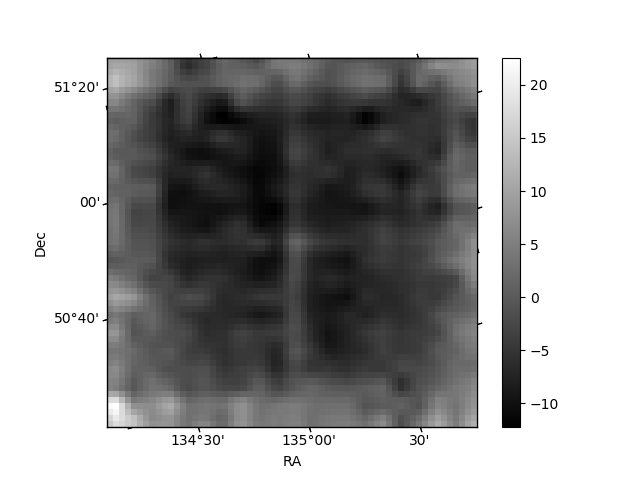
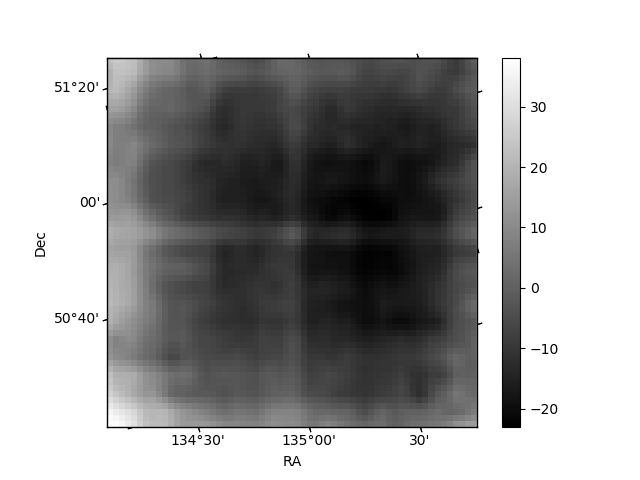
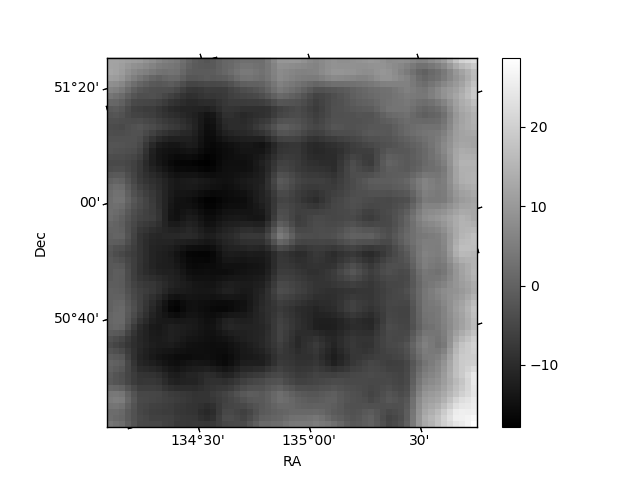
Histogram calculated using DETX and DETY for each event in the final _common_clean file
| Quadrant A | 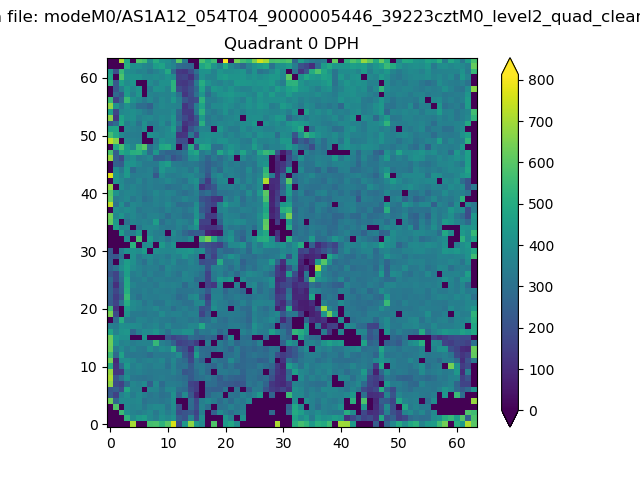 |
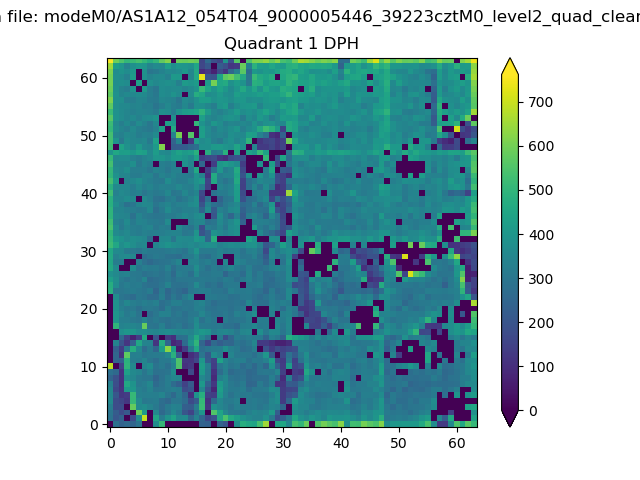 |
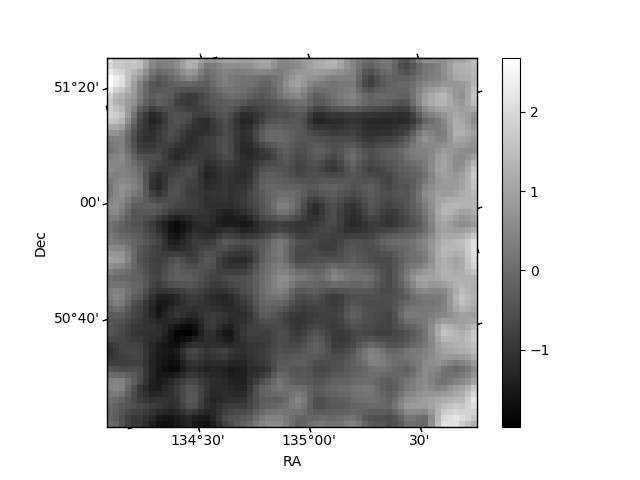
Quadrant B |
|---|---|---|---|
| Quadrant D | 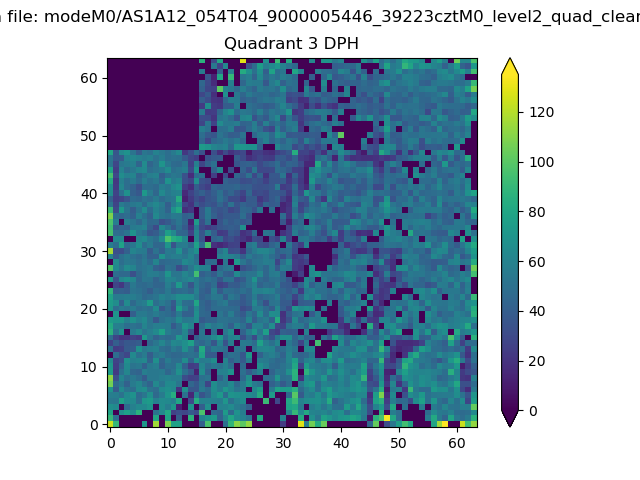 |
 |
Quadrant C |
| Plot type | Count rate plots | Images |
|---|---|---|
| Comparison with Poisson distribution Blue bars denote a histogram of data divided into 1 sec bins. Red curve is a Poisson curve with rate = median count rate of data. |
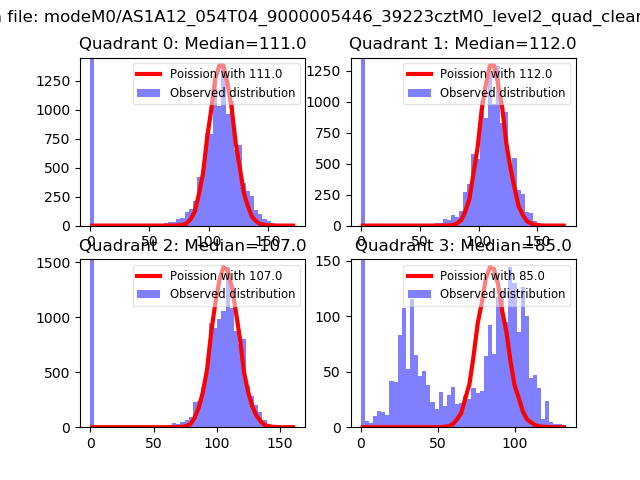 |
 |
| Quadrant-wise count rates Data is divided into 100 sec bins |
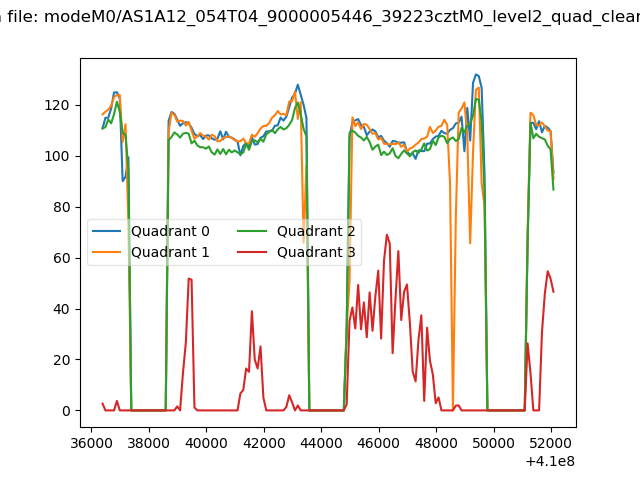 |
|
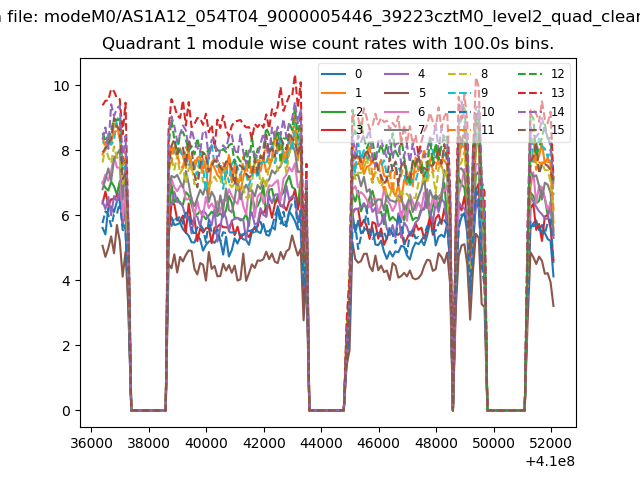
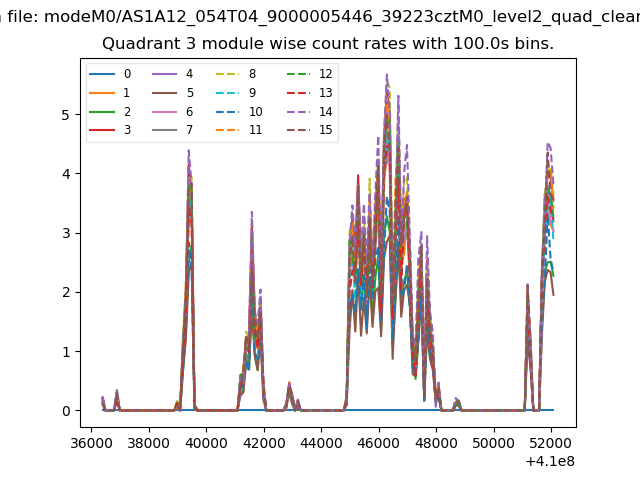
| Module-wise count rates for Quadrant A Data is divided into 100 sec bins |
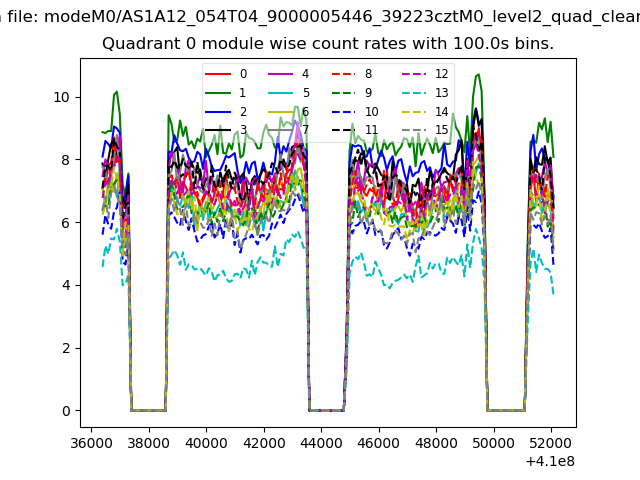 |
 |
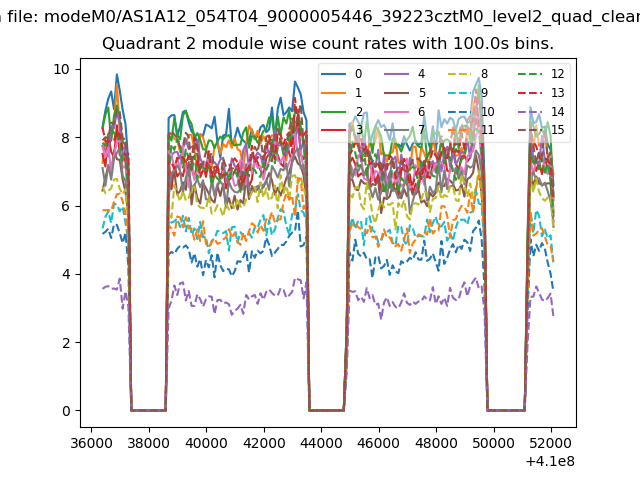
| Module-wise count rates for Quadrant B Data is divided into 100 sec bins |
 |
 |
| Module-wise count rates for Quadrant C Data is divided into 100 sec bins |
 |
 |
| Module-wise count rates for Quadrant D Data is divided into 100 sec bins |
 |
 |
| Parameter | Plot |
|---|---|
| CZT HV Monitor | 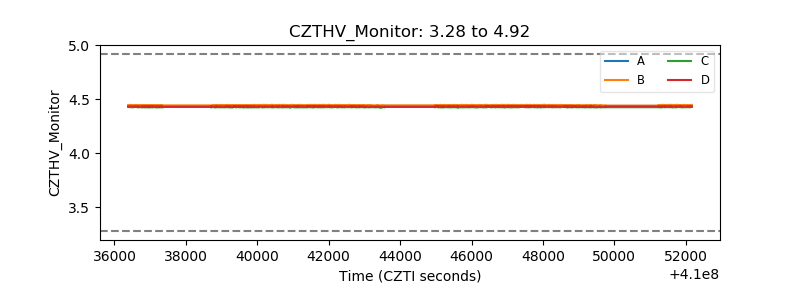 |
| D_VDD | 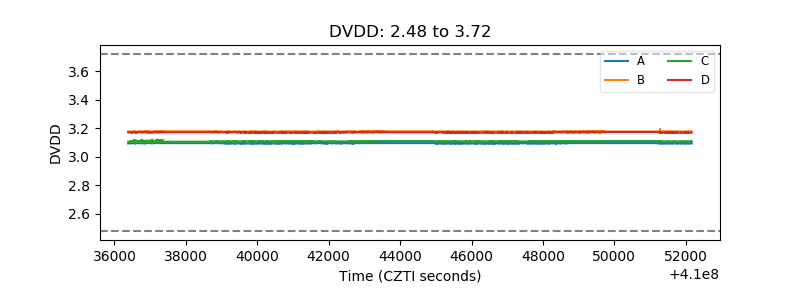 |
| Temperature 1 | 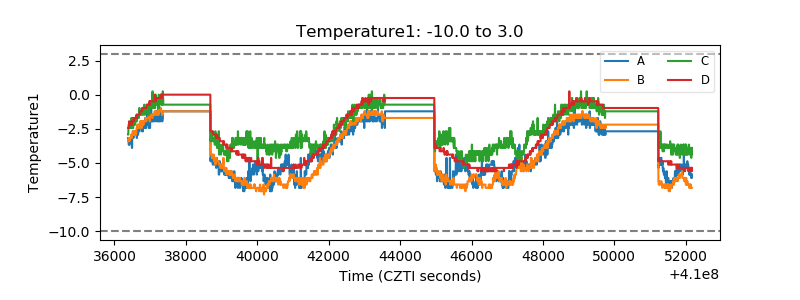 |
| Veto HV Monitor | 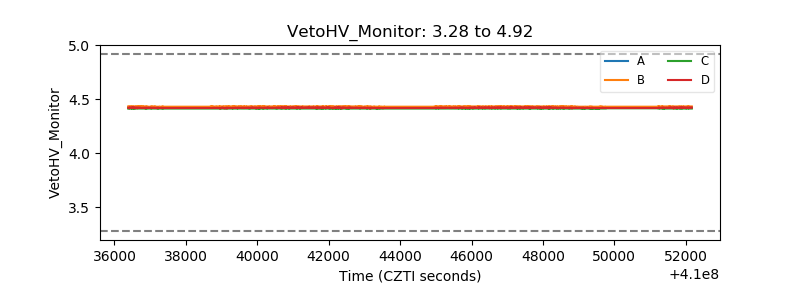 |
| Veto LLD | 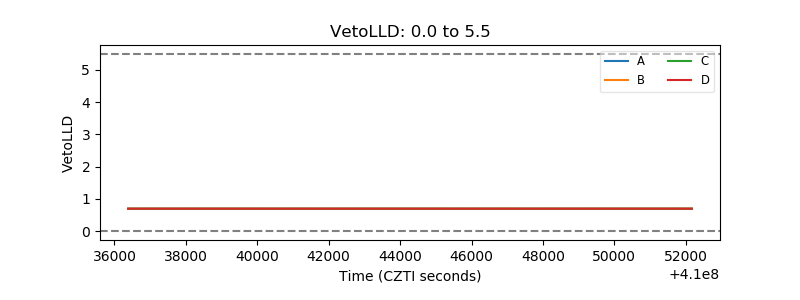 |
| Alpha Counter | 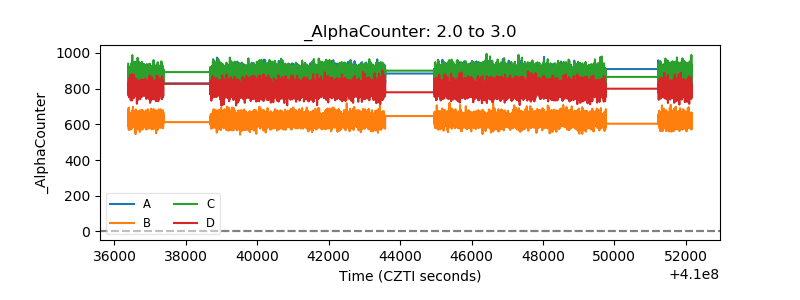 |
| _CPM_Rate | 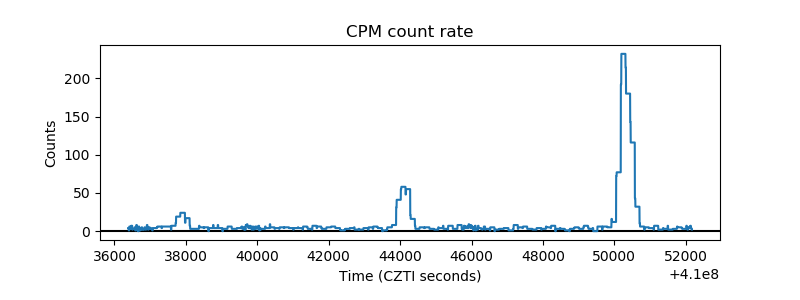 |
| CZT Counter | 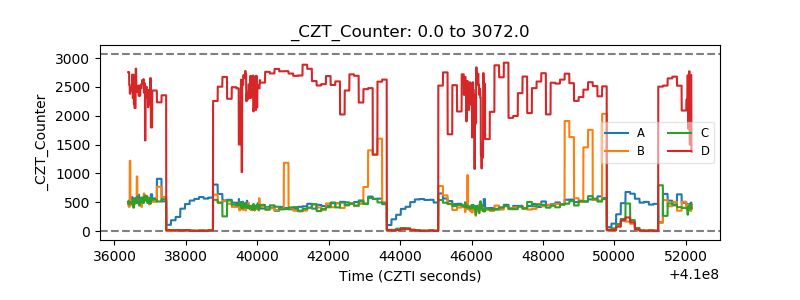 |
| +2.5 Volts monitor | 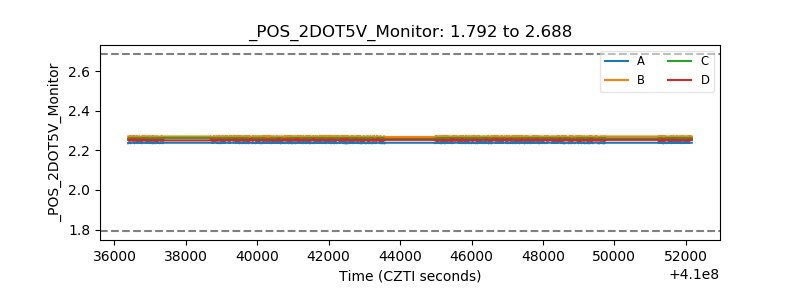 |
| +5 Volts monitor |  |
| _ROLL_ROT | 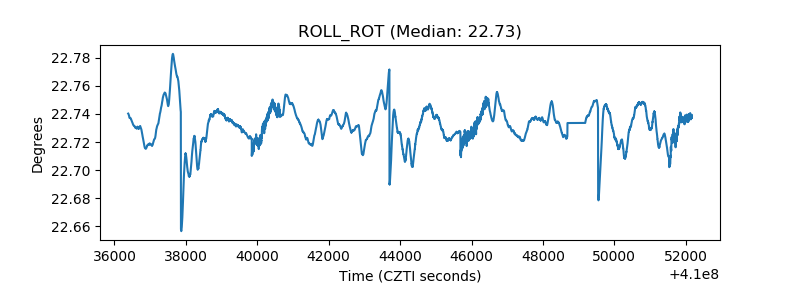 |
| _Roll_DEC | 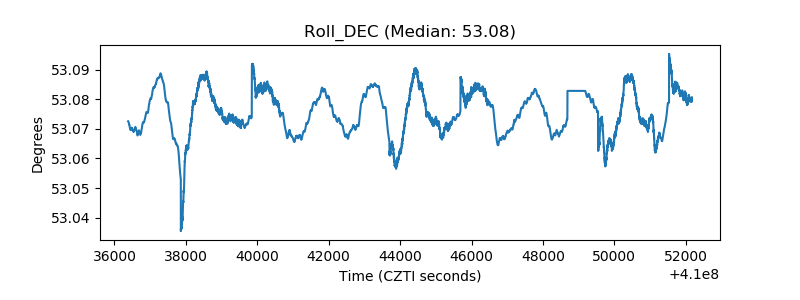 |
| _Roll_RA | 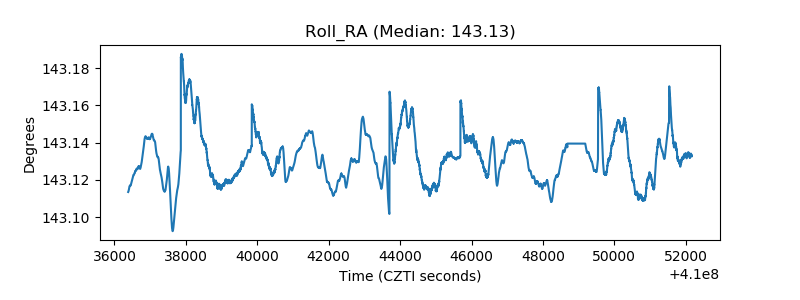 |
| Veto Counter | 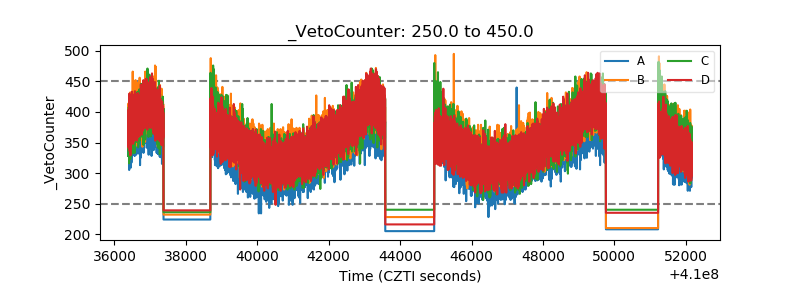 |