| Param | Original file | Final file |
|---|---|---|
| Filename | modeM0/AS1A12_054T04_9000005446_39224cztM0_level2.fits | modeM0/AS1A12_054T04_9000005446_39224cztM0_level2_quad_clean.evt |
| Size (bytes) | 597,818,880 | 82,149,120 |
| Size | 570.1 MB | 78.3 MB |
| Events in quadrant A | 3,020,525 | 636,005 |
| Events in quadrant B | 2,566,509 | 651,887 |
| Events in quadrant C | 2,619,160 | 617,945 |
| Events in quadrant D | 13,474,854 | 178,950 |
| Mode M9 | |||
|---|---|---|---|
| Quadrant | BADHDUFLAG | Total packets | Discarded packets |
| A | 0 | 21 | 0 |
| B | 0 | 21 | 0 |
| C | 0 | 21 | 0 |
| D | 0 | 22 | 0 |
| Mode M0 | |||
|---|---|---|---|
| Quadrant | BADHDUFLAG | Total packets | Discarded packets |
| A | 0 | 12768 | 3 |
| B | 0 | 11812 | 2 |
| C | 0 | 11708 | 2 |
| D | 0 | 43965 | 2 |
| Mode SS | |||
|---|---|---|---|
| Quadrant | BADHDUFLAG | Total packets | Discarded packets |
| A | 0 | 116 | 0 |
| B | 0 | 116 | 0 |
| C | 0 | 116 | 0 |
| D | 0 | 116 | 0 |
| Quadrant | Total seconds | Saturated seconds | Saturation percentage |
|---|---|---|---|
| A | 5758 | 50 | 0.868357% |
| B | 5758 | 13 | 0.225773% |
| C | 5758 | 2 | 0.034734% |
| D | 5758 | 4313 | 74.904481% |
Noise dominated data is calculated using 1-second bins in cleaned event files. If a bin has >2000 counts, and if more than 50% of those come from <1% of pixels, then it is considered to be noise-dominated and hence unusable.
| Quadrant | # 1 sec bins | Bins with >0 counts | Bins with >2000 counts | High rate bins dominated by noise | Noise dominated (total time) | Noise dominated (detector-on time) | Marked lightcurve |
|---|---|---|---|---|---|---|---|
| A | 7372 | 5759 | 30 | 30 | 0.41% | 0.52% | 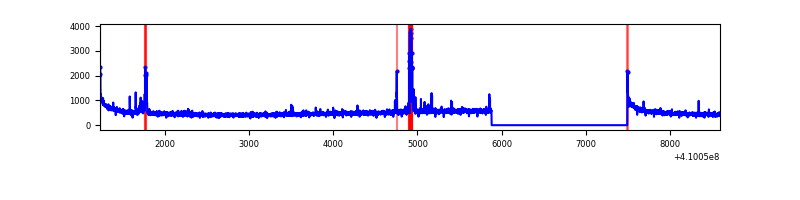 |
| B | 7372 | 5759 | 3 | 3 | 0.04% | 0.05% | 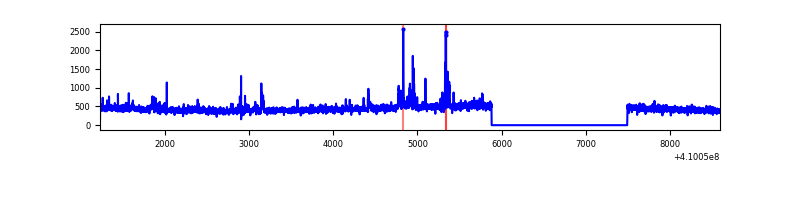 |
| C | 7372 | 5759 | 0 | 0 | 0.00% | 0.00% | 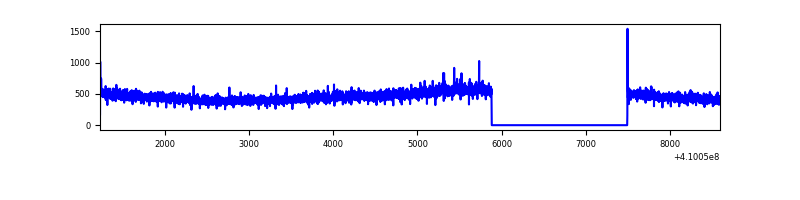 |
| D | 7372 | 5757 | 3869 | 3869 | 52.48% | 67.21% | 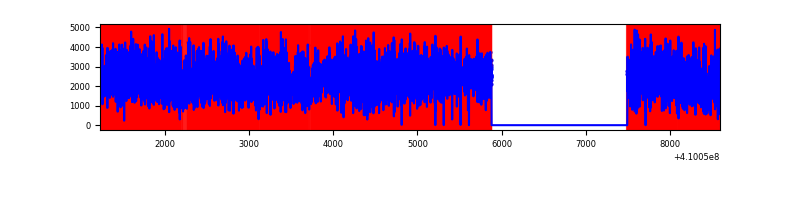 |
Top three noisy pixels from each quadrant. If the there are fewer than three noisy pixels in the level2.evt file, extra rows are filled as -1
| Pixel properties | Quadrant properties | ||||||
|---|---|---|---|---|---|---|---|
| Quadrant | DetID | PixID | Counts | Sigma | Mean | Median | Sigma |
| A | 10 | 83 | 451834 | 3600.88 | 618 | 606 | 125.3 |
| A | 13 | 248 | 107860 | 855.91 | 618 | 606 | 125.3 |
| A | 15 | 174 | 62302 | 492.35 | 618 | 606 | 125.3 |
| B | 5 | 172 | 51865 | 432.15 | 616 | 599 | 118.6 |
| B | 0 | 190 | 29464 | 243.32 | 616 | 599 | 118.6 |
| B | 12 | 18 | 22875 | 187.77 | 616 | 599 | 118.6 |
| C | 15 | 214 | 239366 | 1718.7 | 598 | 601 | 138.9 |
| C | 0 | 239 | 30415 | 214.61 | 598 | 601 | 138.9 |
| C | 0 | 10 | 5151 | 32.75 | 598 | 601 | 138.9 |
| D | 12 | 235 | 11361313 | 120775.49 | 382 | 369 | 94.1 |
| D | 1 | 47 | 267158 | 2836.17 | 382 | 369 | 94.1 |
| D | 5 | 222 | 160664 | 1704.06 | 382 | 369 | 94.1 |
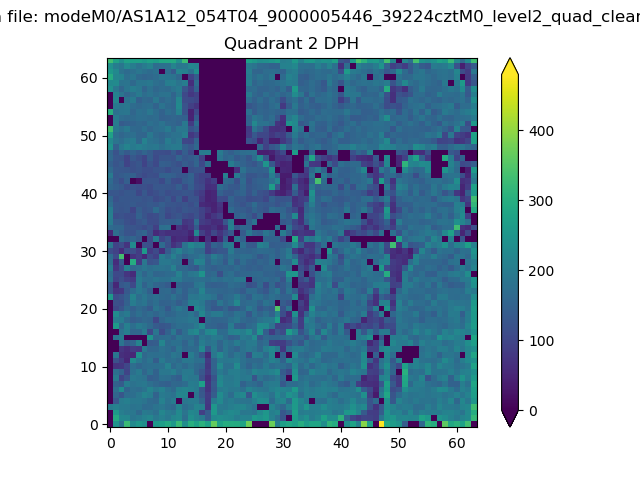
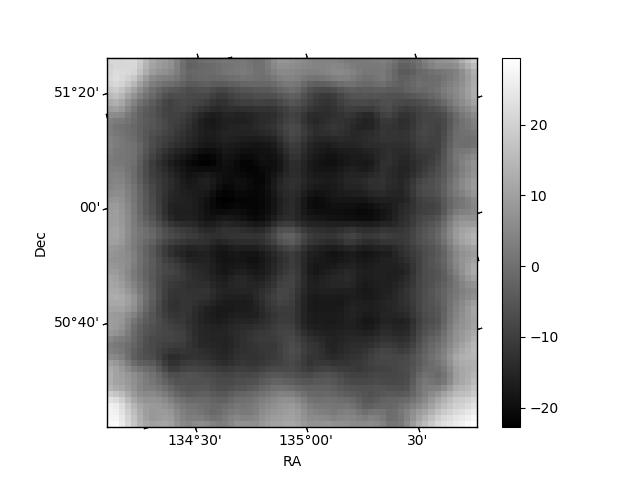
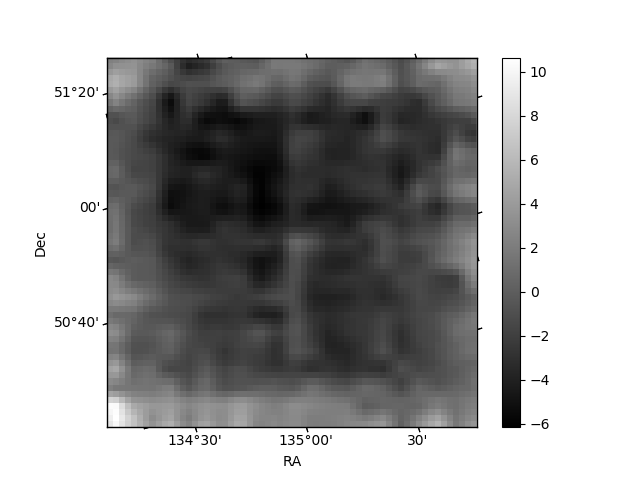
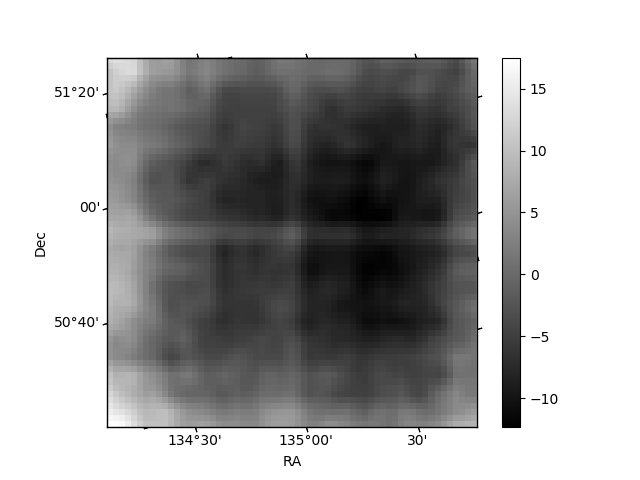
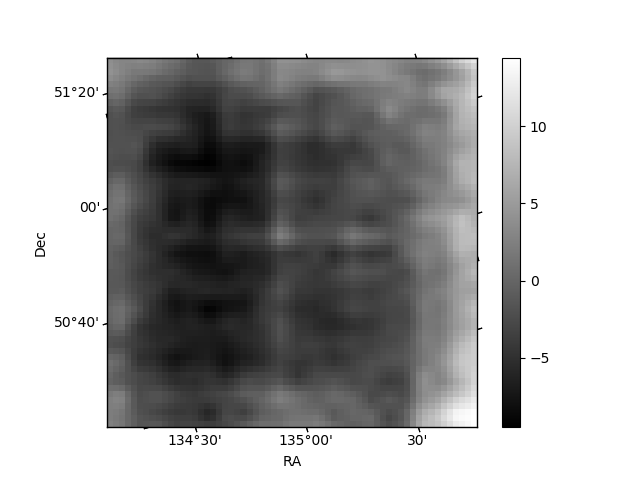
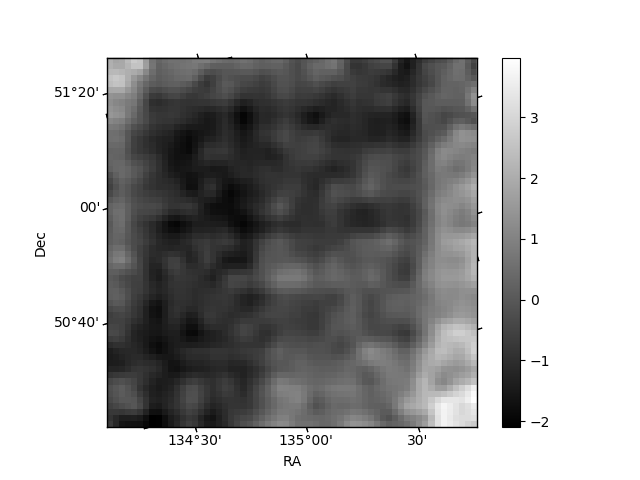
Histogram calculated using DETX and DETY for each event in the final _common_clean file
| Quadrant A | 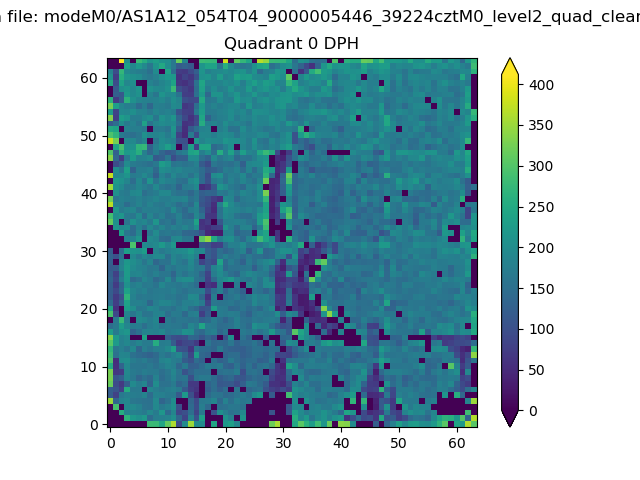 |
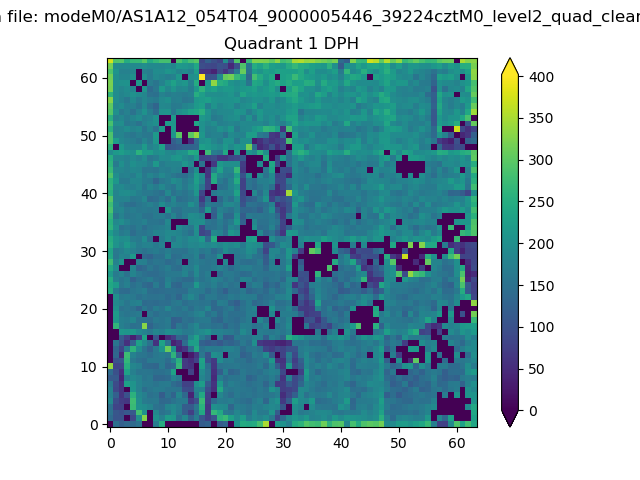 |
Quadrant B |
|---|---|---|---|
| Quadrant D | 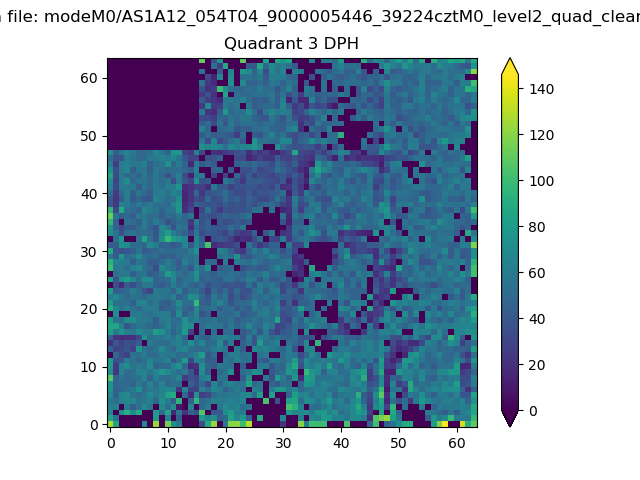 |
 |
Quadrant C |
| Plot type | Count rate plots | Images |
|---|---|---|
| Comparison with Poisson distribution Blue bars denote a histogram of data divided into 1 sec bins. Red curve is a Poisson curve with rate = median count rate of data. |
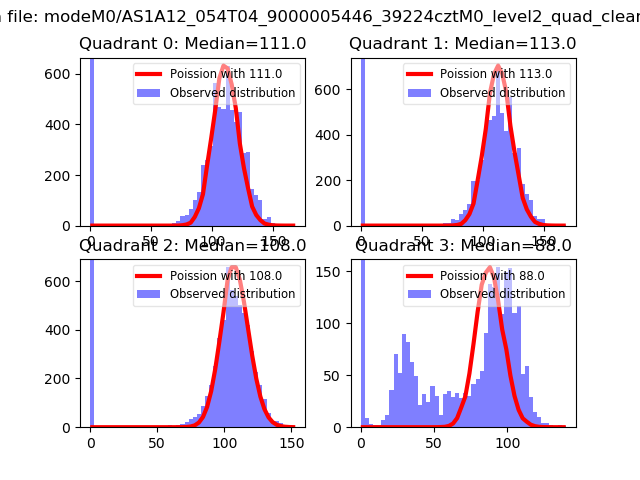 |
 |
| Quadrant-wise count rates Data is divided into 100 sec bins |
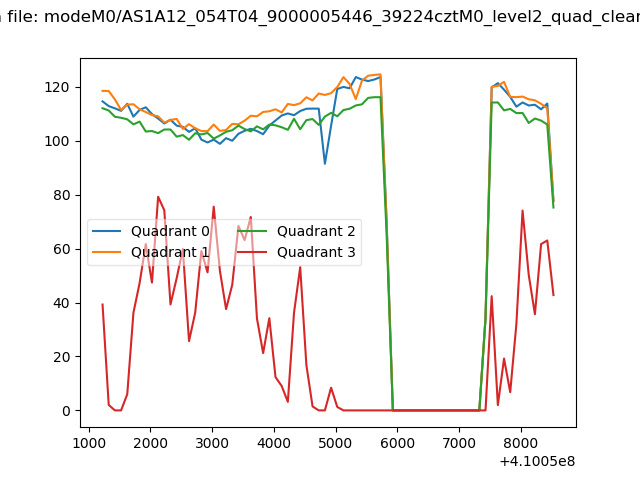 |
|
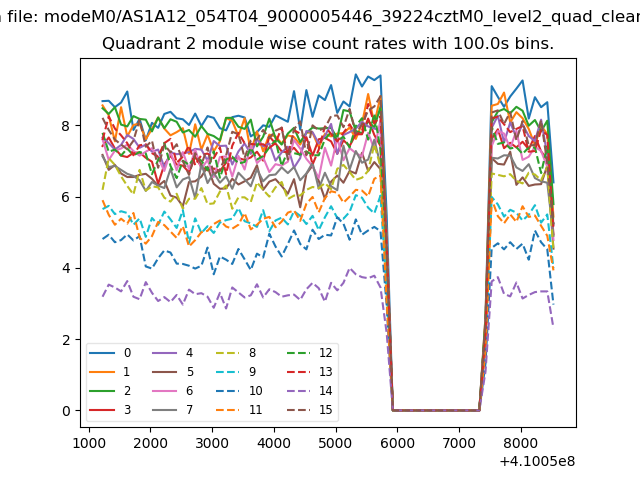
| Module-wise count rates for Quadrant A Data is divided into 100 sec bins |
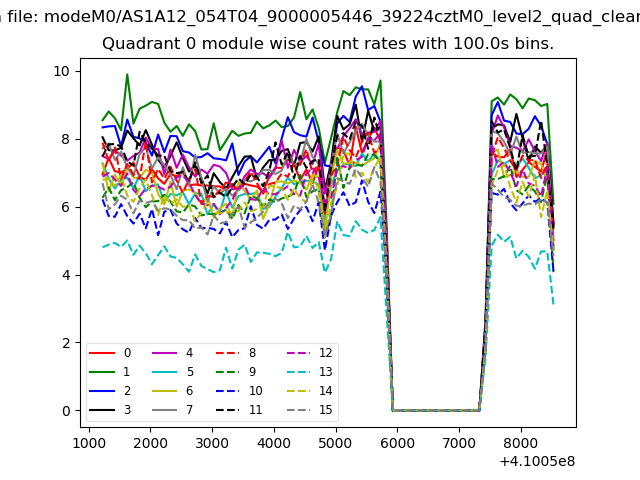 |
 |
| Module-wise count rates for Quadrant B Data is divided into 100 sec bins |
 |
 |
| Module-wise count rates for Quadrant C Data is divided into 100 sec bins |
 |
 |
| Module-wise count rates for Quadrant D Data is divided into 100 sec bins |
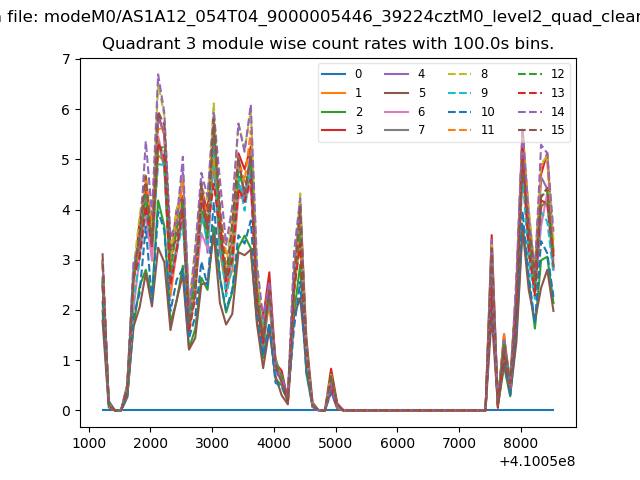 |
 |
| Parameter | Plot |
|---|---|
| CZT HV Monitor | 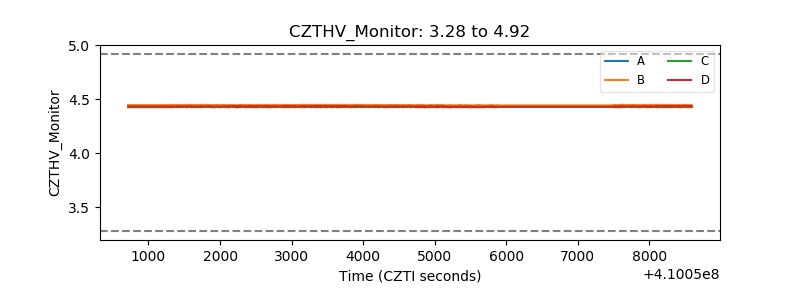 |
| D_VDD | 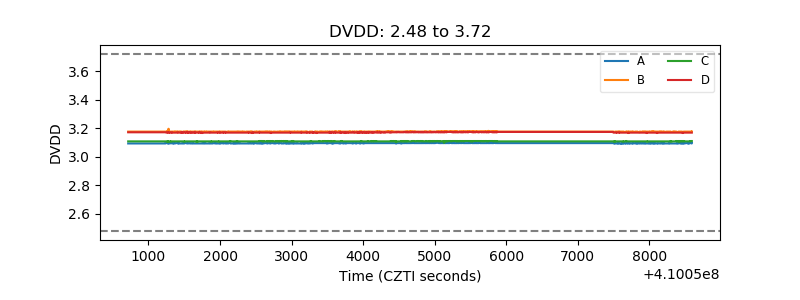 |
| Temperature 1 | 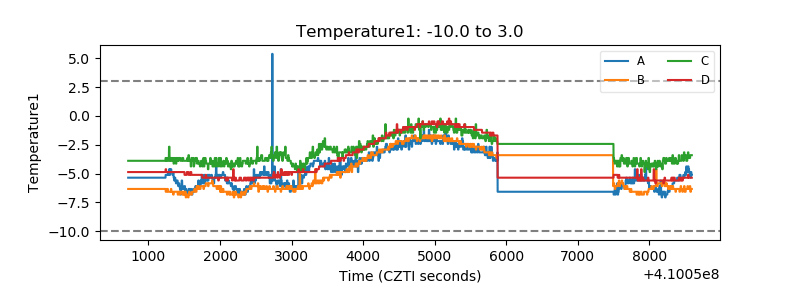 |
| Veto HV Monitor |  |
| Veto LLD | 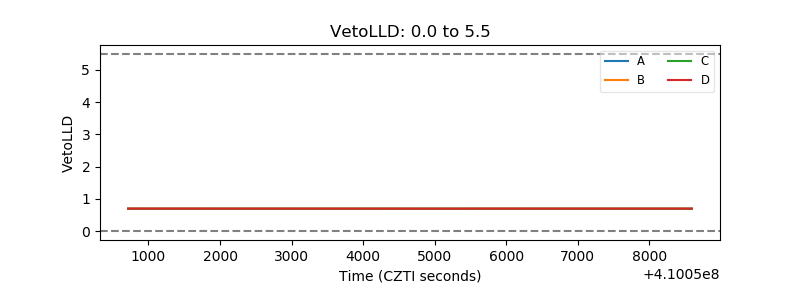 |
| Alpha Counter | 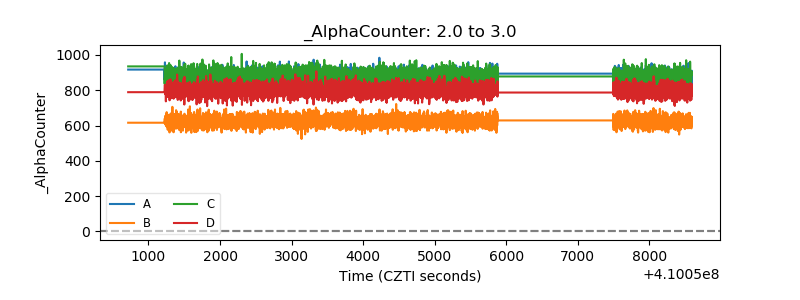 |
| _CPM_Rate | 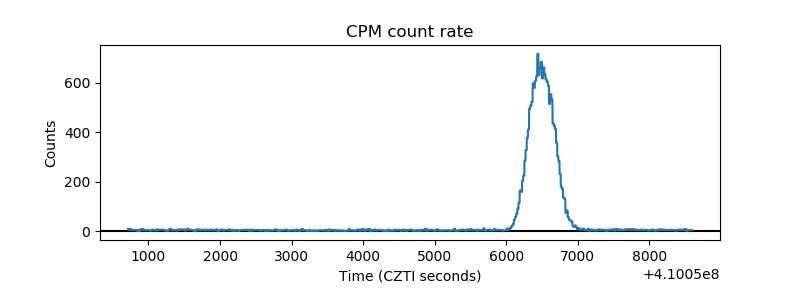 |
| CZT Counter | 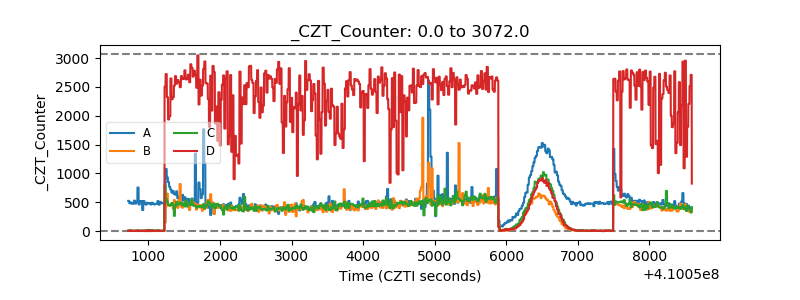 |
| +2.5 Volts monitor | 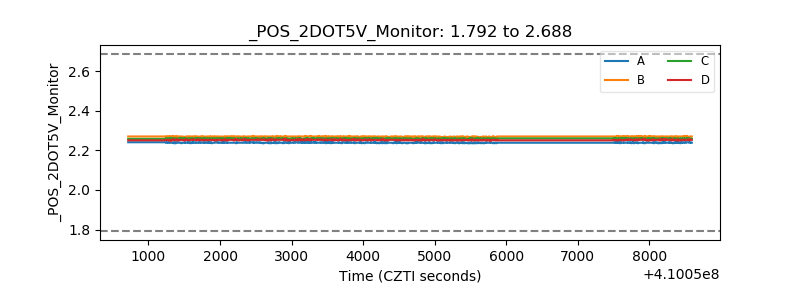 |
| +5 Volts monitor | 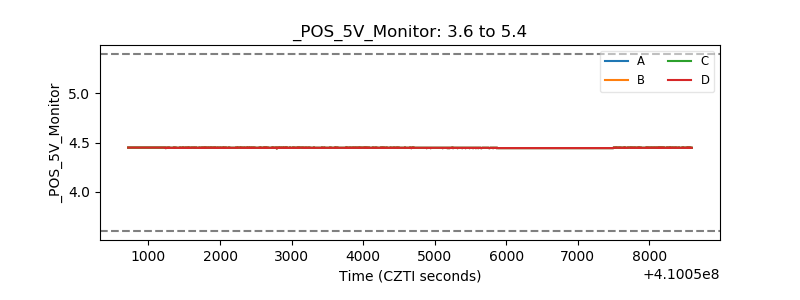 |
| _ROLL_ROT | 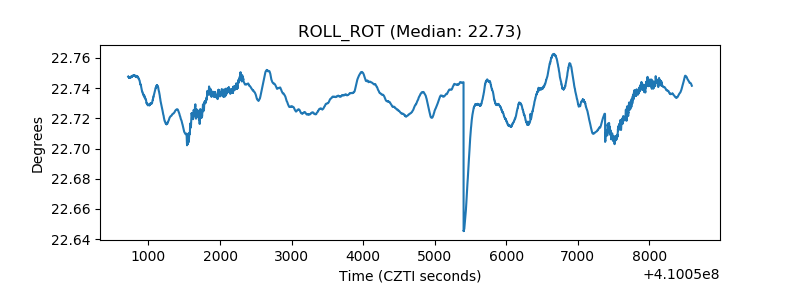 |
| _Roll_DEC | 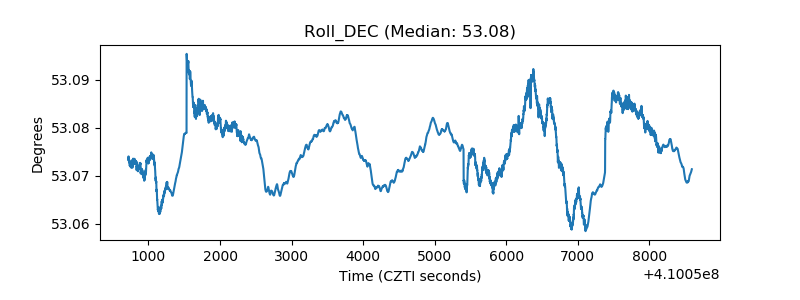 |
| _Roll_RA | 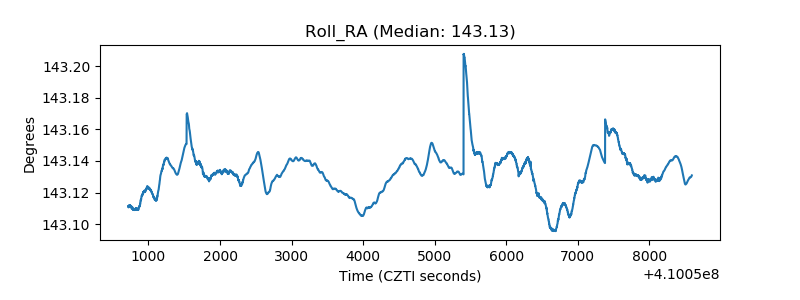 |
| Veto Counter | 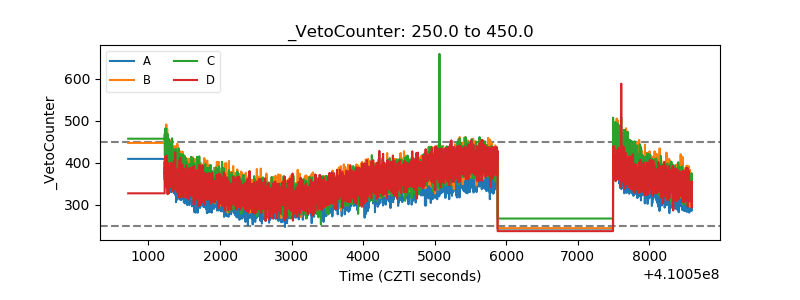 |