| Param | Original file | Final file |
|---|---|---|
| Filename | modeM0/AS1A12_054T04_9000005446_39225cztM0_level2.fits | modeM0/AS1A12_054T04_9000005446_39225cztM0_level2_quad_clean.evt |
| Size (bytes) | 561,162,240 | 83,329,920 |
| Size | 535.2 MB | 79.5 MB |
| Events in quadrant A | 3,014,617 | 641,522 |
| Events in quadrant B | 2,461,643 | 652,162 |
| Events in quadrant C | 2,650,631 | 617,639 |
| Events in quadrant D | 12,214,754 | 223,949 |
| Mode M9 | |||
|---|---|---|---|
| Quadrant | BADHDUFLAG | Total packets | Discarded packets |
| A | 0 | 17 | 0 |
| B | 0 | 17 | 0 |
| C | 0 | 17 | 0 |
| D | 0 | 17 | 0 |
| Mode M0 | |||
|---|---|---|---|
| Quadrant | BADHDUFLAG | Total packets | Discarded packets |
| A | 0 | 12539 | 3 |
| B | 0 | 11272 | 2 |
| C | 0 | 11623 | 2 |
| D | 0 | 40075 | 2 |
| Mode SS | |||
|---|---|---|---|
| Quadrant | BADHDUFLAG | Total packets | Discarded packets |
| A | 0 | 114 | 0 |
| B | 0 | 114 | 0 |
| C | 0 | 114 | 0 |
| D | 0 | 114 | 0 |
| Quadrant | Total seconds | Saturated seconds | Saturation percentage |
|---|---|---|---|
| A | 5536 | 54 | 0.975434% |
| B | 5536 | 8 | 0.144509% |
| C | 5536 | 6 | 0.108382% |
| D | 5536 | 3740 | 67.557803% |
Noise dominated data is calculated using 1-second bins in cleaned event files. If a bin has >2000 counts, and if more than 50% of those come from <1% of pixels, then it is considered to be noise-dominated and hence unusable.
| Quadrant | # 1 sec bins | Bins with >0 counts | Bins with >2000 counts | High rate bins dominated by noise | Noise dominated (total time) | Noise dominated (detector-on time) | Marked lightcurve |
|---|---|---|---|---|---|---|---|
| A | 7269 | 5537 | 36 | 36 | 0.50% | 0.65% | 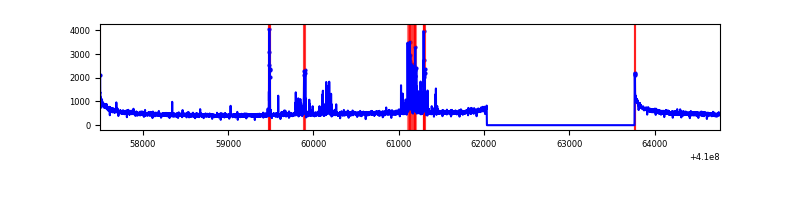 |
| B | 7269 | 5537 | 1 | 1 | 0.01% | 0.02% | 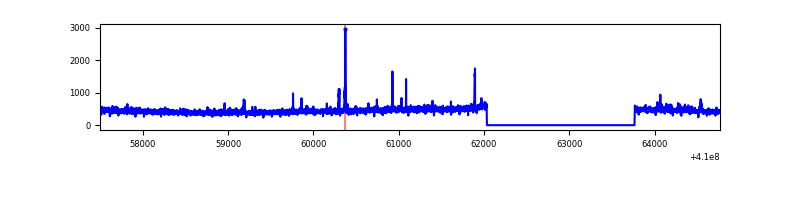 |
| C | 7269 | 5537 | 0 | 0 | 0.00% | 0.00% | 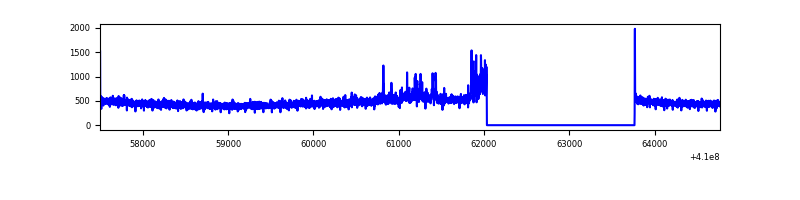 |
| D | 7269 | 5535 | 3315 | 3315 | 45.60% | 59.89% | 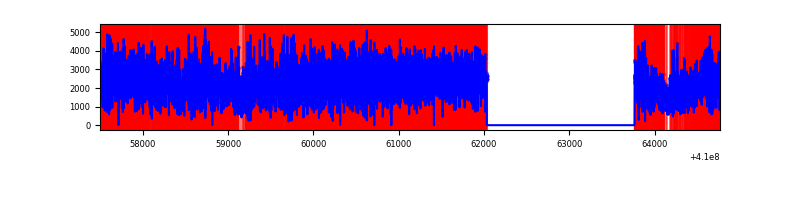 |
Top three noisy pixels from each quadrant. If the there are fewer than three noisy pixels in the level2.evt file, extra rows are filled as -1
| Pixel properties | Quadrant properties | ||||||
|---|---|---|---|---|---|---|---|
| Quadrant | DetID | PixID | Counts | Sigma | Mean | Median | Sigma |
| A | 10 | 83 | 429930 | 3480.12 | 607 | 595 | 123.4 |
| A | 13 | 248 | 235725 | 1905.92 | 607 | 595 | 123.4 |
| A | 13 | 254 | 8576 | 64.69 | 607 | 595 | 123.4 |
| B | 5 | 172 | 30427 | 254.83 | 603 | 586 | 117.1 |
| B | 5 | 184 | 28975 | 242.43 | 603 | 586 | 117.1 |
| B | 0 | 190 | 20802 | 172.64 | 603 | 586 | 117.1 |
| C | 15 | 214 | 230817 | 1692.32 | 585 | 588 | 136.0 |
| C | 0 | 239 | 127157 | 930.36 | 585 | 588 | 136.0 |
| C | 0 | 10 | 9598 | 66.23 | 585 | 588 | 136.0 |
| D | 12 | 235 | 10078421 | 104683.05 | 392 | 380 | 96.3 |
| D | 5 | 222 | 331863 | 3443.19 | 392 | 380 | 96.3 |
| D | 2 | 249 | 155188 | 1608.03 | 392 | 380 | 96.3 |
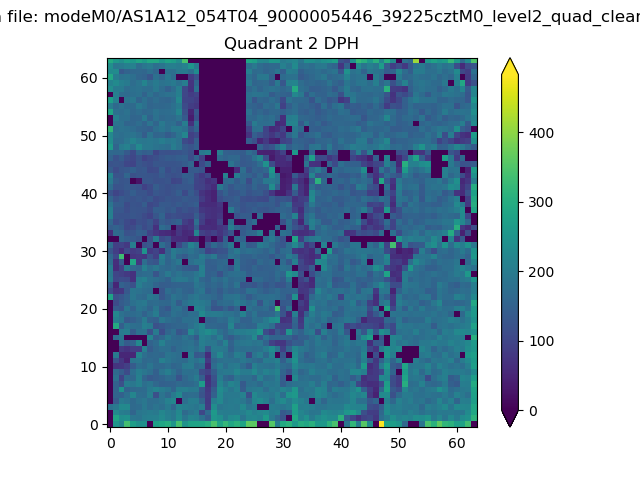
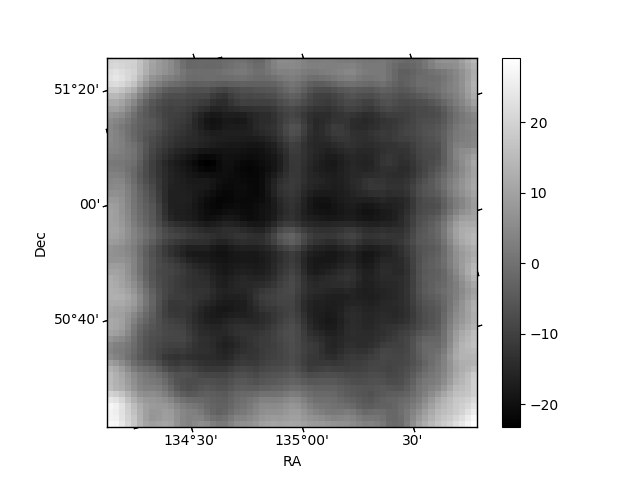
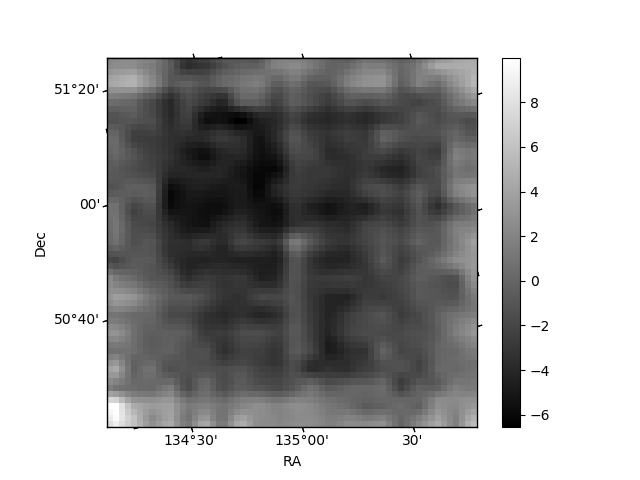
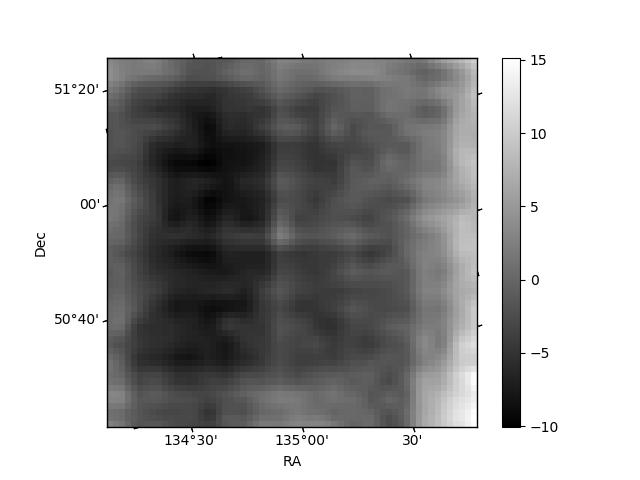
Histogram calculated using DETX and DETY for each event in the final _common_clean file
| Quadrant A | 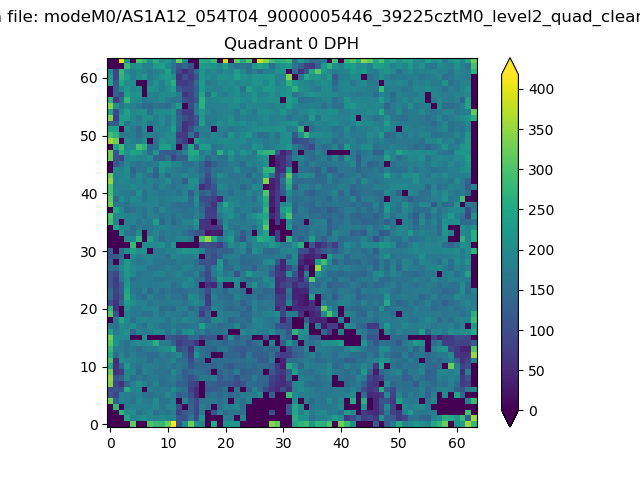 |
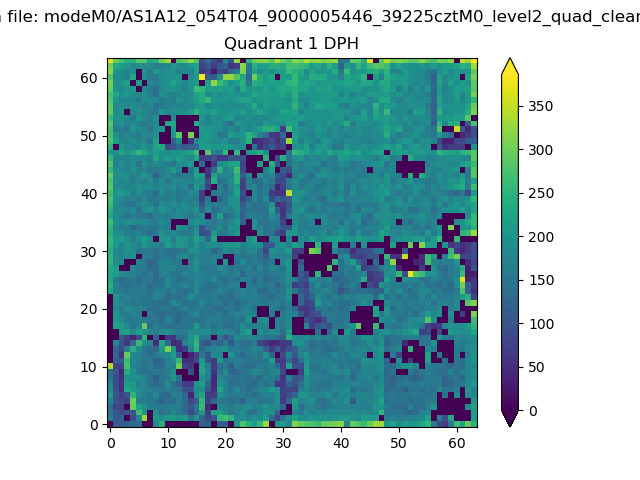 |
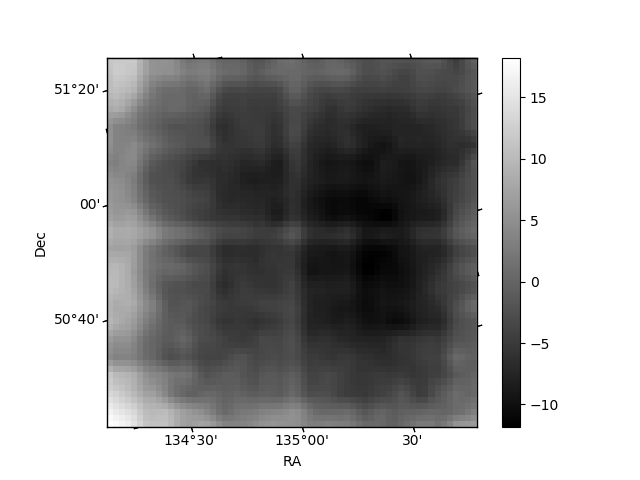
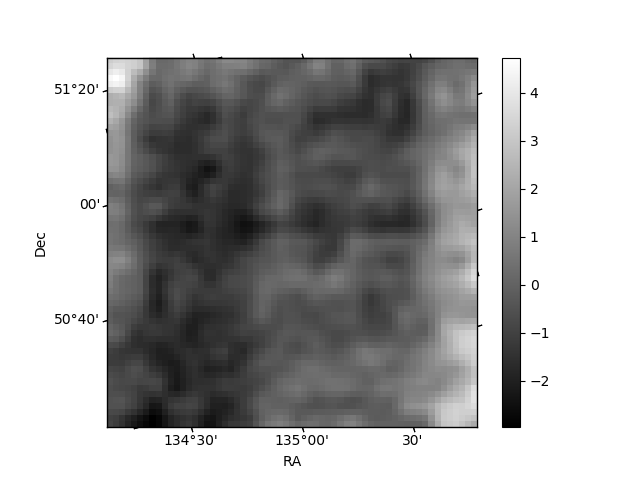
Quadrant B |
|---|---|---|---|
| Quadrant D | 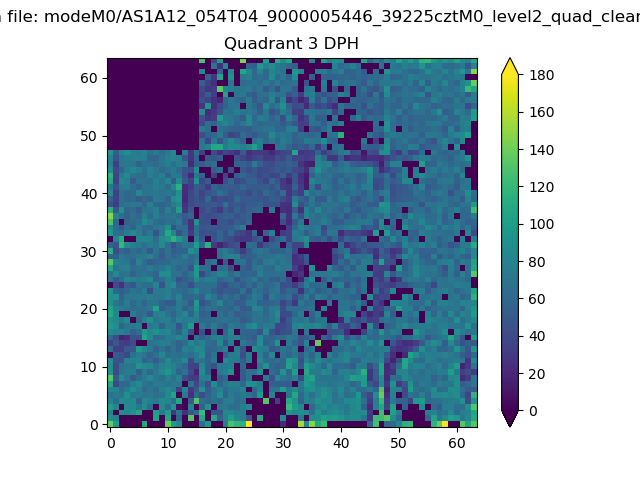 |
 |
Quadrant C |
| Plot type | Count rate plots | Images |
|---|---|---|
| Comparison with Poisson distribution Blue bars denote a histogram of data divided into 1 sec bins. Red curve is a Poisson curve with rate = median count rate of data. |
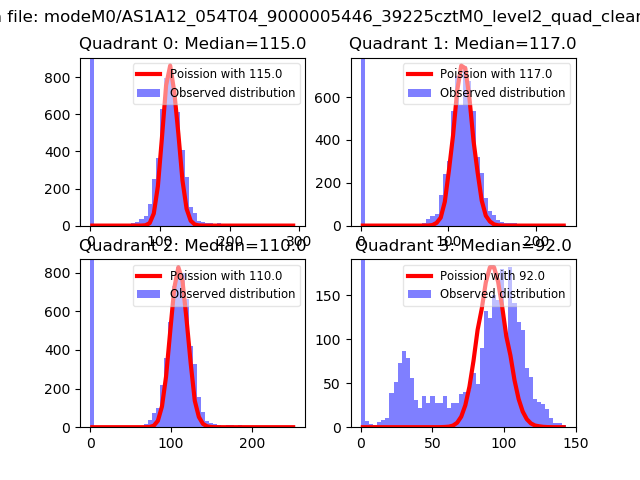 |
 |
| Quadrant-wise count rates Data is divided into 100 sec bins |
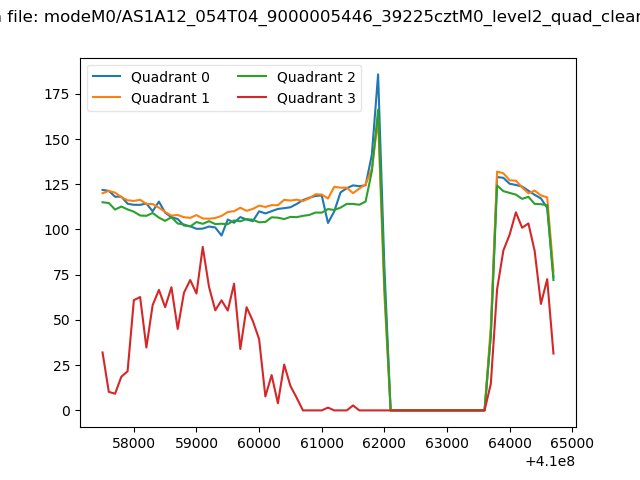 |
|
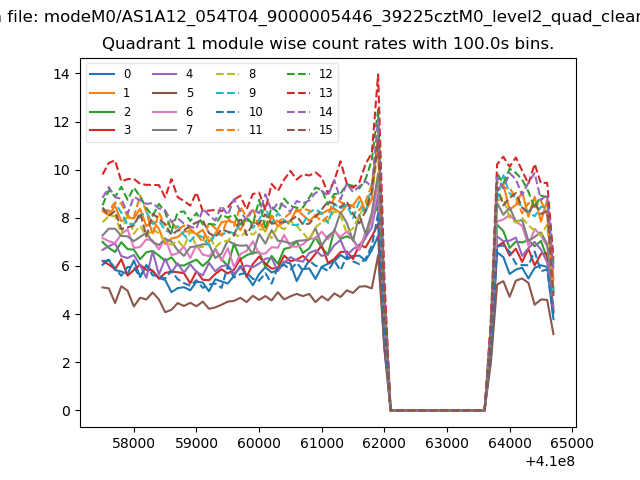
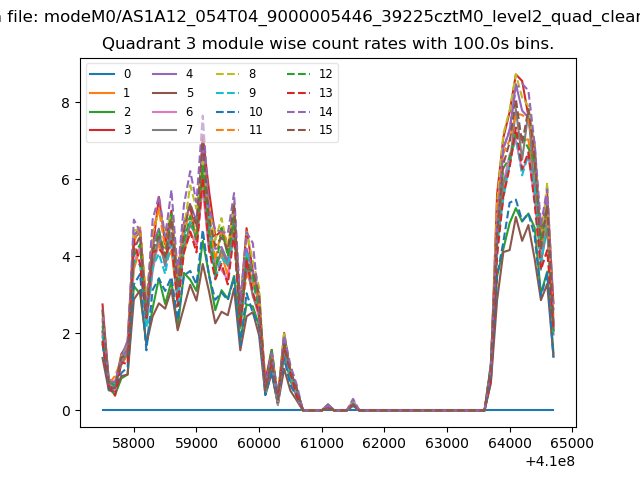
| Module-wise count rates for Quadrant A Data is divided into 100 sec bins |
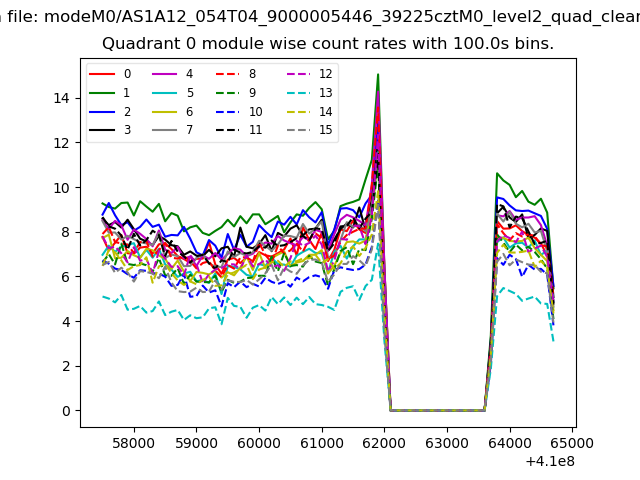 |
 |
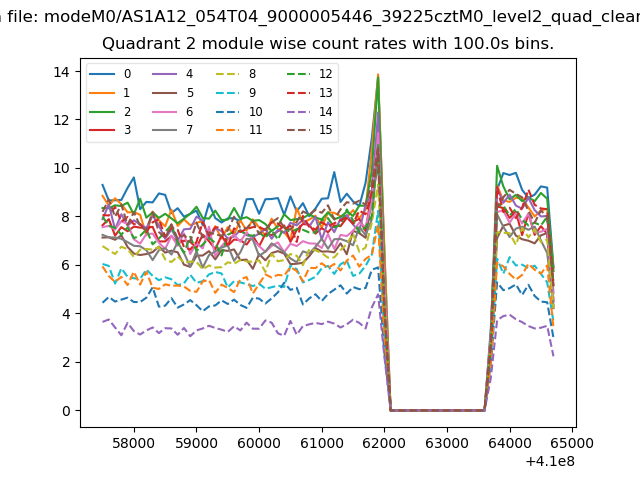
| Module-wise count rates for Quadrant B Data is divided into 100 sec bins |
 |
 |
| Module-wise count rates for Quadrant C Data is divided into 100 sec bins |
 |
 |
| Module-wise count rates for Quadrant D Data is divided into 100 sec bins |
 |
 |
| Parameter | Plot |
|---|---|
| CZT HV Monitor | 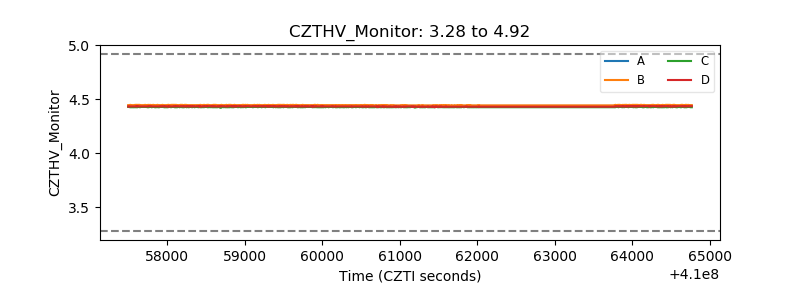 |
| D_VDD | 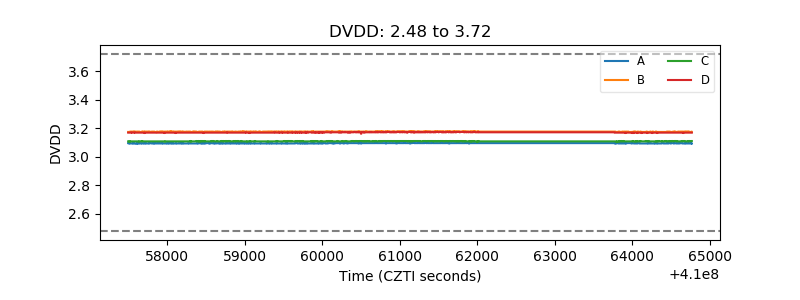 |
| Temperature 1 | 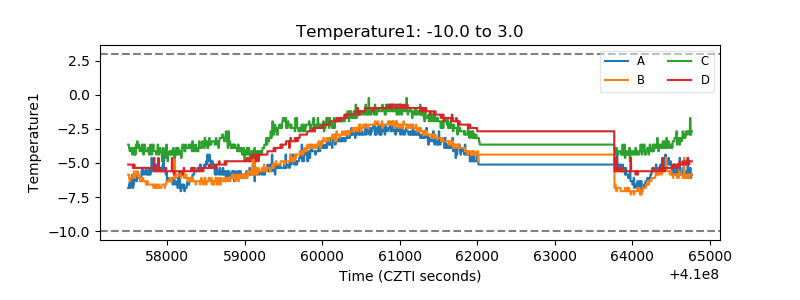 |
| Veto HV Monitor |  |
| Veto LLD | 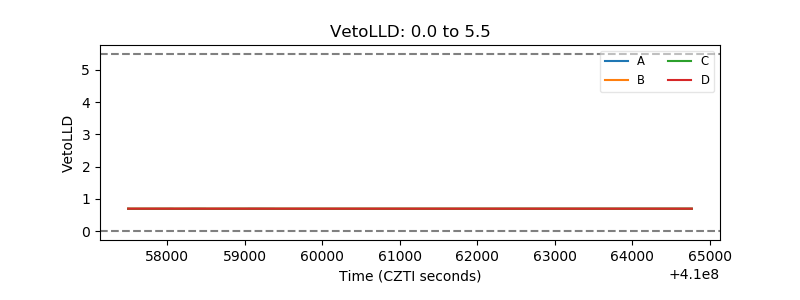 |
| Alpha Counter | 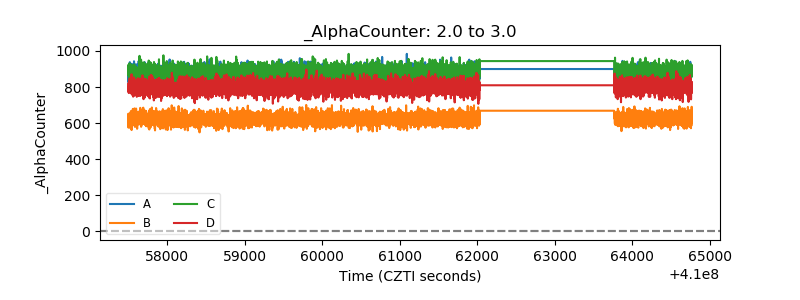 |
| _CPM_Rate | 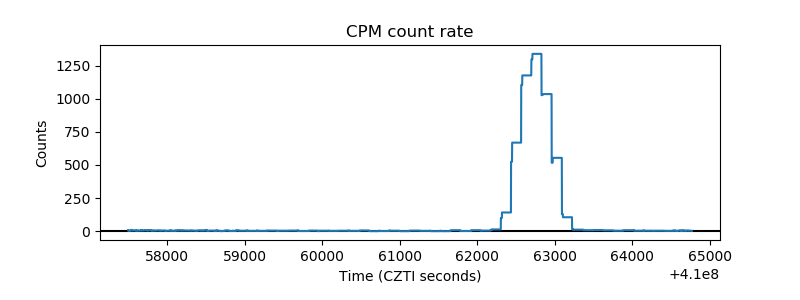 |
| CZT Counter | 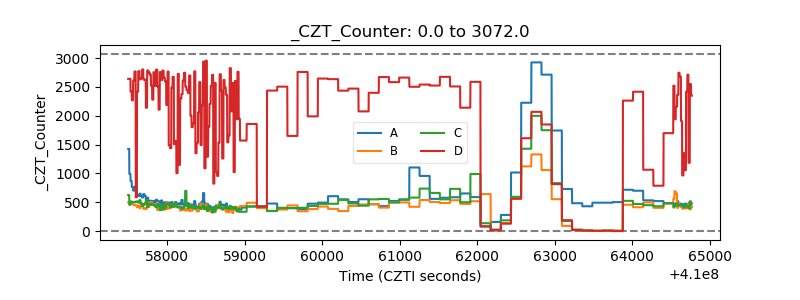 |
| +2.5 Volts monitor | 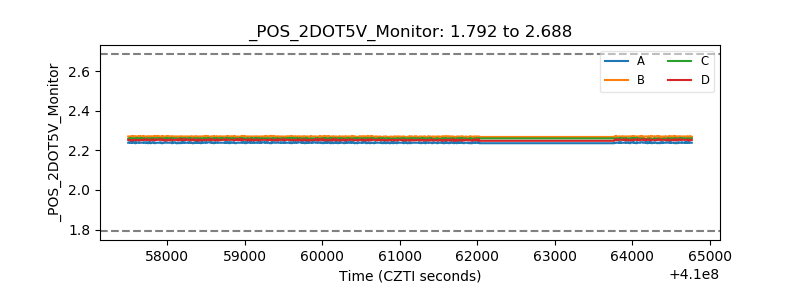 |
| +5 Volts monitor | 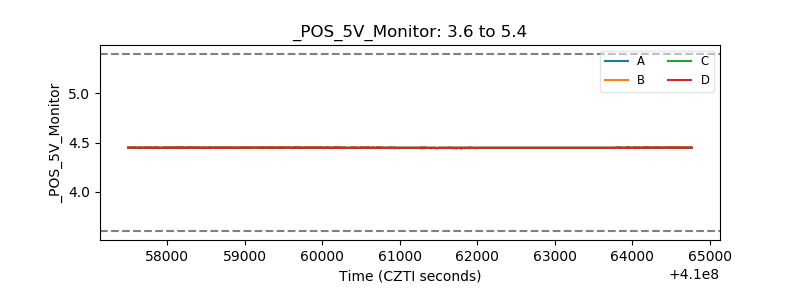 |
| _ROLL_ROT | 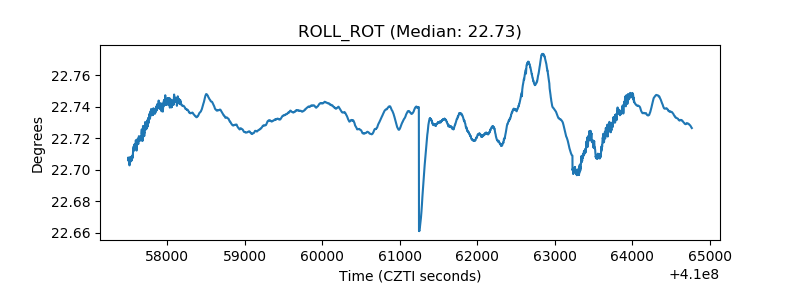 |
| _Roll_DEC | 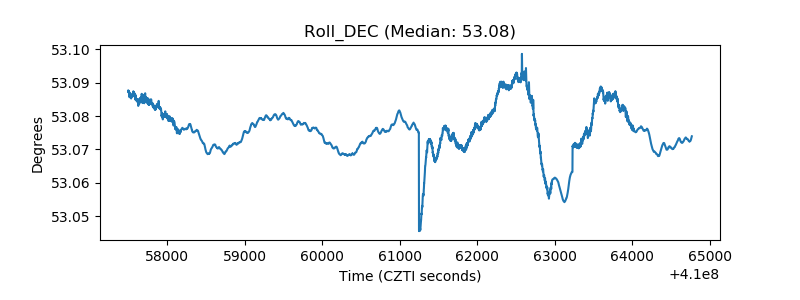 |
| _Roll_RA | 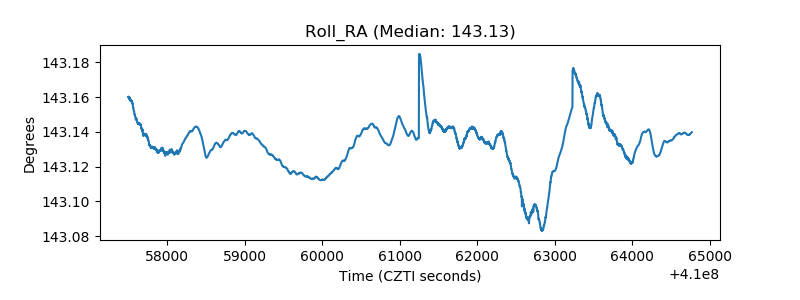 |
| Veto Counter | 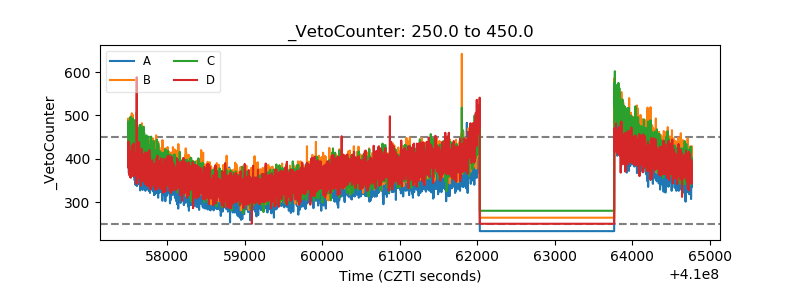 |