| Param | Original file | Final file |
|---|---|---|
| Filename | modeM0/AS1A12_054T04_9000005446_39228cztM0_level2.fits | modeM0/AS1A12_054T04_9000005446_39228cztM0_level2_quad_clean.evt |
| Size (bytes) | 992,165,760 | 148,979,520 |
| Size | 946.2 MB | 142.1 MB |
| Events in quadrant A | 5,254,807 | 1,175,075 |
| Events in quadrant B | 4,494,241 | 1,198,340 |
| Events in quadrant C | 4,584,251 | 1,116,621 |
| Events in quadrant D | 21,647,662 | 354,119 |
| Mode M9 | |||
|---|---|---|---|
| Quadrant | BADHDUFLAG | Total packets | Discarded packets |
| A | 0 | 38 | 0 |
| B | 0 | 38 | 0 |
| C | 0 | 38 | 0 |
| D | 0 | 38 | 0 |
| Mode M0 | |||
|---|---|---|---|
| Quadrant | BADHDUFLAG | Total packets | Discarded packets |
| A | 0 | 21276 | 3 |
| B | 0 | 19721 | 2 |
| C | 0 | 19498 | 4 |
| D | 0 | 70913 | 2 |
| Mode SS | |||
|---|---|---|---|
| Quadrant | BADHDUFLAG | Total packets | Discarded packets |
| A | 0 | 196 | 0 |
| B | 0 | 196 | 0 |
| C | 0 | 196 | 0 |
| D | 0 | 196 | 0 |
| Quadrant | Total seconds | Saturated seconds | Saturation percentage |
|---|---|---|---|
| A | 9620 | 64 | 0.665281% |
| B | 9620 | 18 | 0.187110% |
| C | 9619 | 8 | 0.083169% |
| D | 9620 | 6984 | 72.598753% |
Noise dominated data is calculated using 1-second bins in cleaned event files. If a bin has >2000 counts, and if more than 50% of those come from <1% of pixels, then it is considered to be noise-dominated and hence unusable.
| Quadrant | # 1 sec bins | Bins with >0 counts | Bins with >2000 counts | High rate bins dominated by noise | Noise dominated (total time) | Noise dominated (detector-on time) | Marked lightcurve |
|---|---|---|---|---|---|---|---|
| A | 13447 | 9622 | 43 | 43 | 0.32% | 0.45% | 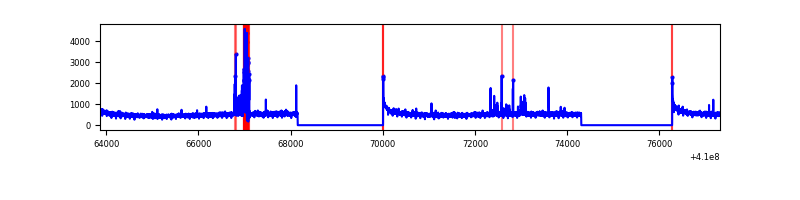 |
| B | 13447 | 9622 | 8 | 8 | 0.06% | 0.08% | 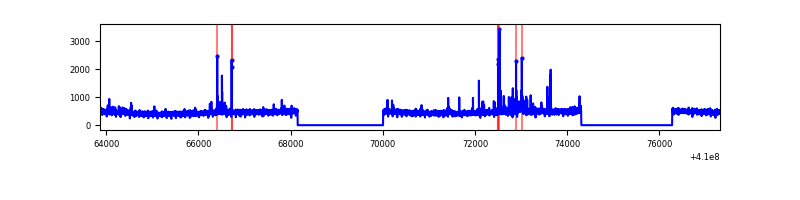 |
| C | 13447 | 9622 | 0 | 0 | 0.00% | 0.00% | 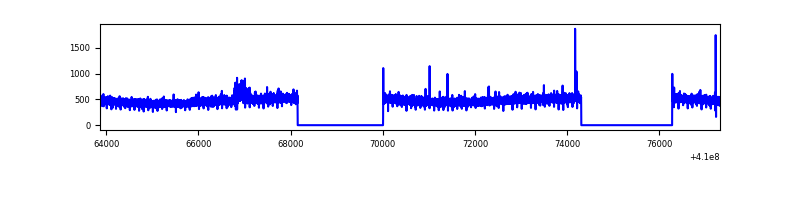 |
| D | 13447 | 9620 | 6125 | 6125 | 45.55% | 63.67% |  |
Top three noisy pixels from each quadrant. If the there are fewer than three noisy pixels in the level2.evt file, extra rows are filled as -1
| Pixel properties | Quadrant properties | ||||||
|---|---|---|---|---|---|---|---|
| Quadrant | DetID | PixID | Counts | Sigma | Mean | Median | Sigma |
| A | 10 | 83 | 690485 | 3101.39 | 1111 | 1091 | 222.3 |
| A | 13 | 248 | 271524 | 1216.6 | 1111 | 1091 | 222.3 |
| A | 13 | 254 | 13287 | 54.87 | 1111 | 1091 | 222.3 |
| B | 5 | 172 | 83839 | 402.95 | 1095 | 1067 | 205.4 |
| B | 5 | 255 | 68287 | 327.24 | 1095 | 1067 | 205.4 |
| B | 12 | 111 | 25256 | 117.76 | 1095 | 1067 | 205.4 |
| C | 15 | 214 | 400035 | 1644.39 | 1057 | 1060 | 242.6 |
| C | 0 | 239 | 31857 | 126.93 | 1057 | 1060 | 242.6 |
| C | 9 | 187 | 10102 | 37.26 | 1057 | 1060 | 242.6 |
| D | 12 | 235 | 17717601 | 109767.86 | 661 | 642 | 161.4 |
| D | 1 | 47 | 485047 | 3001.2 | 661 | 642 | 161.4 |
| D | 2 | 249 | 442351 | 2736.67 | 661 | 642 | 161.4 |
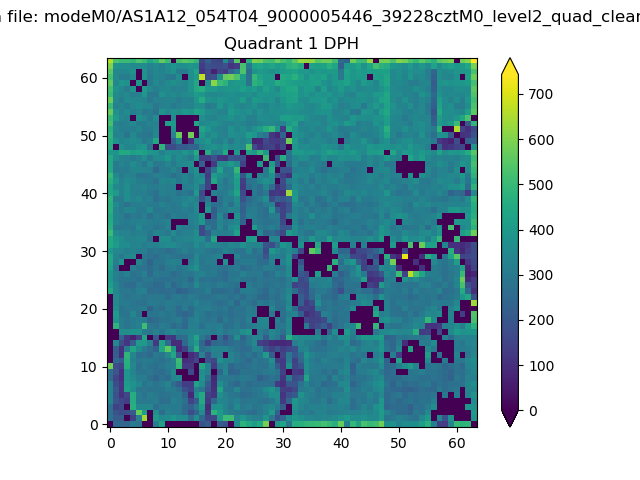
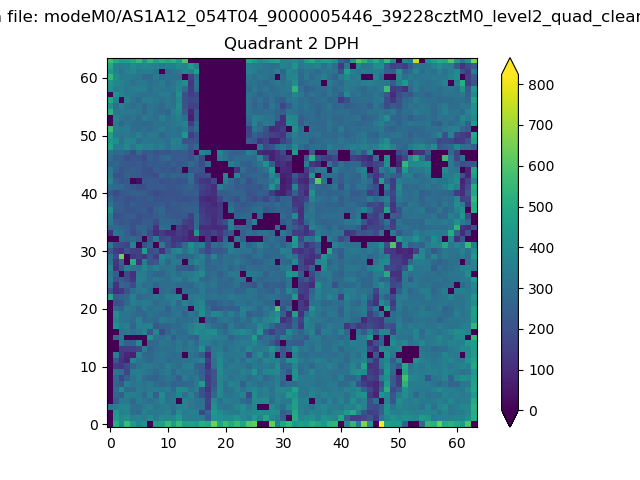
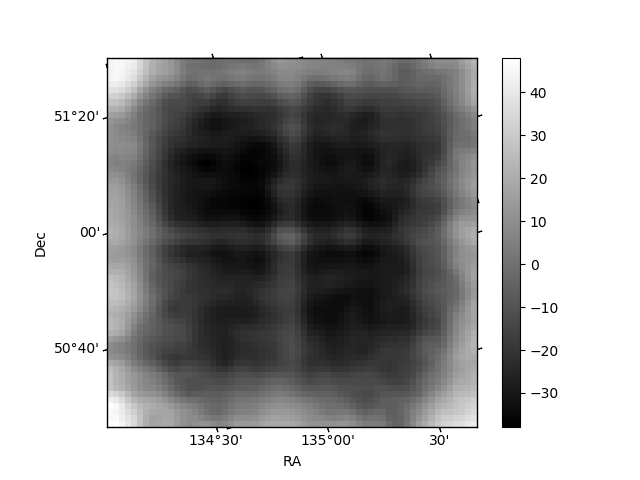
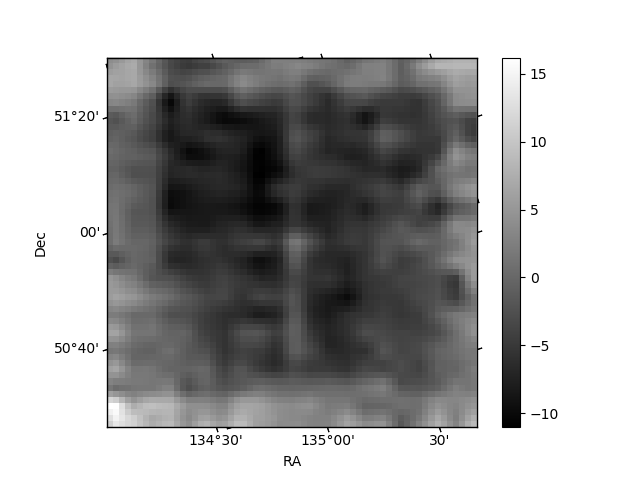
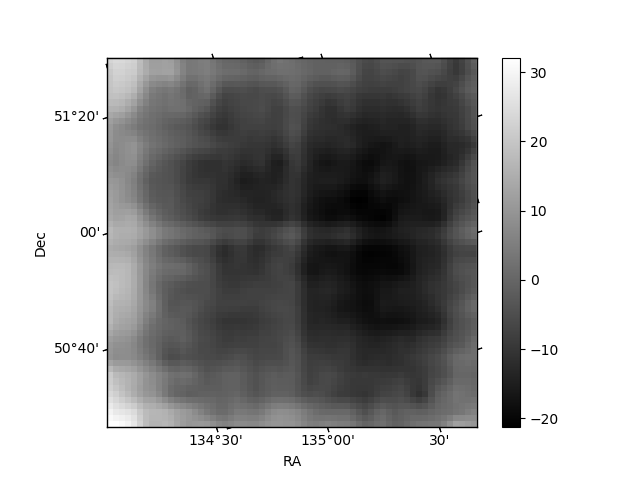
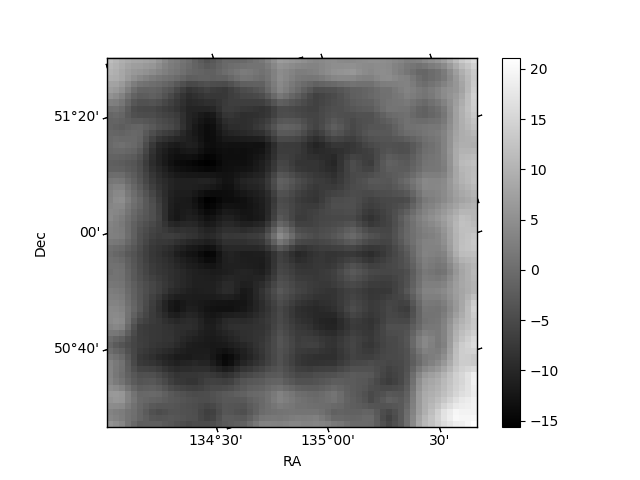
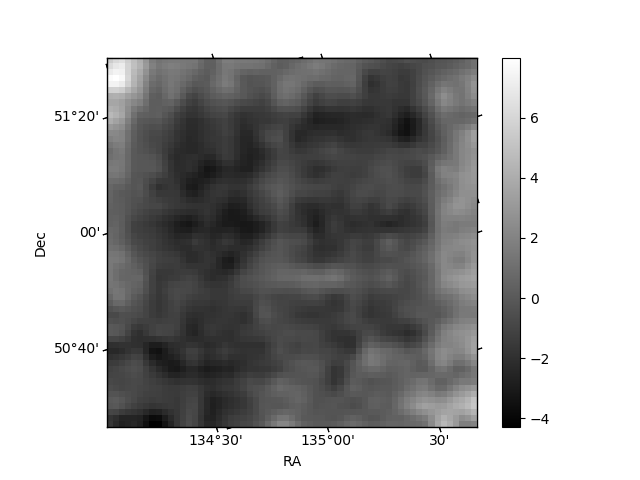
Histogram calculated using DETX and DETY for each event in the final _common_clean file
| Quadrant A | 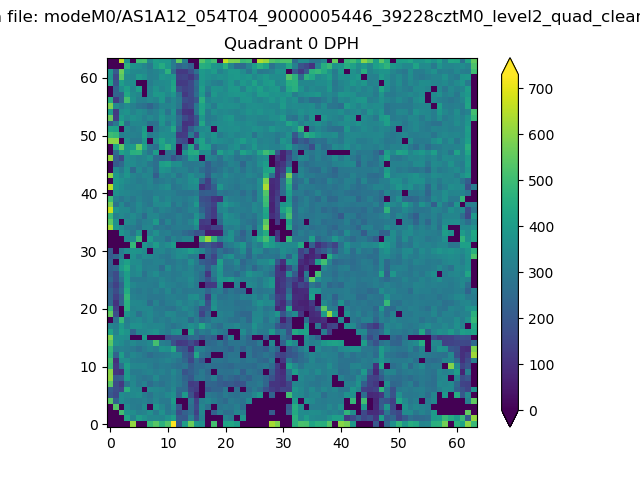 |
 |
Quadrant B |
|---|---|---|---|
| Quadrant D | 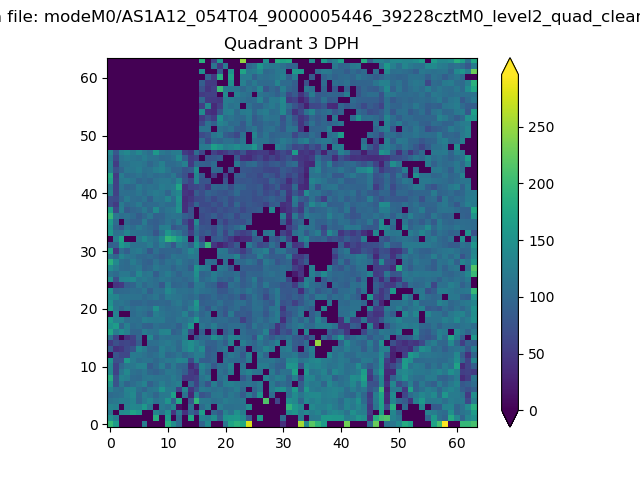 |
 |
Quadrant C |
| Plot type | Count rate plots | Images |
|---|---|---|
| Comparison with Poisson distribution Blue bars denote a histogram of data divided into 1 sec bins. Red curve is a Poisson curve with rate = median count rate of data. |
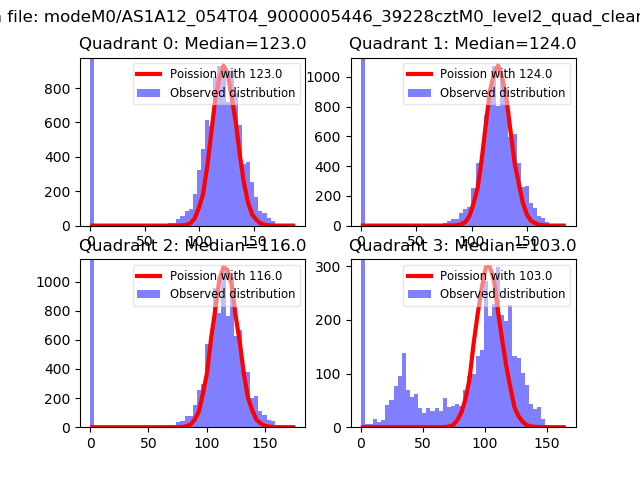 |
 |
| Quadrant-wise count rates Data is divided into 100 sec bins |
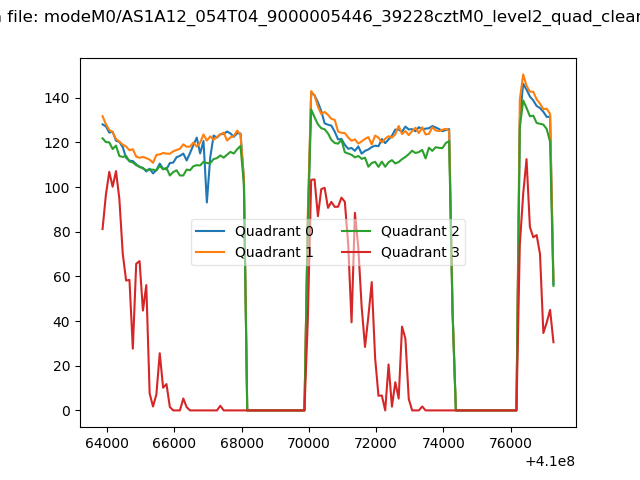 |
|
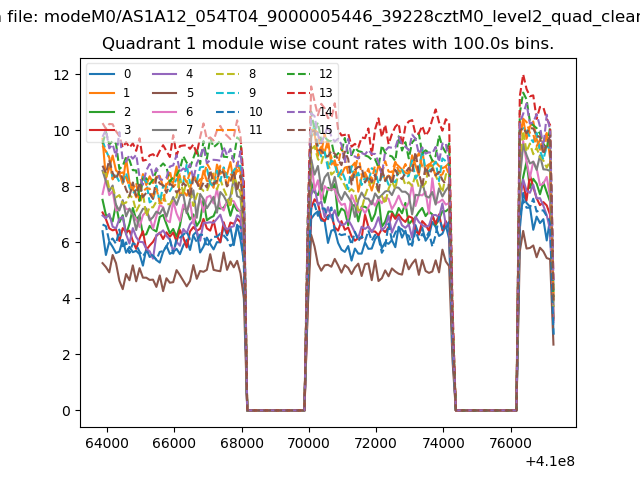
| Module-wise count rates for Quadrant A Data is divided into 100 sec bins |
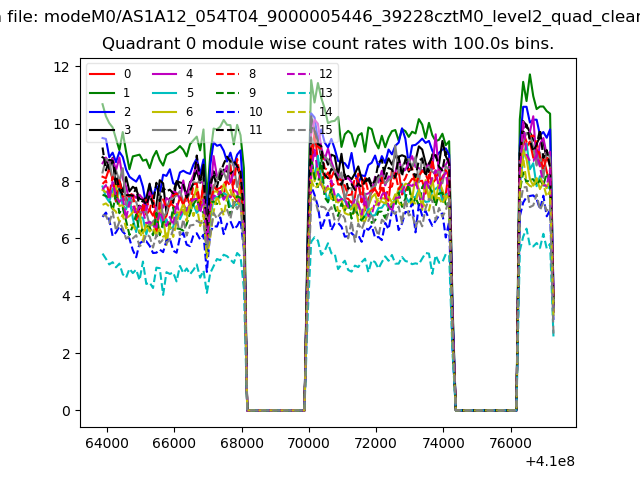 |
 |
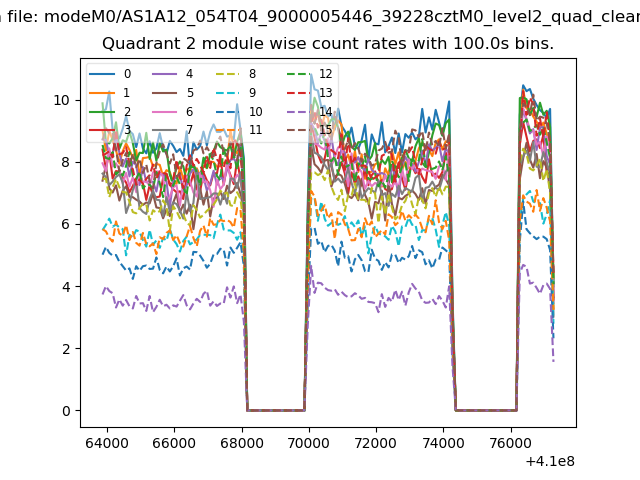
| Module-wise count rates for Quadrant B Data is divided into 100 sec bins |
 |
 |
| Module-wise count rates for Quadrant C Data is divided into 100 sec bins |
 |
 |
| Module-wise count rates for Quadrant D Data is divided into 100 sec bins |
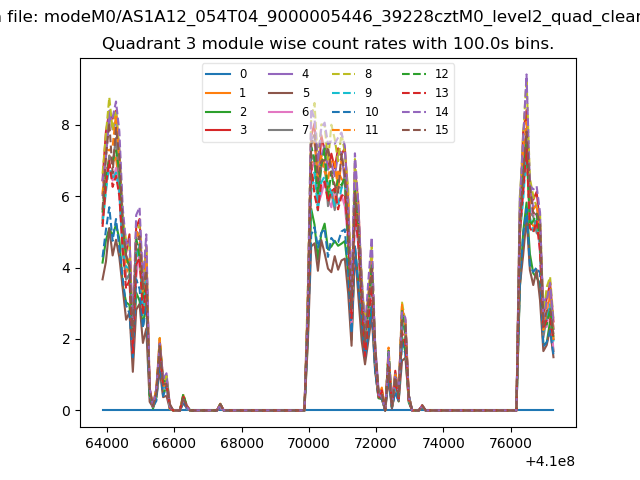 |
 |
| Parameter | Plot |
|---|---|
| CZT HV Monitor | 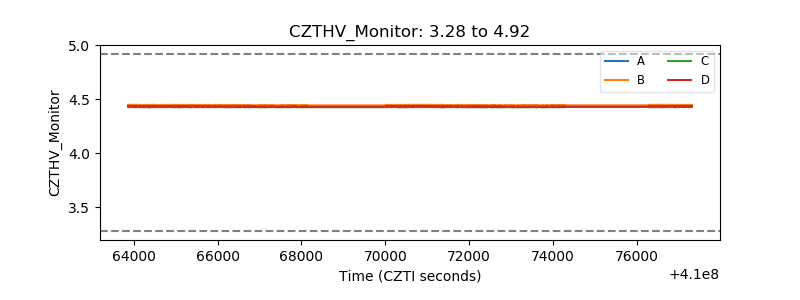 |
| D_VDD | 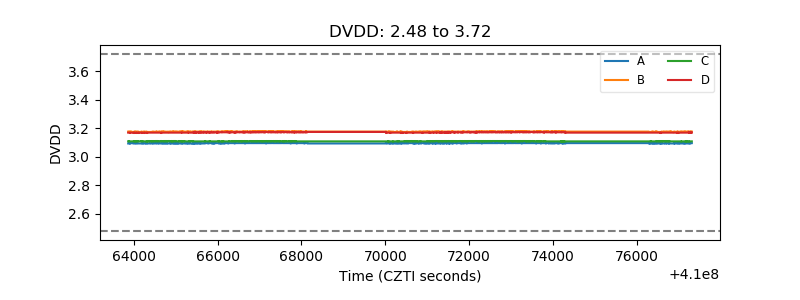 |
| Temperature 1 | 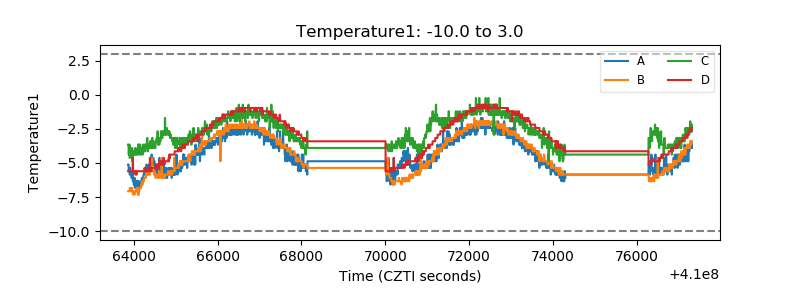 |
| Veto HV Monitor |  |
| Veto LLD | 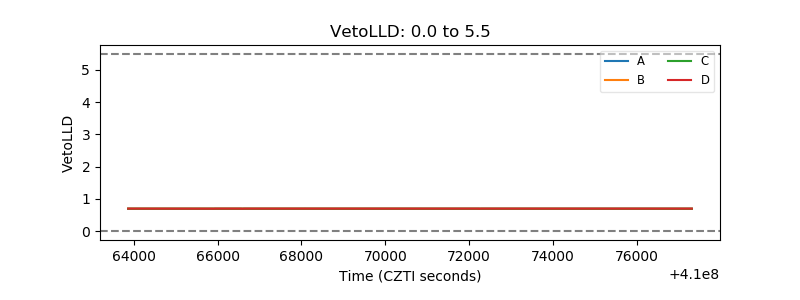 |
| Alpha Counter | 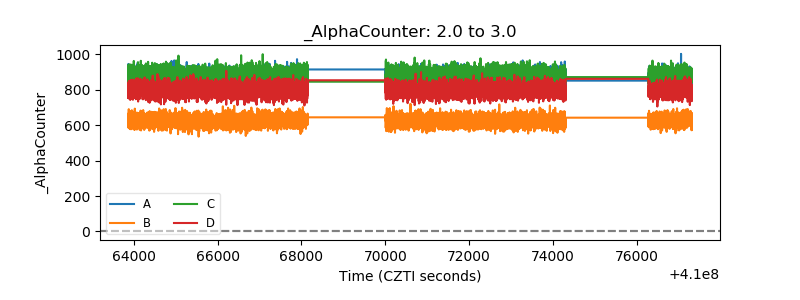 |
| _CPM_Rate | 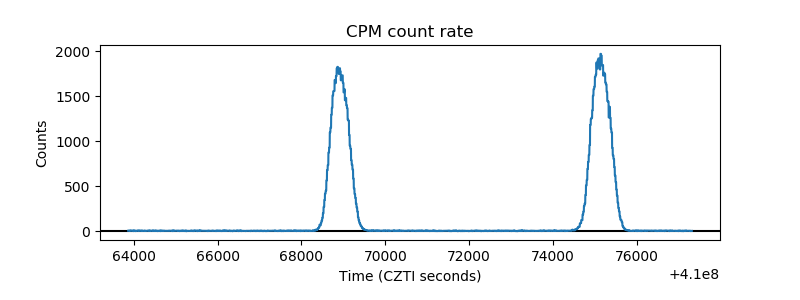 |
| CZT Counter | 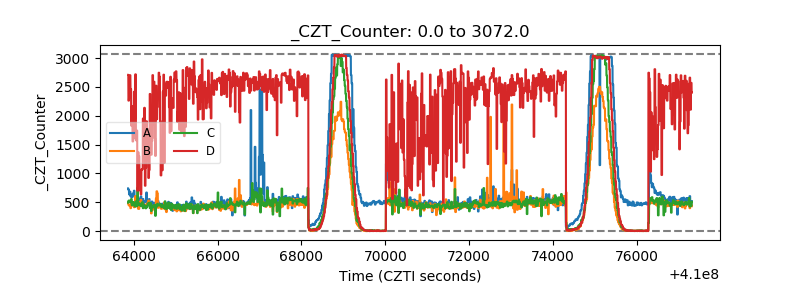 |
| +2.5 Volts monitor | 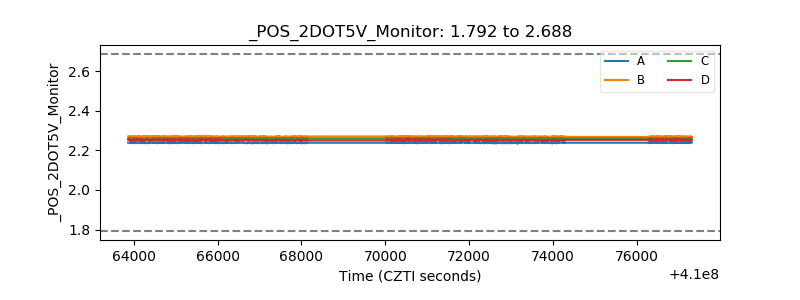 |
| +5 Volts monitor | 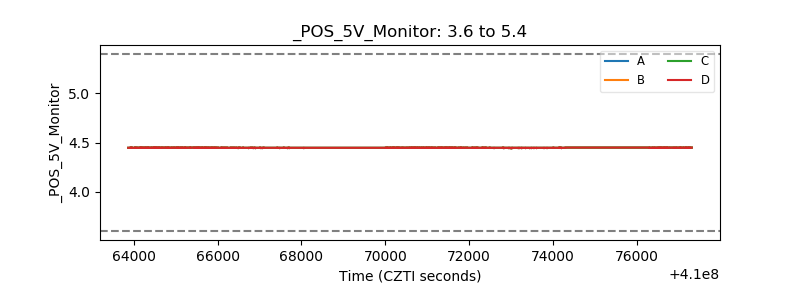 |
| _ROLL_ROT | 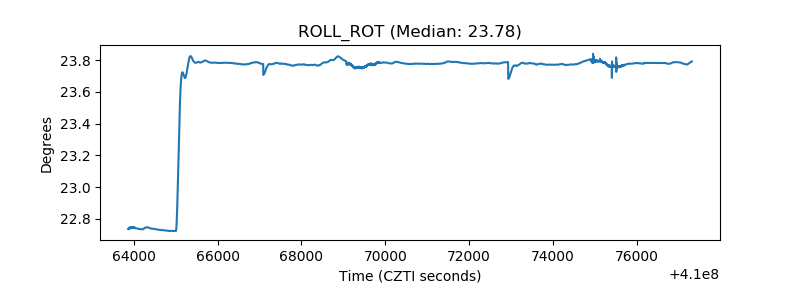 |
| _Roll_DEC | 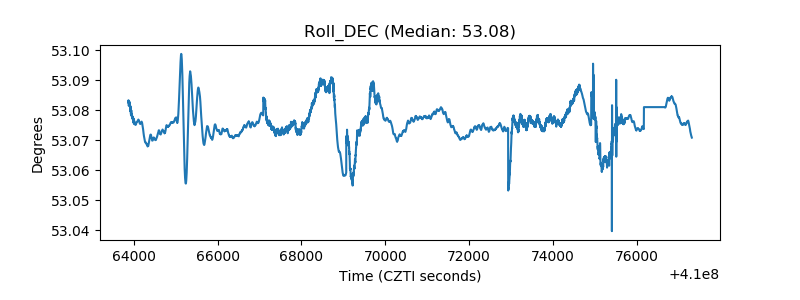 |
| _Roll_RA | 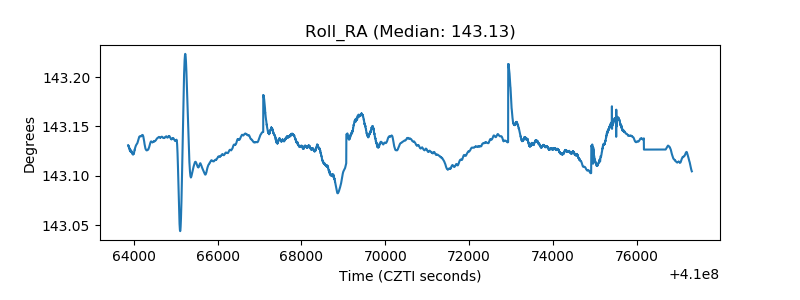 |
| Veto Counter | 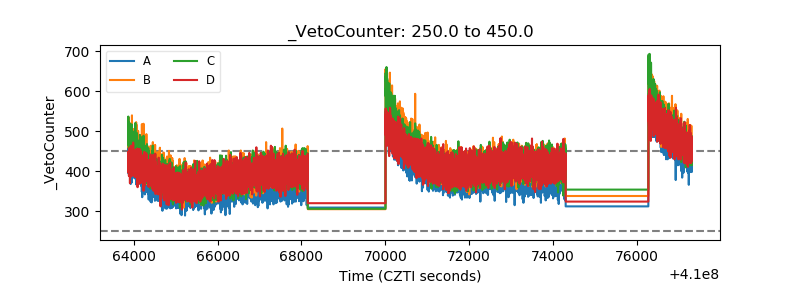 |