| Param | Original file | Final file |
|---|---|---|
| Filename | modeM0/AS1A12_054T04_9000005446_39229cztM0_level2.fits | modeM0/AS1A12_054T04_9000005446_39229cztM0_level2_quad_clean.evt |
| Size (bytes) | 517,196,160 | 77,705,280 |
| Size | 493.2 MB | 74.1 MB |
| Events in quadrant A | 2,774,219 | 630,888 |
| Events in quadrant B | 2,361,867 | 641,054 |
| Events in quadrant C | 2,387,618 | 590,518 |
| Events in quadrant D | 11,244,548 | 151,528 |
| Mode M9 | |||
|---|---|---|---|
| Quadrant | BADHDUFLAG | Total packets | Discarded packets |
| A | 0 | 21 | 0 |
| B | 0 | 21 | 0 |
| C | 0 | 21 | 0 |
| D | 0 | 21 | 0 |
| Mode M0 | |||
|---|---|---|---|
| Quadrant | BADHDUFLAG | Total packets | Discarded packets |
| A | 0 | 10910 | 2 |
| B | 0 | 10001 | 1 |
| C | 0 | 9793 | 1 |
| D | 0 | 36738 | 1 |
| Mode SS | |||
|---|---|---|---|
| Quadrant | BADHDUFLAG | Total packets | Discarded packets |
| A | 0 | 98 | 0 |
| B | 0 | 98 | 0 |
| C | 0 | 98 | 0 |
| D | 0 | 98 | 0 |
| Quadrant | Total seconds | Saturated seconds | Saturation percentage |
|---|---|---|---|
| A | 4833 | 57 | 1.179392% |
| B | 4833 | 5 | 0.103455% |
| C | 4833 | 4 | 0.082764% |
| D | 4833 | 3886 | 80.405545% |
Noise dominated data is calculated using 1-second bins in cleaned event files. If a bin has >2000 counts, and if more than 50% of those come from <1% of pixels, then it is considered to be noise-dominated and hence unusable.
| Quadrant | # 1 sec bins | Bins with >0 counts | Bins with >2000 counts | High rate bins dominated by noise | Noise dominated (total time) | Noise dominated (detector-on time) | Marked lightcurve |
|---|---|---|---|---|---|---|---|
| A | 6896 | 4834 | 43 | 43 | 0.62% | 0.89% | 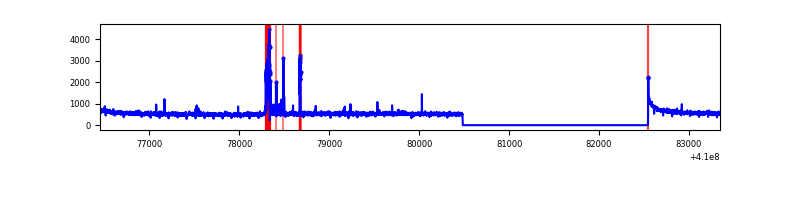 |
| B | 6896 | 4834 | 1 | 1 | 0.01% | 0.02% | 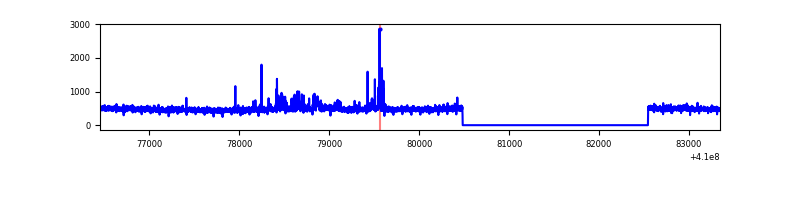 |
| C | 6896 | 4834 | 3 | 3 | 0.04% | 0.06% | 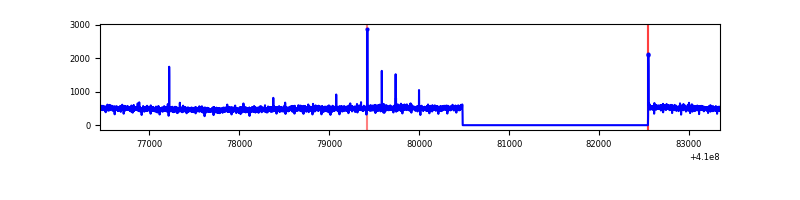 |
| D | 6896 | 4832 | 3010 | 3010 | 43.65% | 62.29% | 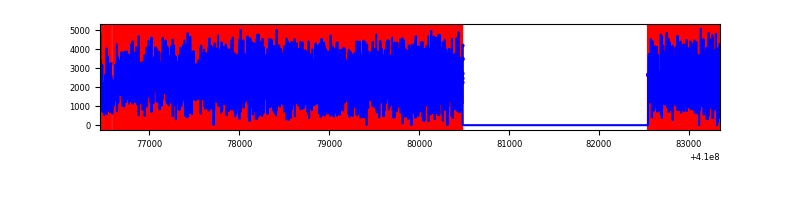 |
Top three noisy pixels from each quadrant. If the there are fewer than three noisy pixels in the level2.evt file, extra rows are filled as -1
| Pixel properties | Quadrant properties | ||||||
|---|---|---|---|---|---|---|---|
| Quadrant | DetID | PixID | Counts | Sigma | Mean | Median | Sigma |
| A | 10 | 83 | 350543 | 2998.95 | 583 | 573 | 116.7 |
| A | 13 | 248 | 162629 | 1388.68 | 583 | 573 | 116.7 |
| A | 15 | 174 | 8953 | 71.81 | 583 | 573 | 116.7 |
| B | 5 | 172 | 108635 | 989.32 | 572 | 558 | 109.2 |
| B | 12 | 111 | 12917 | 113.13 | 572 | 558 | 109.2 |
| B | 11 | 111 | 11788 | 102.8 | 572 | 558 | 109.2 |
| C | 15 | 214 | 202000 | 1576.09 | 552 | 554 | 127.8 |
| C | 0 | 10 | 7607 | 55.18 | 552 | 554 | 127.8 |
| C | 8 | 79 | 6077 | 43.21 | 552 | 554 | 127.8 |
| D | 12 | 235 | 9601430 | 114100.39 | 346 | 336 | 84.1 |
| D | 2 | 249 | 65133 | 770.05 | 346 | 336 | 84.1 |
| D | 2 | 153 | 59744 | 706.01 | 346 | 336 | 84.1 |
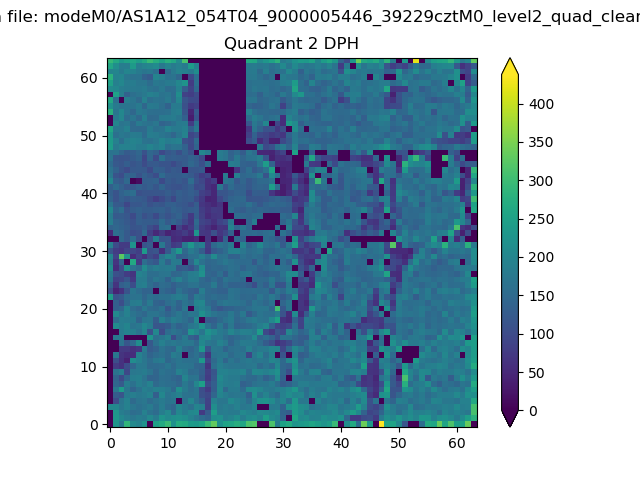
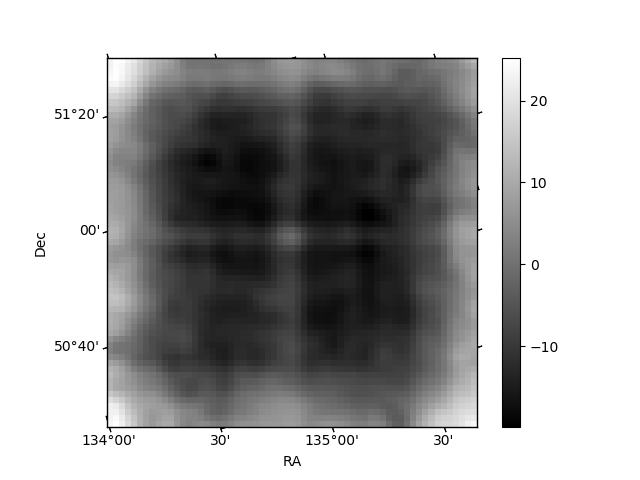
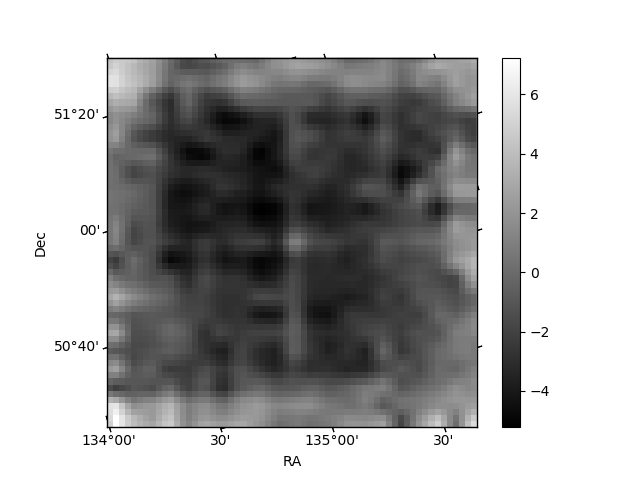
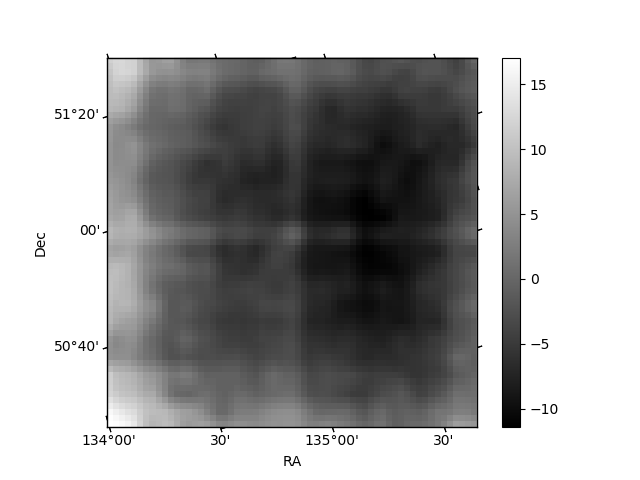
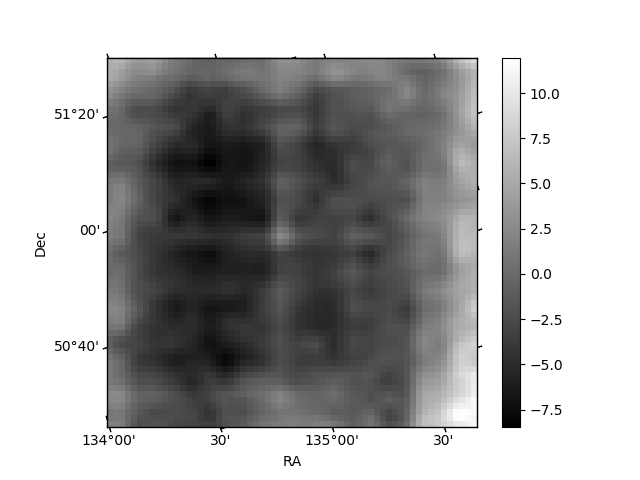
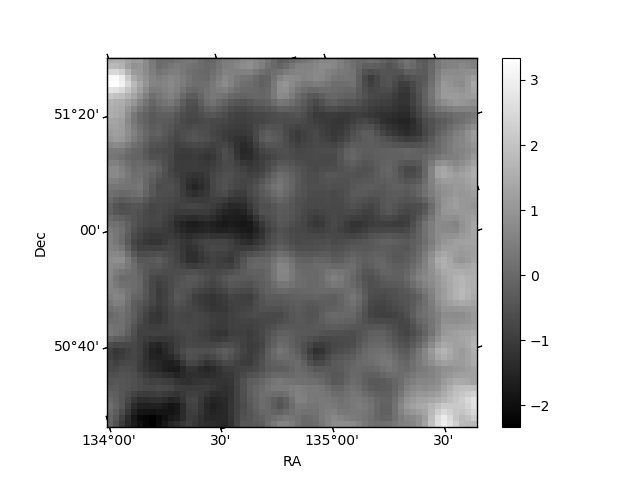
Histogram calculated using DETX and DETY for each event in the final _common_clean file
| Quadrant A | 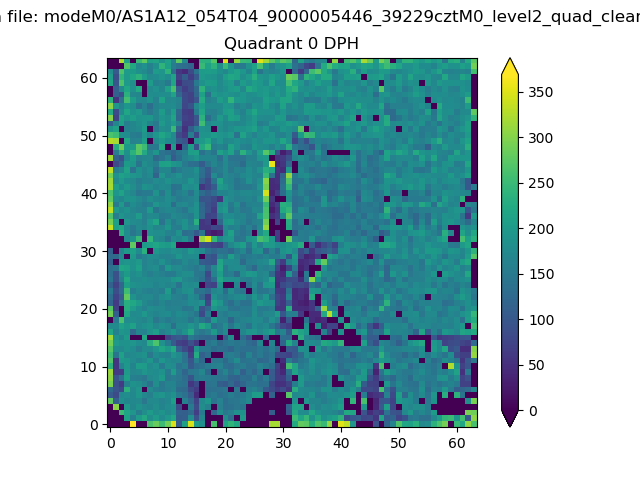 |
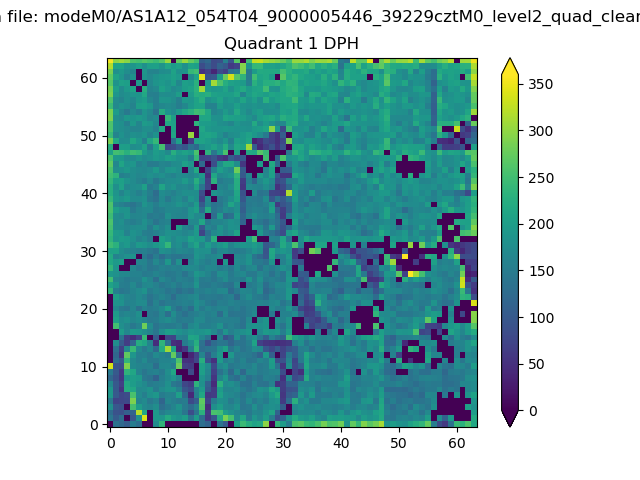 |
Quadrant B |
|---|---|---|---|
| Quadrant D | 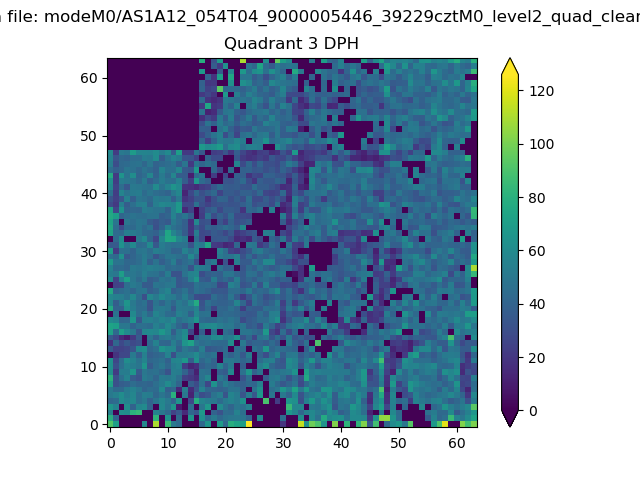 |
 |
Quadrant C |
| Plot type | Count rate plots | Images |
|---|---|---|
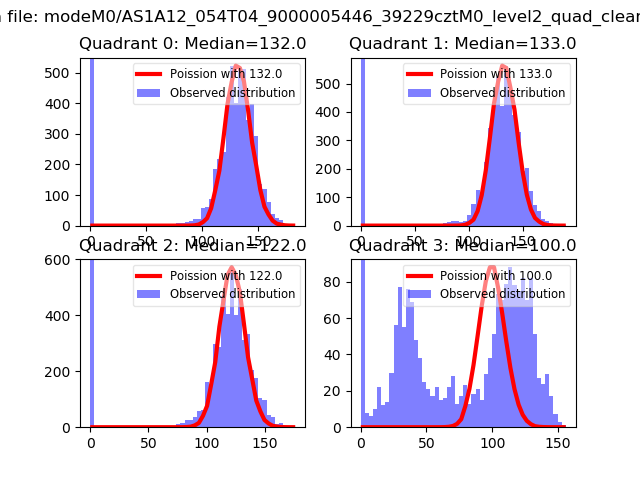
| Comparison with Poisson distribution Blue bars denote a histogram of data divided into 1 sec bins. Red curve is a Poisson curve with rate = median count rate of data. |
 |
 |
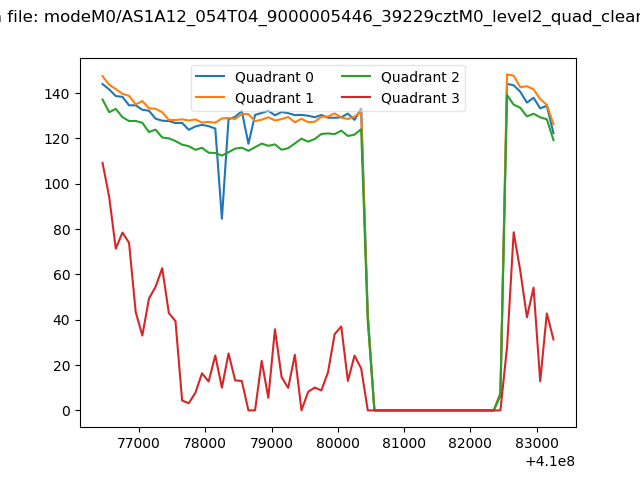
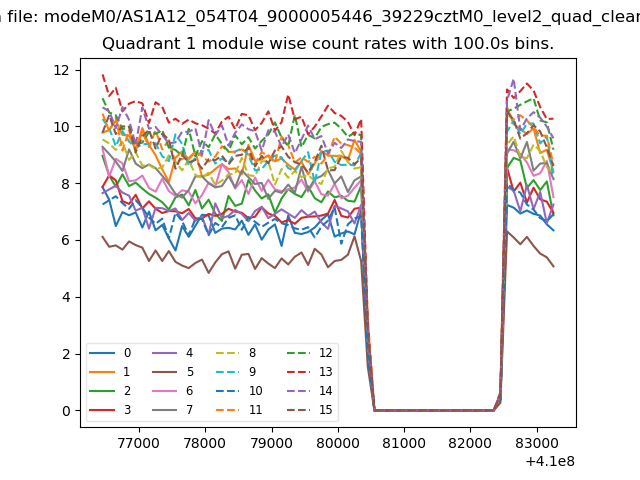
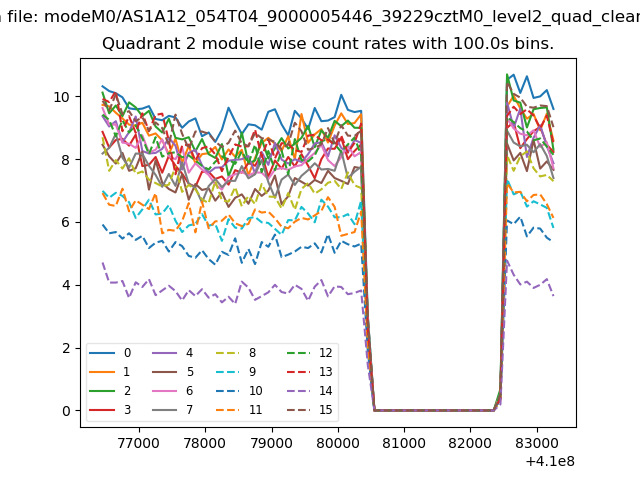
| Quadrant-wise count rates Data is divided into 100 sec bins |
 |
|
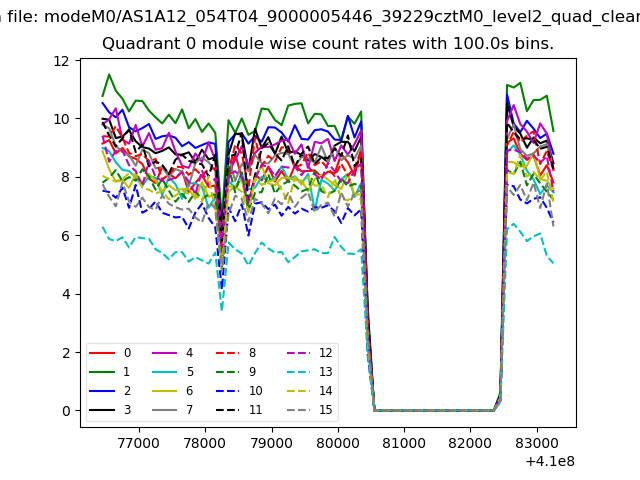
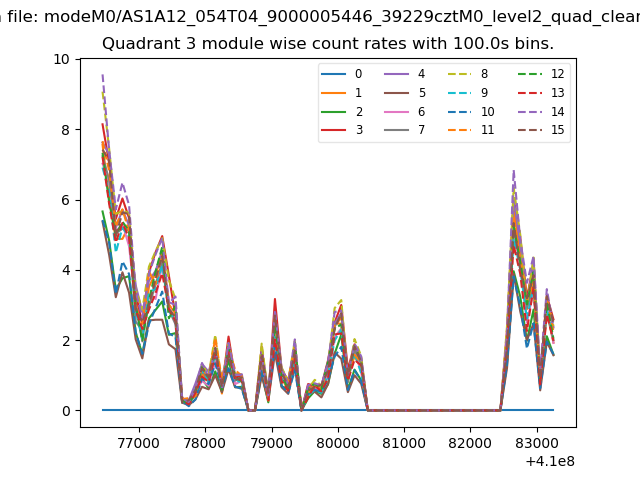
| Module-wise count rates for Quadrant A Data is divided into 100 sec bins |
 |
 |
| Module-wise count rates for Quadrant B Data is divided into 100 sec bins |
 |
 |
| Module-wise count rates for Quadrant C Data is divided into 100 sec bins |
 |
 |
| Module-wise count rates for Quadrant D Data is divided into 100 sec bins |
 |
 |
| Parameter | Plot |
|---|---|
| CZT HV Monitor | 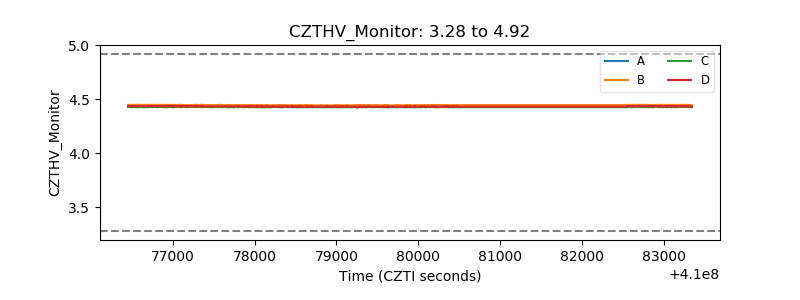 |
| D_VDD | 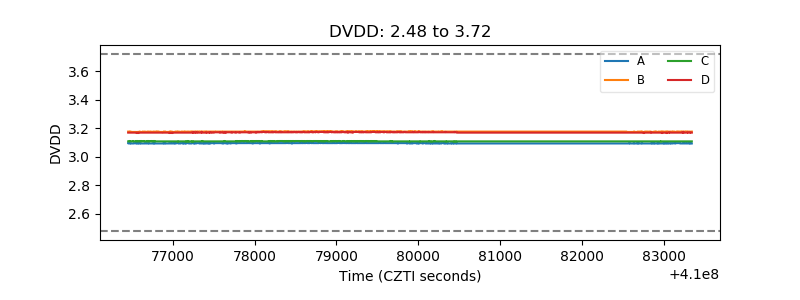 |
| Temperature 1 | 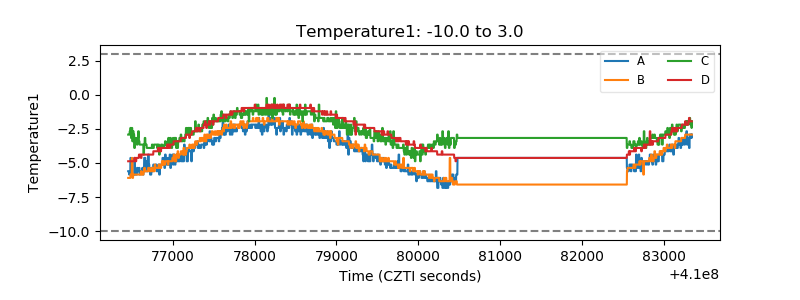 |
| Veto HV Monitor | 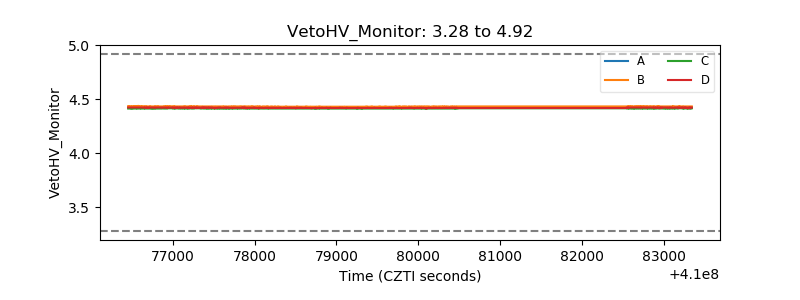 |
| Veto LLD | 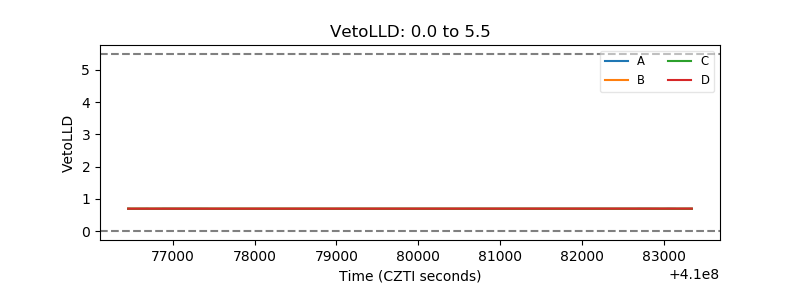 |
| Alpha Counter | 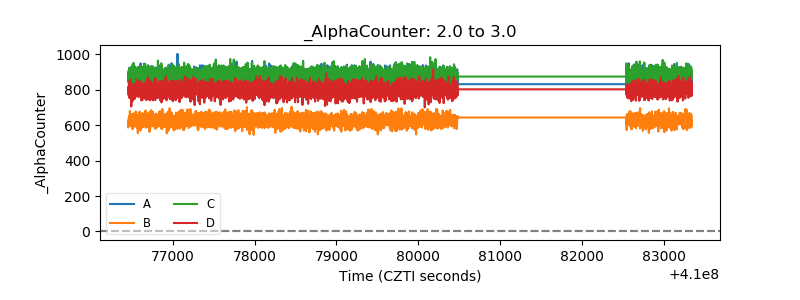 |
| _CPM_Rate | 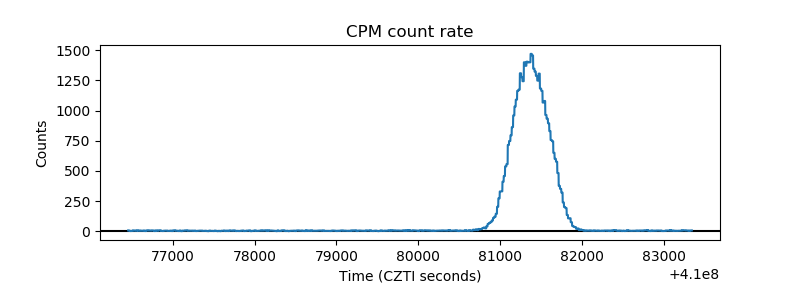 |
| CZT Counter | 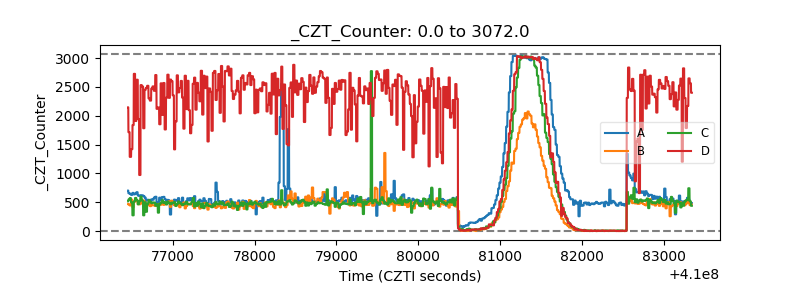 |
| +2.5 Volts monitor | 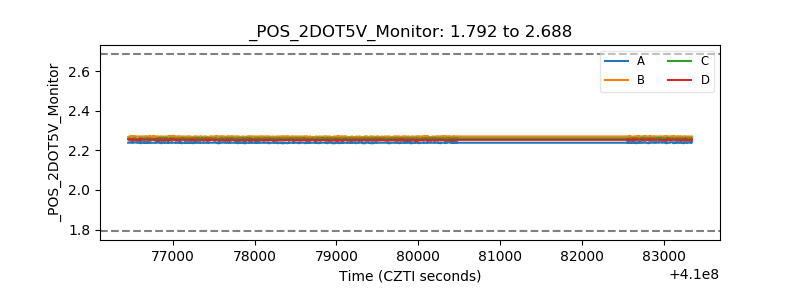 |
| +5 Volts monitor | 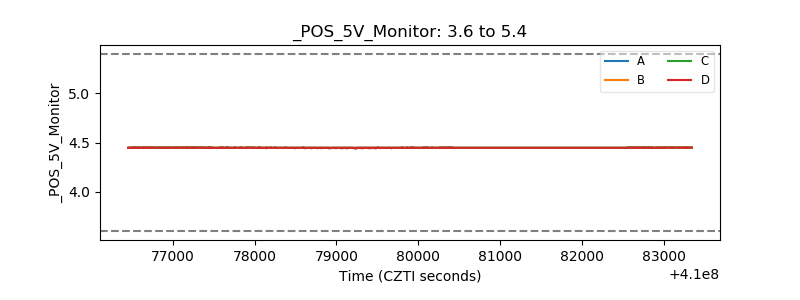 |
| _ROLL_ROT | 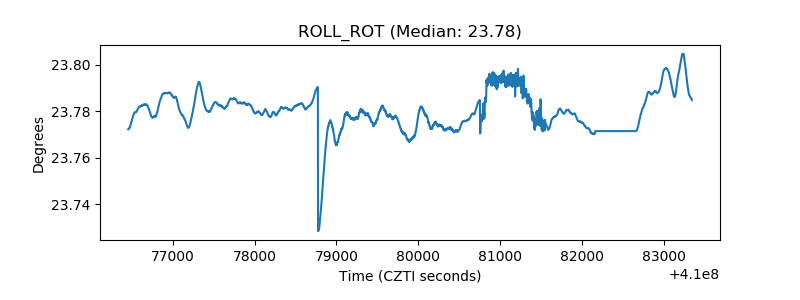 |
| _Roll_DEC | 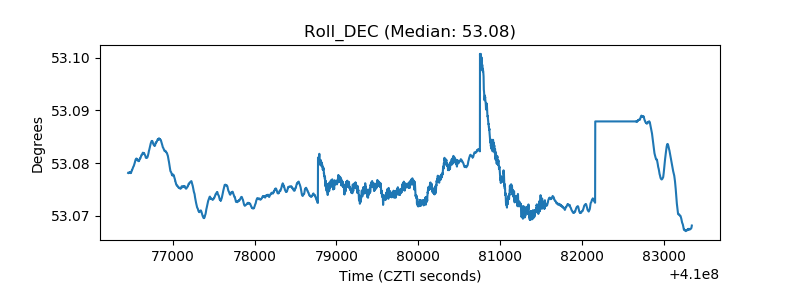 |
| _Roll_RA | 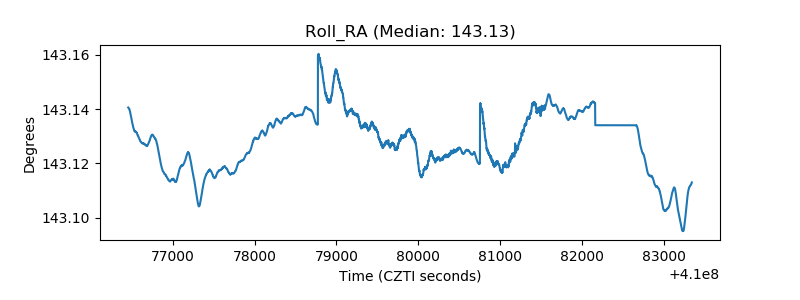 |
| Veto Counter | 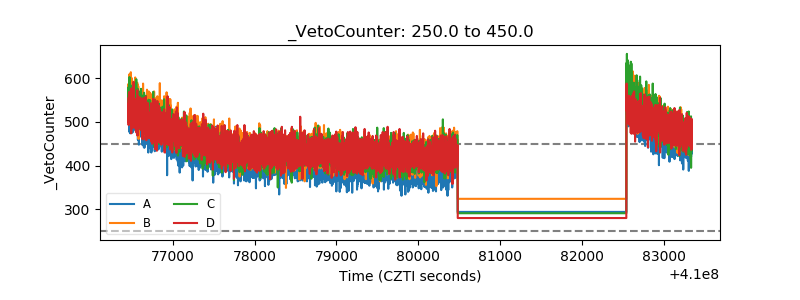 |