| Param | Original file | Final file |
|---|---|---|
| Filename | modeM0/AS1A12_054T04_9000005446_39230cztM0_level2.fits | modeM0/AS1A12_054T04_9000005446_39230cztM0_level2_quad_clean.evt |
| Size (bytes) | 514,494,720 | 74,594,880 |
| Size | 490.7 MB | 71.1 MB |
| Events in quadrant A | 2,826,333 | 612,333 |
| Events in quadrant B | 2,349,683 | 621,911 |
| Events in quadrant C | 2,362,575 | 574,486 |
| Events in quadrant D | 11,134,254 | 115,363 |
| Mode M9 | |||
|---|---|---|---|
| Quadrant | BADHDUFLAG | Total packets | Discarded packets |
| A | 0 | 22 | 0 |
| B | 0 | 22 | 0 |
| C | 0 | 22 | 0 |
| D | 0 | 22 | 0 |
| Mode M0 | |||
|---|---|---|---|
| Quadrant | BADHDUFLAG | Total packets | Discarded packets |
| A | 0 | 11087 | 2 |
| B | 0 | 9913 | 1 |
| C | 0 | 9663 | 1 |
| D | 0 | 36321 | 1 |
| Mode SS | |||
|---|---|---|---|
| Quadrant | BADHDUFLAG | Total packets | Discarded packets |
| A | 0 | 96 | 0 |
| B | 0 | 96 | 0 |
| C | 0 | 96 | 0 |
| D | 0 | 96 | 0 |
| Quadrant | Total seconds | Saturated seconds | Saturation percentage |
|---|---|---|---|
| A | 4770 | 82 | 1.719078% |
| B | 4770 | 20 | 0.419287% |
| C | 4770 | 4 | 0.083857% |
| D | 4770 | 4042 | 84.737945% |
Noise dominated data is calculated using 1-second bins in cleaned event files. If a bin has >2000 counts, and if more than 50% of those come from <1% of pixels, then it is considered to be noise-dominated and hence unusable.
| Quadrant | # 1 sec bins | Bins with >0 counts | Bins with >2000 counts | High rate bins dominated by noise | Noise dominated (total time) | Noise dominated (detector-on time) | Marked lightcurve |
|---|---|---|---|---|---|---|---|
| A | 6893 | 4771 | 52 | 52 | 0.75% | 1.09% | 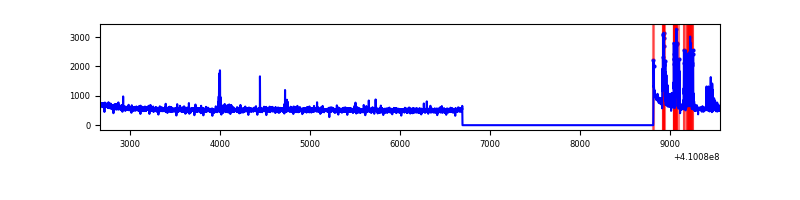 |
| B | 6893 | 4771 | 12 | 12 | 0.17% | 0.25% | 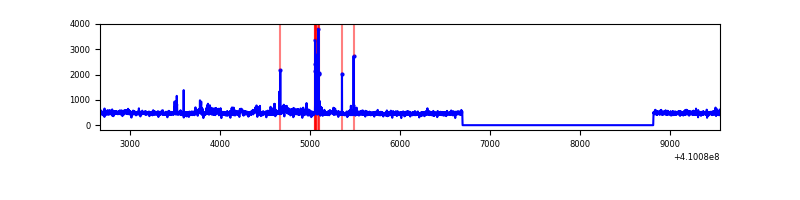 |
| C | 6893 | 4771 | 0 | 0 | 0.00% | 0.00% | 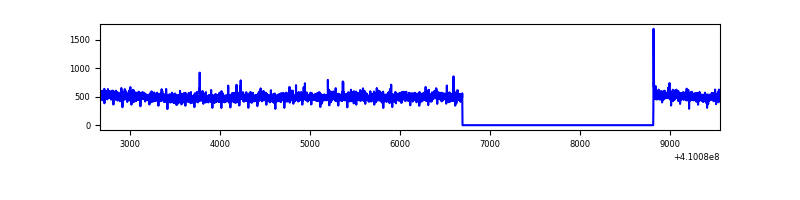 |
| D | 6893 | 4766 | 3024 | 3024 | 43.87% | 63.45% | 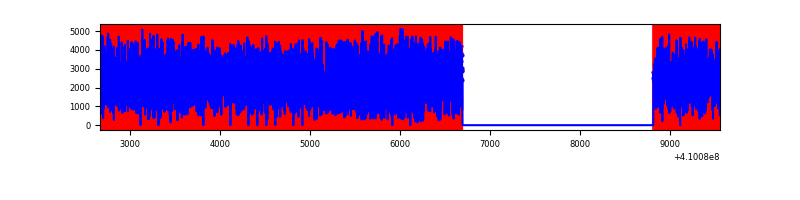 |
Top three noisy pixels from each quadrant. If the there are fewer than three noisy pixels in the level2.evt file, extra rows are filled as -1
| Pixel properties | Quadrant properties | ||||||
|---|---|---|---|---|---|---|---|
| Quadrant | DetID | PixID | Counts | Sigma | Mean | Median | Sigma |
| A | 10 | 83 | 359018 | 3113.78 | 571 | 561 | 115.1 |
| A | 13 | 248 | 262401 | 2274.51 | 571 | 561 | 115.1 |
| A | 13 | 254 | 9081 | 74.01 | 571 | 561 | 115.1 |
| B | 5 | 172 | 87758 | 816.74 | 560 | 545 | 106.8 |
| B | 5 | 255 | 47369 | 438.5 | 560 | 545 | 106.8 |
| B | 0 | 190 | 19139 | 174.13 | 560 | 545 | 106.8 |
| C | 15 | 214 | 201712 | 1607.6 | 543 | 546 | 125.1 |
| C | 0 | 239 | 23880 | 186.47 | 543 | 546 | 125.1 |
| C | 9 | 187 | 5109 | 36.46 | 543 | 546 | 125.1 |
| D | 12 | 235 | 9346698 | 122698.57 | 310 | 301 | 76.2 |
| D | 2 | 250 | 238180 | 3122.85 | 310 | 301 | 76.2 |
| D | 1 | 47 | 125538 | 1644.09 | 310 | 301 | 76.2 |
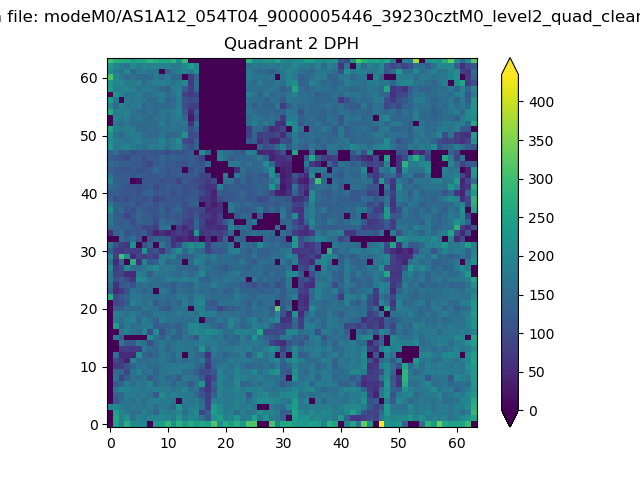
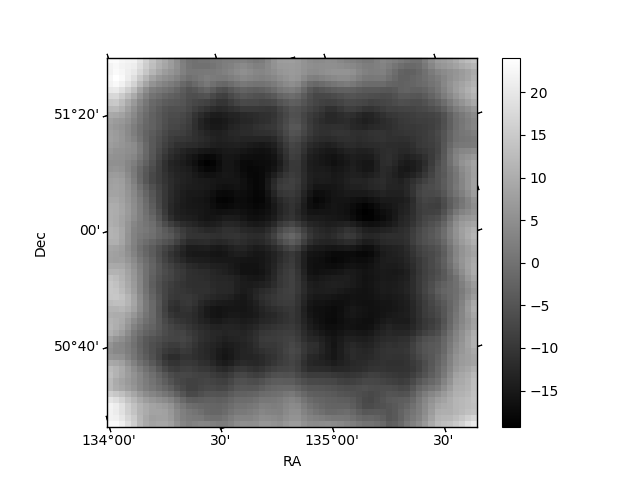
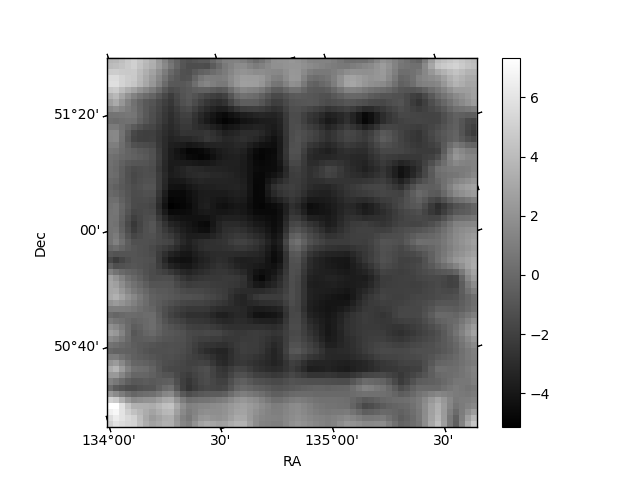
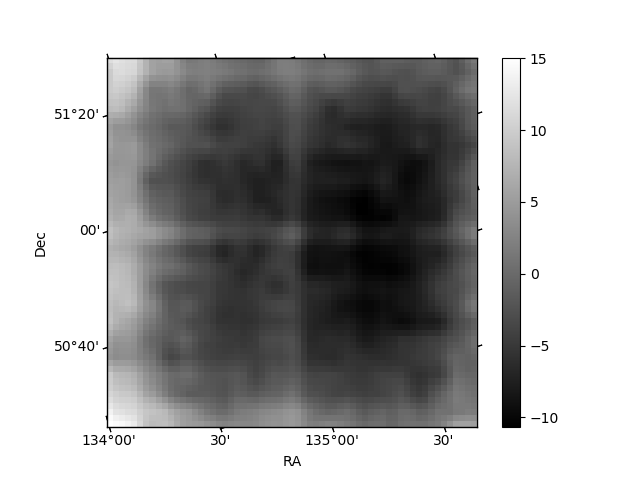
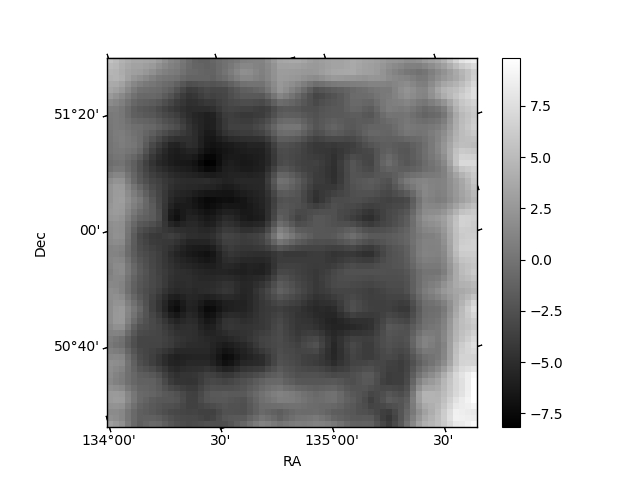
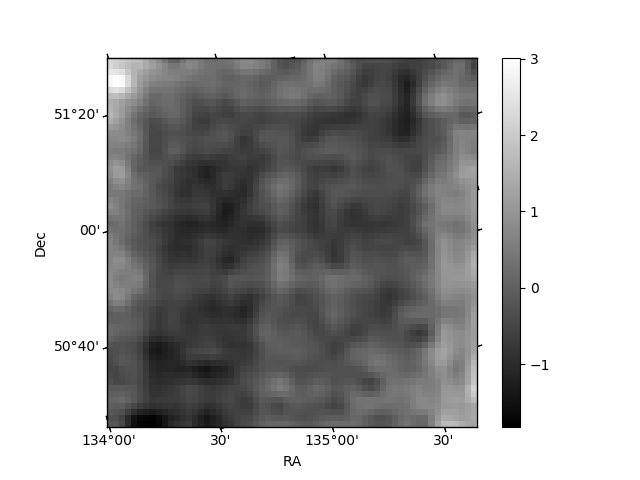
Histogram calculated using DETX and DETY for each event in the final _common_clean file
| Quadrant A | 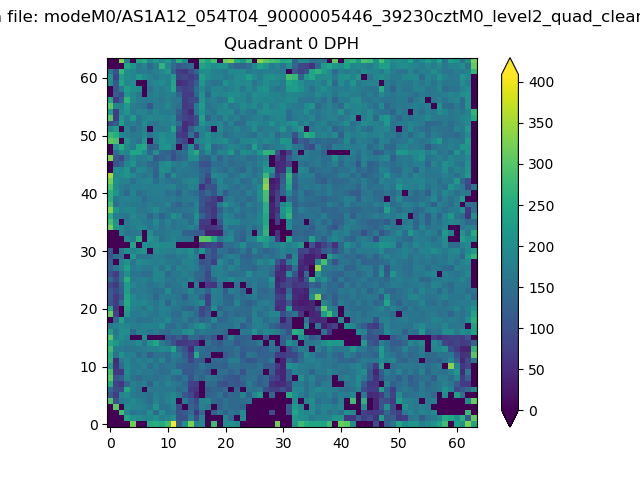 |
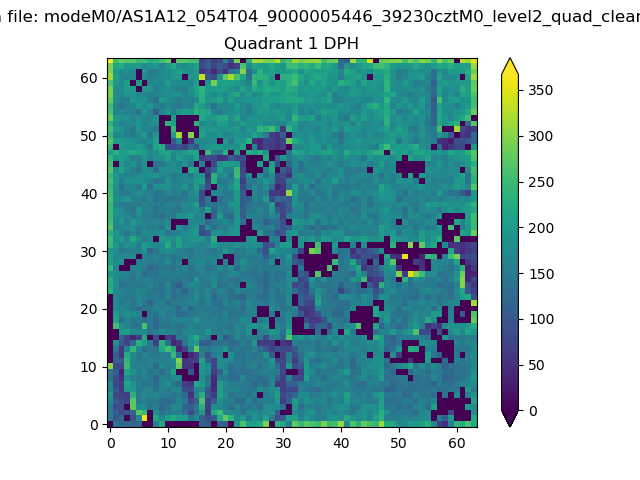 |
Quadrant B |
|---|---|---|---|
| Quadrant D | 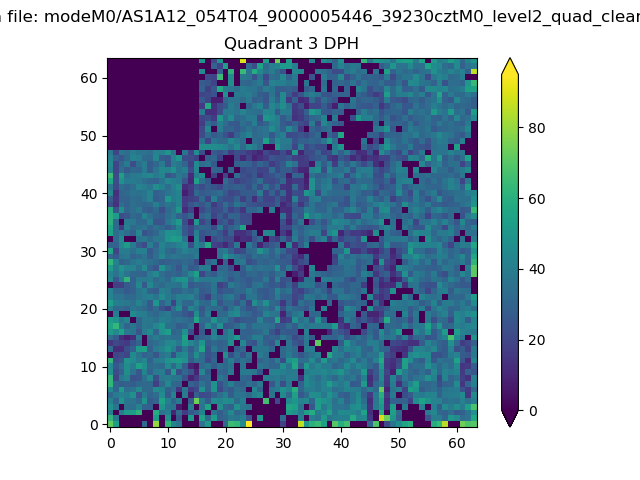 |
 |
Quadrant C |
| Plot type | Count rate plots | Images |
|---|---|---|
| Comparison with Poisson distribution Blue bars denote a histogram of data divided into 1 sec bins. Red curve is a Poisson curve with rate = median count rate of data. |
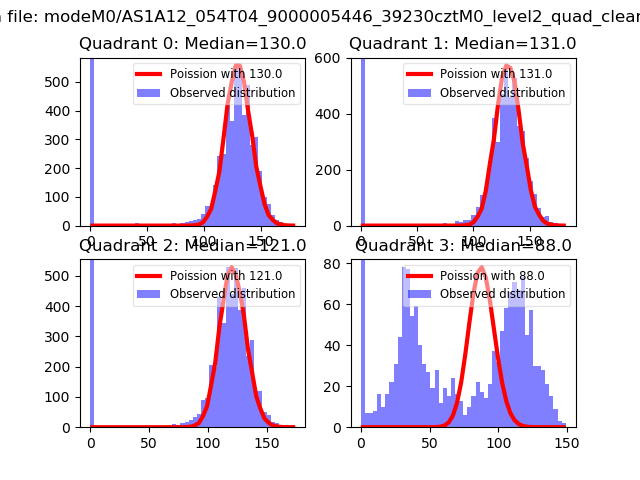 |
 |
| Quadrant-wise count rates Data is divided into 100 sec bins |
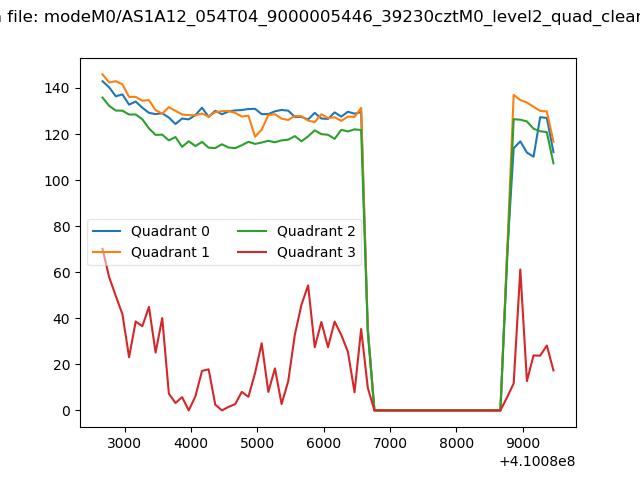 |
|
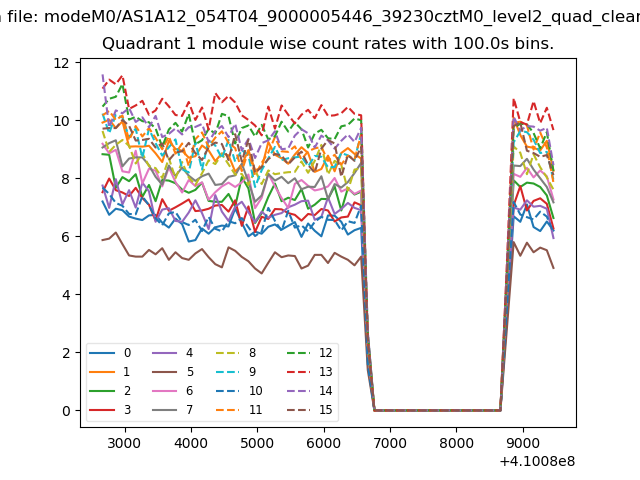
| Module-wise count rates for Quadrant A Data is divided into 100 sec bins |
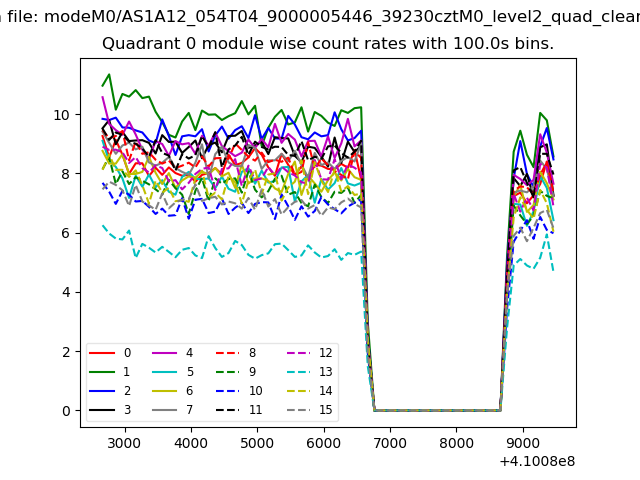 |
 |
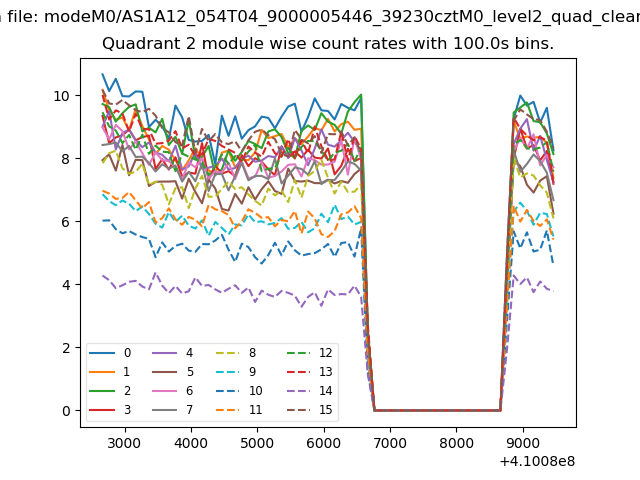
| Module-wise count rates for Quadrant B Data is divided into 100 sec bins |
 |
 |
| Module-wise count rates for Quadrant C Data is divided into 100 sec bins |
 |
 |
| Module-wise count rates for Quadrant D Data is divided into 100 sec bins |
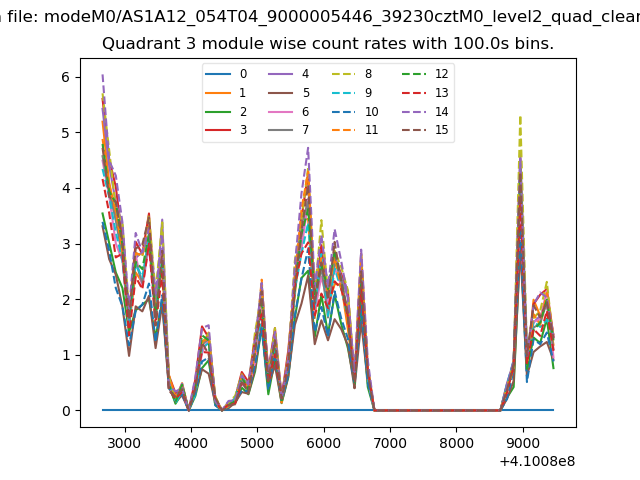 |
 |
| Parameter | Plot |
|---|---|
| CZT HV Monitor | 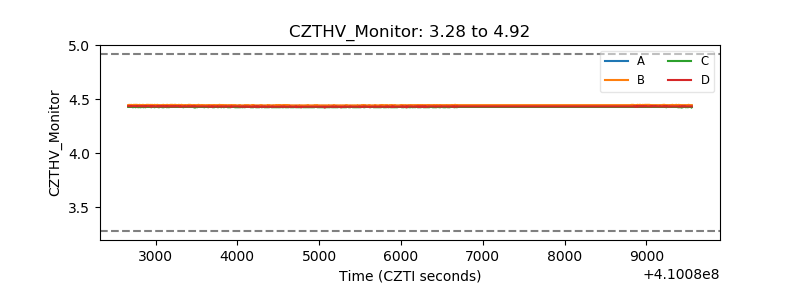 |
| D_VDD | 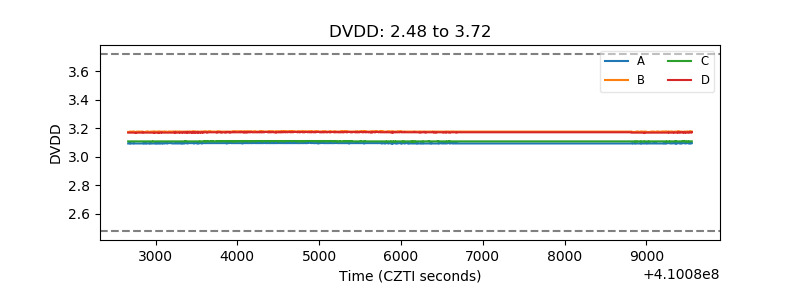 |
| Temperature 1 | 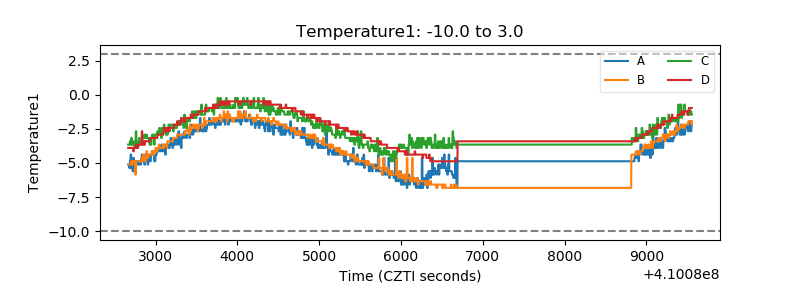 |
| Veto HV Monitor | 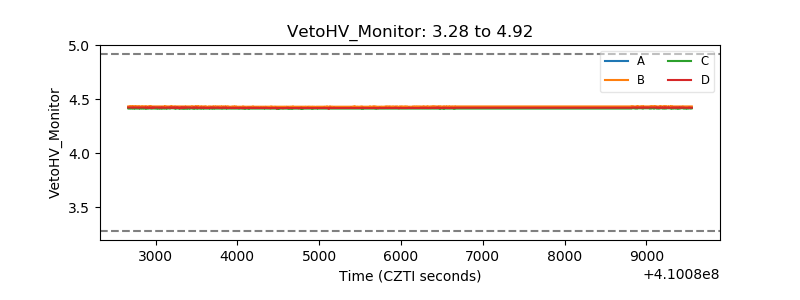 |
| Veto LLD | 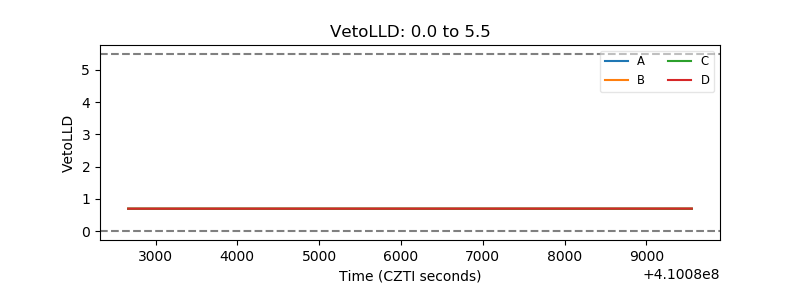 |
| Alpha Counter | 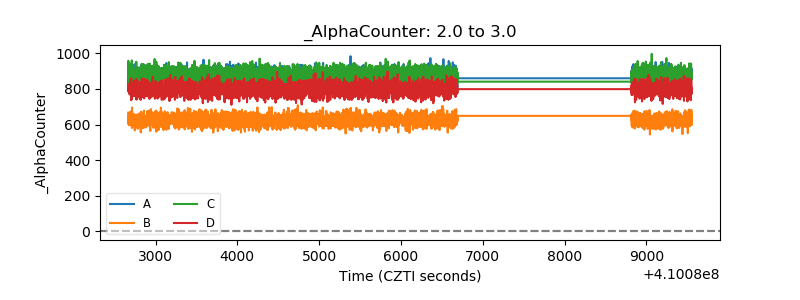 |
| _CPM_Rate | 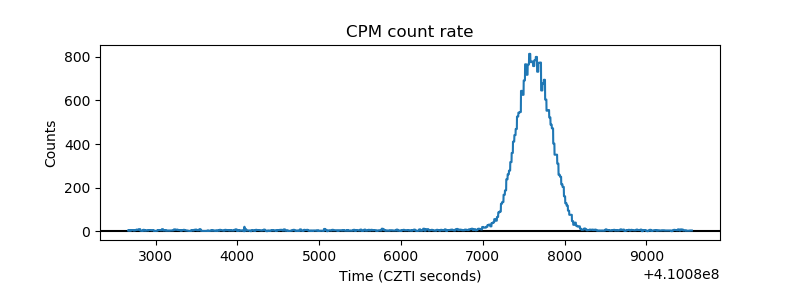 |
| CZT Counter | 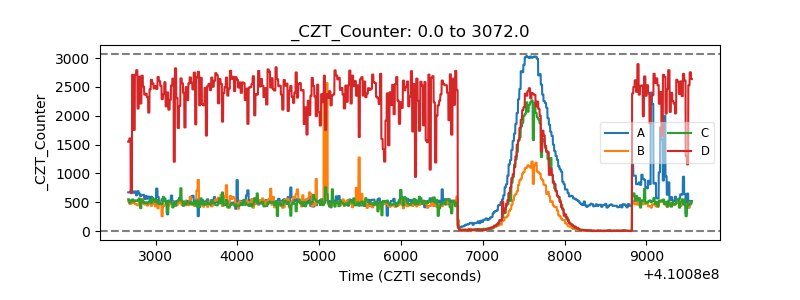 |
| +2.5 Volts monitor | 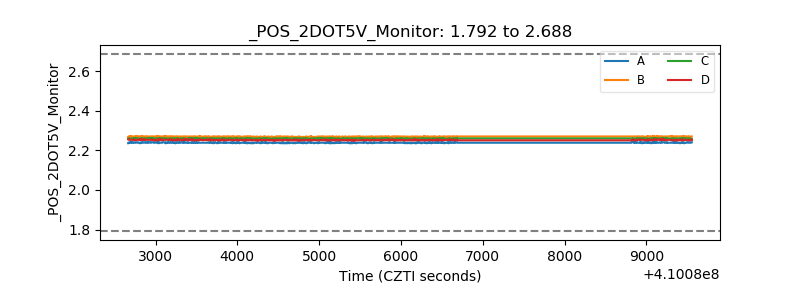 |
| +5 Volts monitor |  |
| _ROLL_ROT | 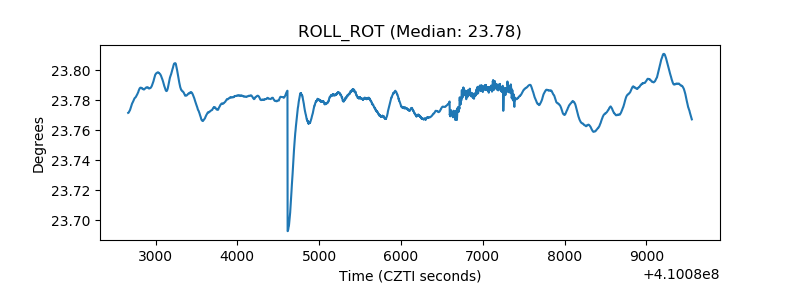 |
| _Roll_DEC | 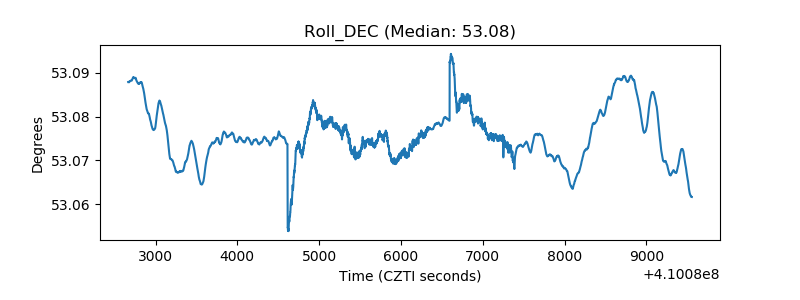 |
| _Roll_RA | 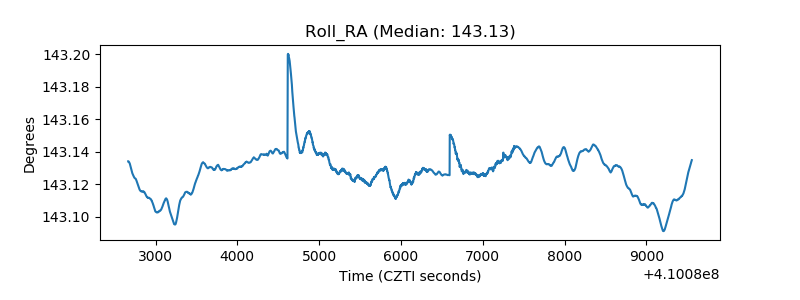 |
| Veto Counter | 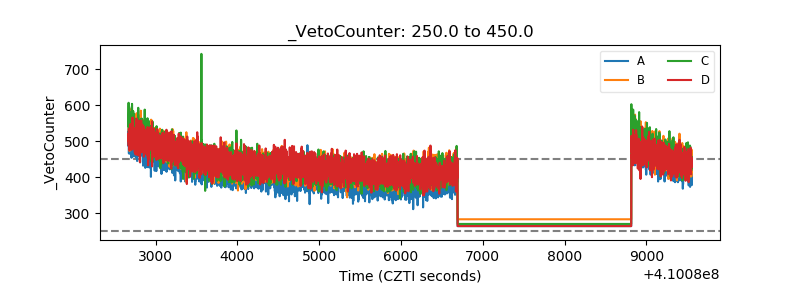 |