| Param | Original file | Final file |
|---|---|---|
| Filename | modeM0/AS1A12_054T04_9000005446_39232cztM0_level2.fits | modeM0/AS1A12_054T04_9000005446_39232cztM0_level2_quad_clean.evt |
| Size (bytes) | 606,363,840 | 74,620,800 |
| Size | 578.3 MB | 71.2 MB |
| Events in quadrant A | 4,066,534 | 592,637 |
| Events in quadrant B | 2,463,960 | 631,562 |
| Events in quadrant C | 2,640,484 | 582,859 |
| Events in quadrant D | 12,861,890 | 81,125 |
| Mode M9 | |||
|---|---|---|---|
| Quadrant | BADHDUFLAG | Total packets | Discarded packets |
| A | 0 | 21 | 0 |
| B | 0 | 21 | 0 |
| C | 0 | 21 | 0 |
| D | 0 | 22 | 0 |
| Mode M0 | |||
|---|---|---|---|
| Quadrant | BADHDUFLAG | Total packets | Discarded packets |
| A | 0 | 15357 | 3 |
| B | 0 | 10882 | 2 |
| C | 0 | 11034 | 2 |
| D | 0 | 41789 | 2 |
| Mode SS | |||
|---|---|---|---|
| Quadrant | BADHDUFLAG | Total packets | Discarded packets |
| A | 0 | 108 | 0 |
| B | 0 | 108 | 0 |
| C | 0 | 108 | 0 |
| D | 0 | 108 | 0 |
| Quadrant | Total seconds | Saturated seconds | Saturation percentage |
|---|---|---|---|
| A | 5299 | 425 | 8.020381% |
| B | 5299 | 8 | 0.150972% |
| C | 5299 | 10 | 0.188715% |
| D | 5299 | 4754 | 89.715041% |
Noise dominated data is calculated using 1-second bins in cleaned event files. If a bin has >2000 counts, and if more than 50% of those come from <1% of pixels, then it is considered to be noise-dominated and hence unusable.
| Quadrant | # 1 sec bins | Bins with >0 counts | Bins with >2000 counts | High rate bins dominated by noise | Noise dominated (total time) | Noise dominated (detector-on time) | Marked lightcurve |
|---|---|---|---|---|---|---|---|
| A | 7243 | 5301 | 285 | 285 | 3.93% | 5.38% | 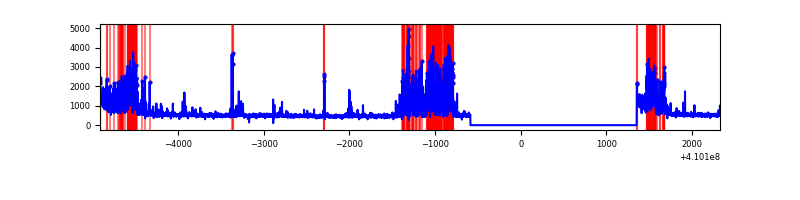 |
| B | 7243 | 5301 | 1 | 1 | 0.01% | 0.02% | 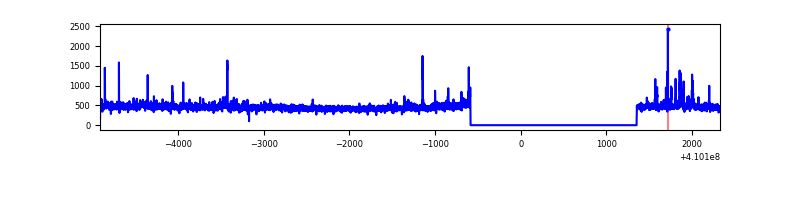 |
| C | 7243 | 5301 | 7 | 7 | 0.10% | 0.13% | 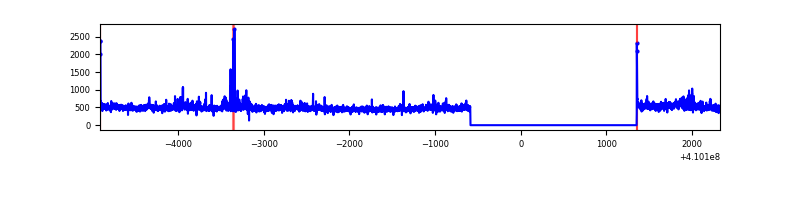 |
| D | 7242 | 5298 | 3676 | 3676 | 50.76% | 69.38% | 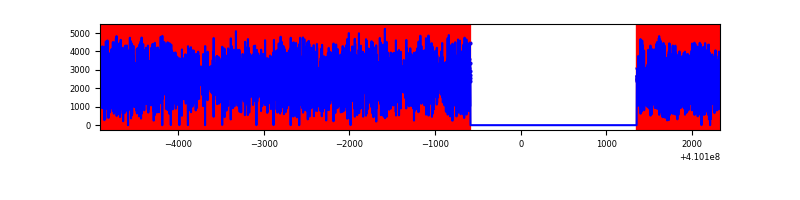 |
Top three noisy pixels from each quadrant. If the there are fewer than three noisy pixels in the level2.evt file, extra rows are filled as -1
| Pixel properties | Quadrant properties | ||||||
|---|---|---|---|---|---|---|---|
| Quadrant | DetID | PixID | Counts | Sigma | Mean | Median | Sigma |
| A | 13 | 248 | 1378929 | 11580.01 | 582 | 571 | 119.0 |
| A | 10 | 83 | 436291 | 3660.62 | 582 | 571 | 119.0 |
| A | 13 | 254 | 8093 | 63.19 | 582 | 571 | 119.0 |
| B | 0 | 190 | 68301 | 597.09 | 589 | 574 | 113.4 |
| B | 5 | 172 | 60694 | 530.03 | 589 | 574 | 113.4 |
| B | 0 | 230 | 15296 | 129.79 | 589 | 574 | 113.4 |
| C | 15 | 214 | 224107 | 1666.91 | 574 | 578 | 134.1 |
| C | 0 | 239 | 93415 | 692.31 | 574 | 578 | 134.1 |
| C | 3 | 233 | 48743 | 359.18 | 574 | 578 | 134.1 |
| D | 12 | 235 | 11043009 | 153111.26 | 294 | 286 | 72.1 |
| D | 2 | 249 | 229853 | 3183.03 | 294 | 286 | 72.1 |
| D | 12 | 227 | 173492 | 2401.56 | 294 | 286 | 72.1 |
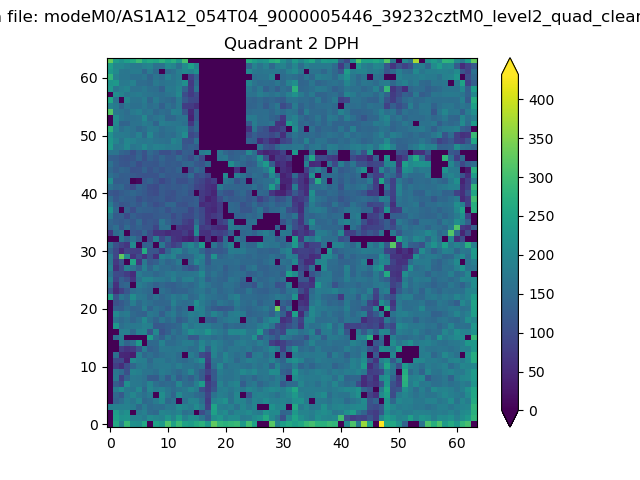
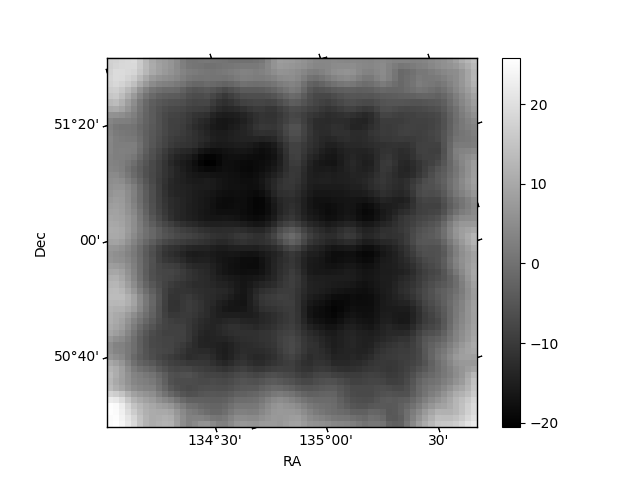
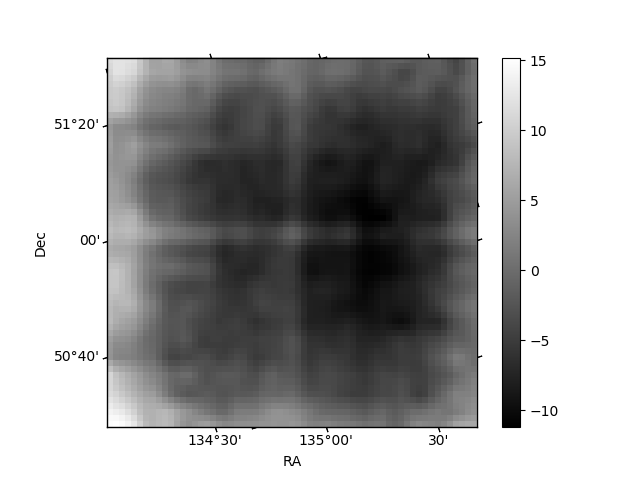
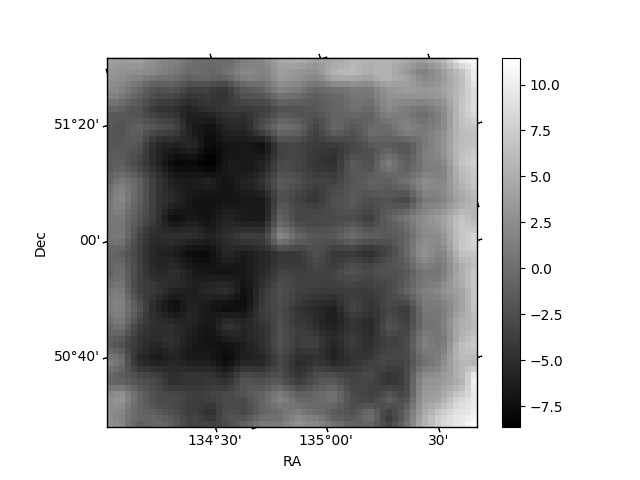
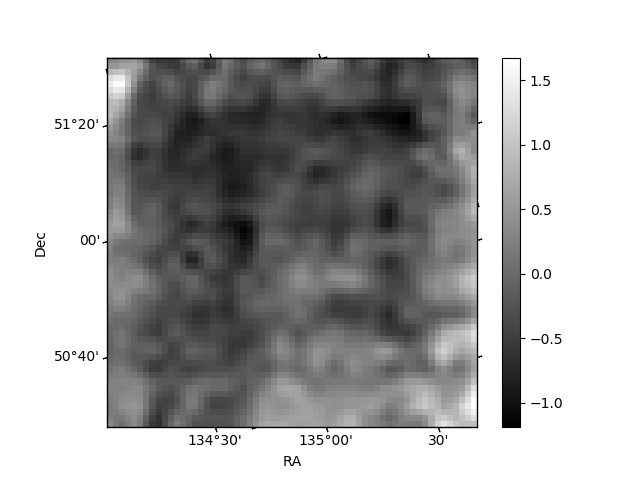
Histogram calculated using DETX and DETY for each event in the final _common_clean file
| Quadrant A | 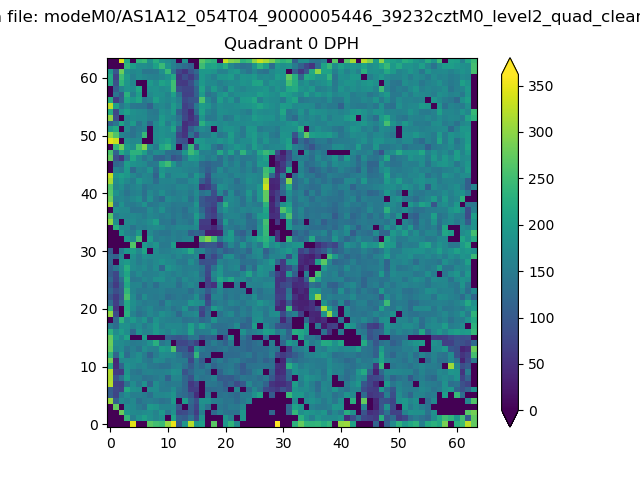 |
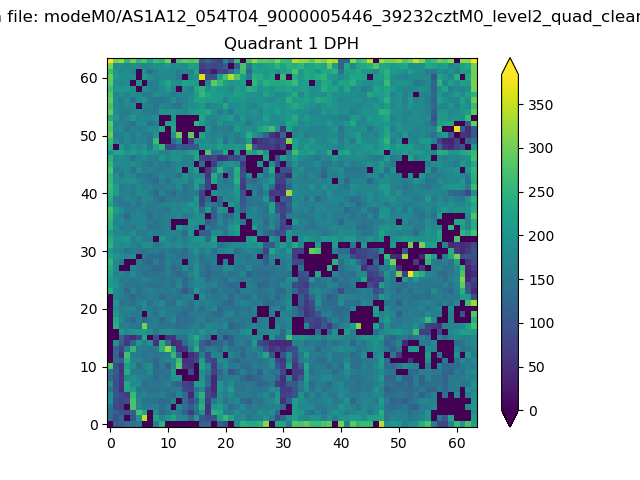 |
Quadrant B |
|---|---|---|---|
| Quadrant D | 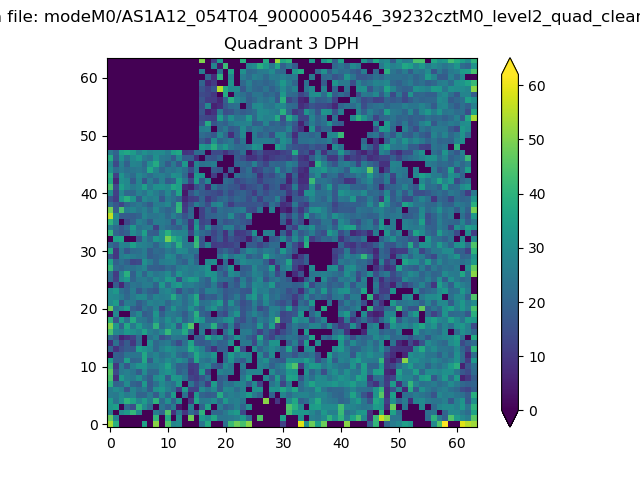 |
 |
Quadrant C |
| Plot type | Count rate plots | Images |
|---|---|---|
| Comparison with Poisson distribution Blue bars denote a histogram of data divided into 1 sec bins. Red curve is a Poisson curve with rate = median count rate of data. |
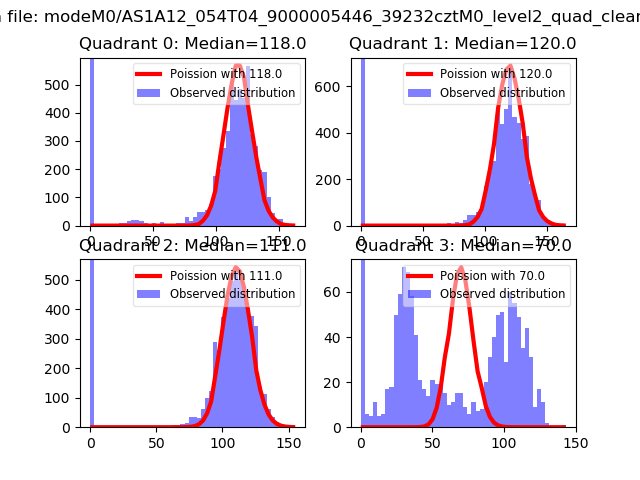 |
 |
| Quadrant-wise count rates Data is divided into 100 sec bins |
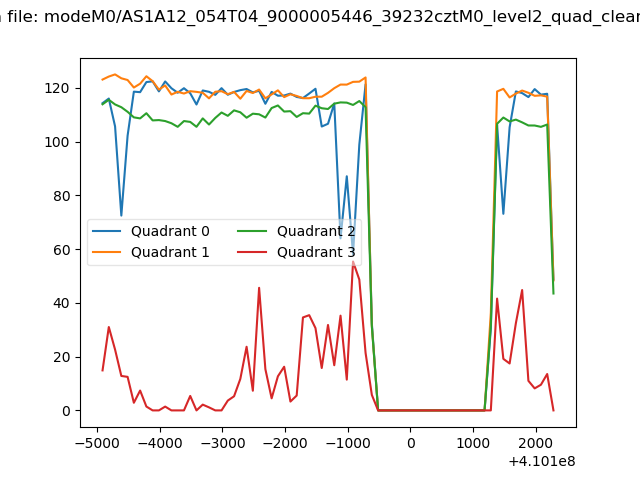 |
|
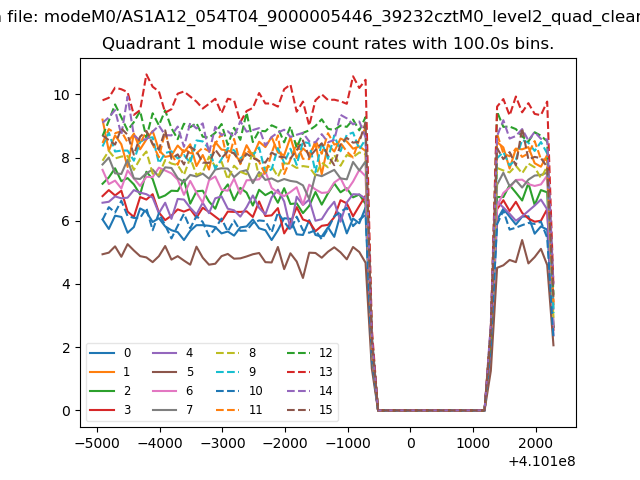
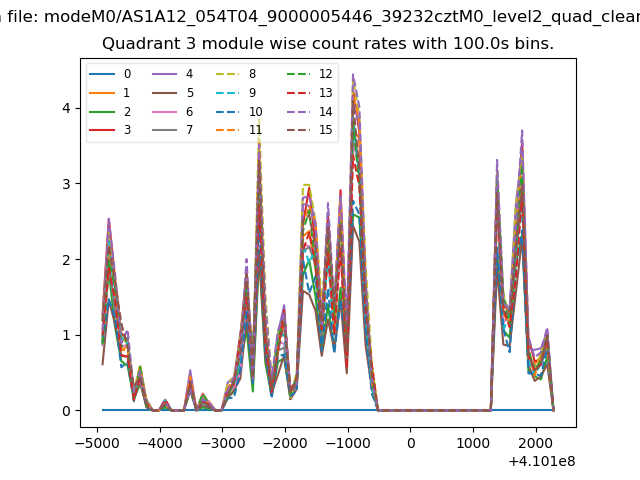
| Module-wise count rates for Quadrant A Data is divided into 100 sec bins |
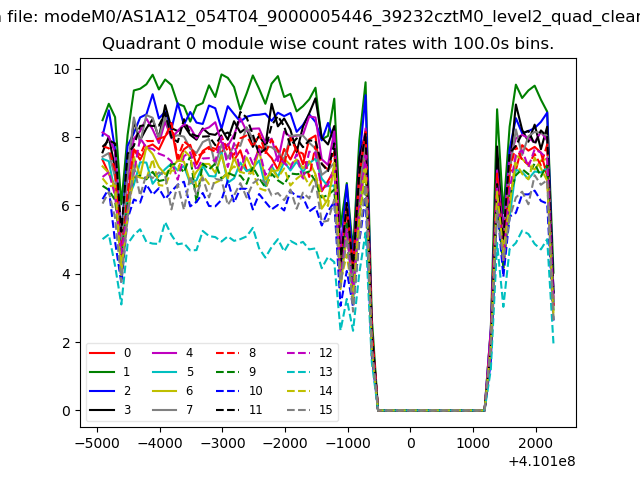 |
 |
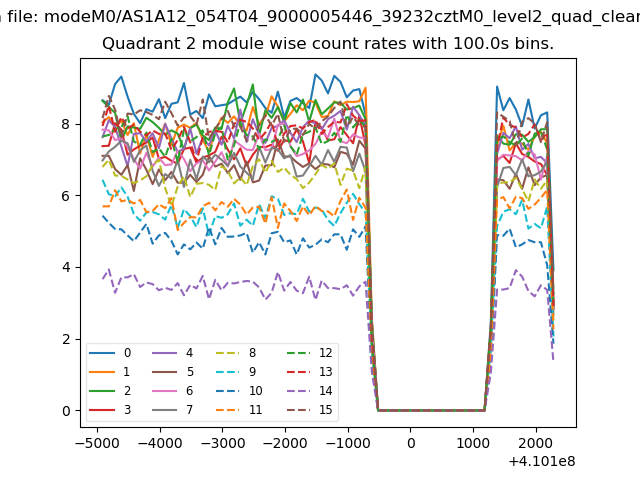
| Module-wise count rates for Quadrant B Data is divided into 100 sec bins |
 |
 |
| Module-wise count rates for Quadrant C Data is divided into 100 sec bins |
 |
 |
| Module-wise count rates for Quadrant D Data is divided into 100 sec bins |
 |
 |
| Parameter | Plot |
|---|---|
| CZT HV Monitor | 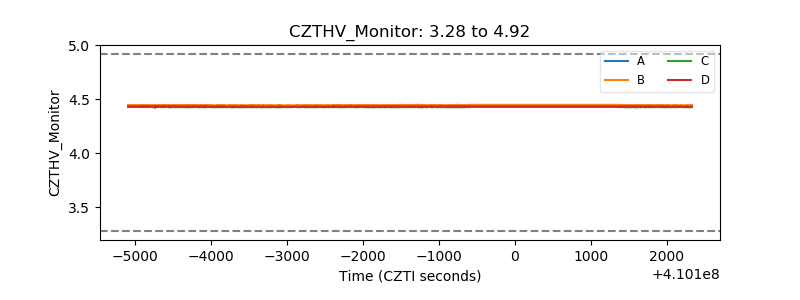 |
| D_VDD | 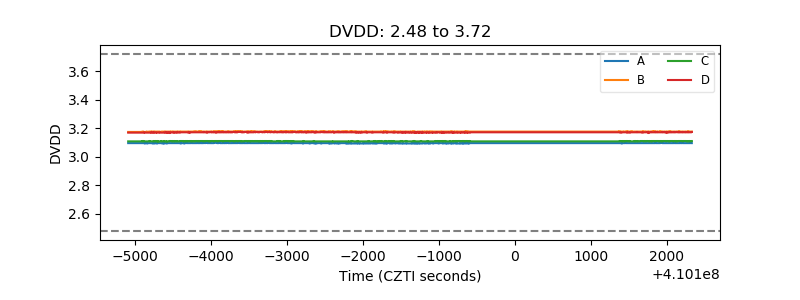 |
| Temperature 1 | 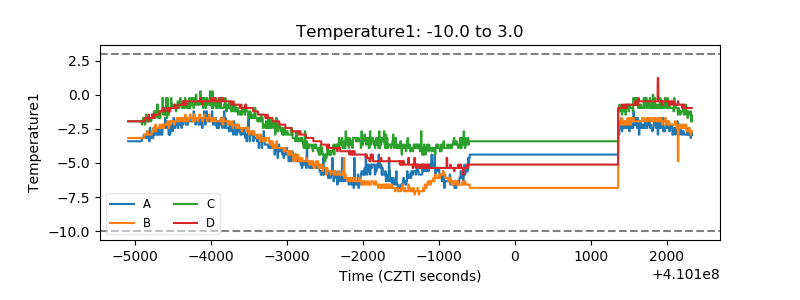 |
| Veto HV Monitor | 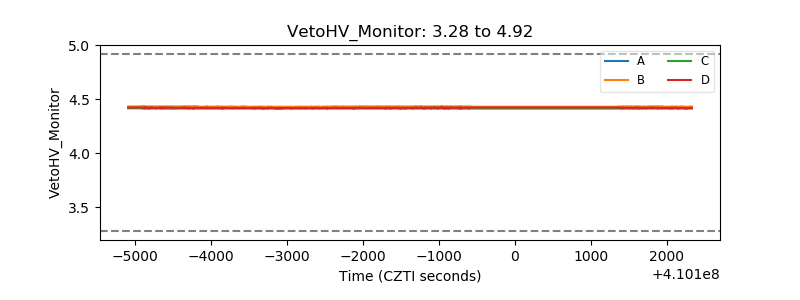 |
| Veto LLD | 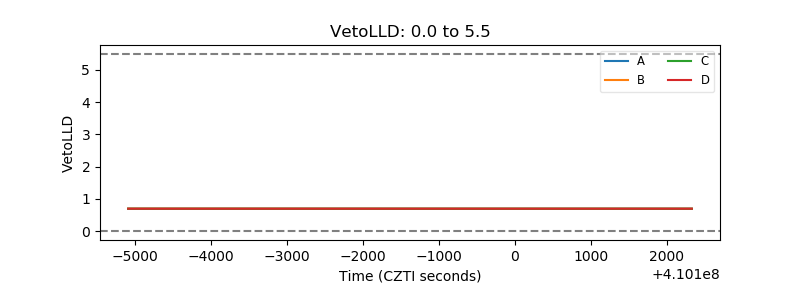 |
| Alpha Counter | 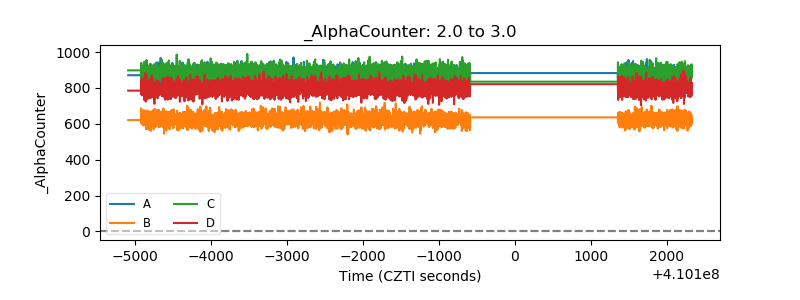 |
| _CPM_Rate | 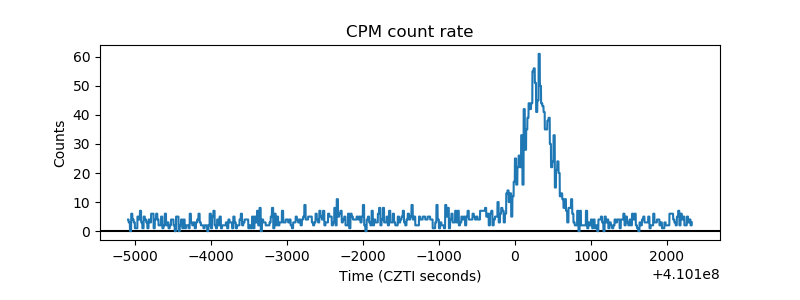 |
| CZT Counter | 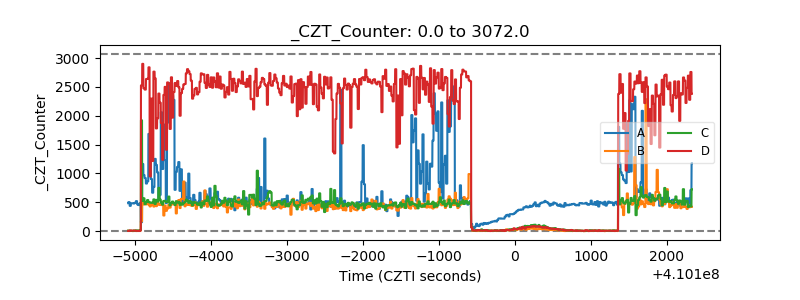 |
| +2.5 Volts monitor | 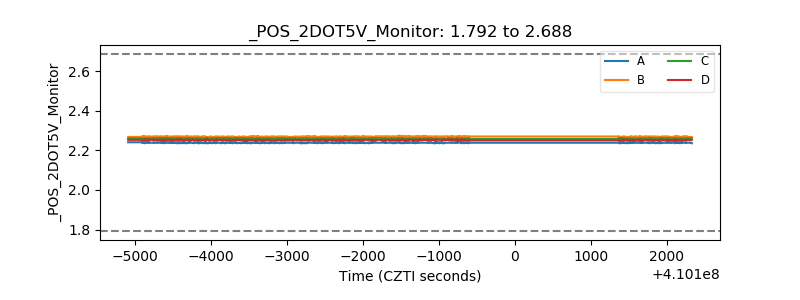 |
| +5 Volts monitor | 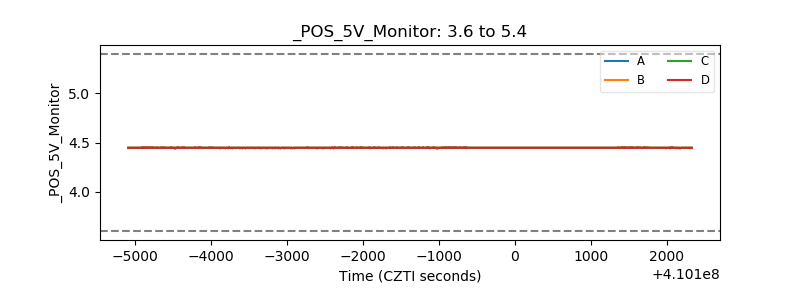 |
| _ROLL_ROT | 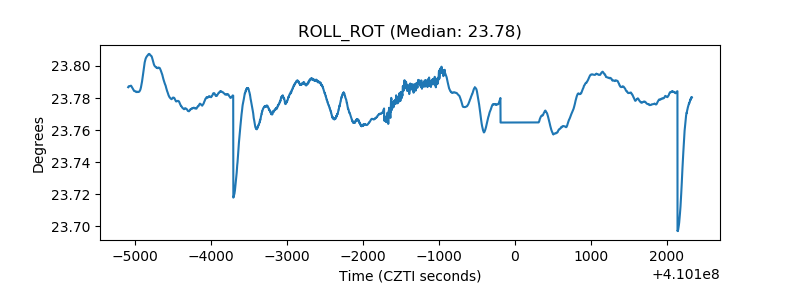 |
| _Roll_DEC | 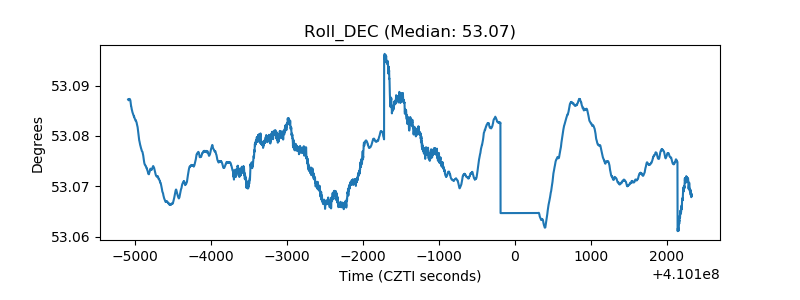 |
| _Roll_RA | 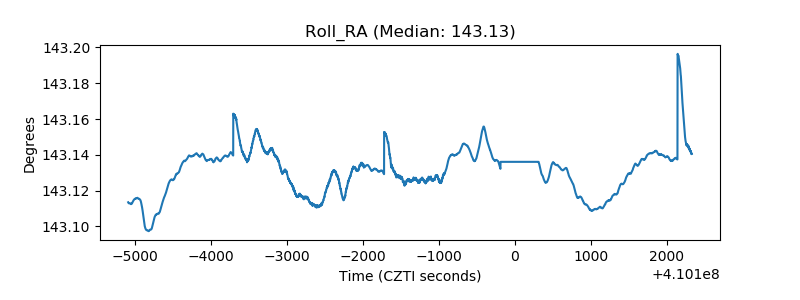 |
| Veto Counter | 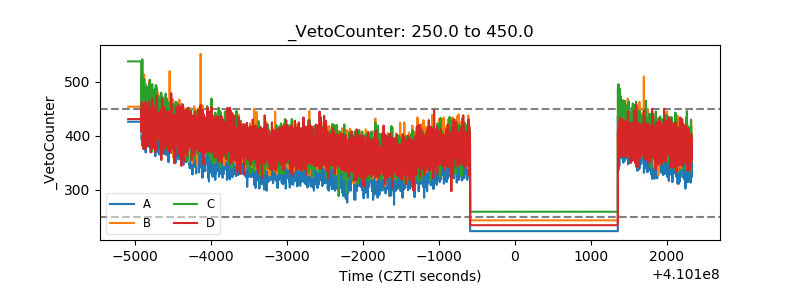 |