| Param | Original file | Final file |
|---|---|---|
| Filename | modeM0/AS1A12_054T04_9000005446_39233cztM0_level2.fits | modeM0/AS1A12_054T04_9000005446_39233cztM0_level2_quad_clean.evt |
| Size (bytes) | 623,105,280 | 86,077,440 |
| Size | 594.2 MB | 82.1 MB |
| Events in quadrant A | 3,503,078 | 729,184 |
| Events in quadrant B | 2,732,889 | 686,360 |
| Events in quadrant C | 3,176,528 | 671,251 |
| Events in quadrant D | 13,222,716 | 133,227 |
| Mode M9 | |||
|---|---|---|---|
| Quadrant | BADHDUFLAG | Total packets | Discarded packets |
| A | 0 | 27 | 0 |
| B | 0 | 27 | 0 |
| C | 0 | 27 | 0 |
| D | 0 | 28 | 0 |
| Mode M0 | |||
|---|---|---|---|
| Quadrant | BADHDUFLAG | Total packets | Discarded packets |
| A | 0 | 13901 | 3 |
| B | 0 | 11944 | 2 |
| C | 0 | 12961 | 2 |
| D | 0 | 43068 | 2 |
| Mode SS | |||
|---|---|---|---|
| Quadrant | BADHDUFLAG | Total packets | Discarded packets |
| A | 0 | 110 | 0 |
| B | 0 | 110 | 0 |
| C | 0 | 110 | 0 |
| D | 0 | 110 | 0 |
| Quadrant | Total seconds | Saturated seconds | Saturation percentage |
|---|---|---|---|
| A | 5529 | 121 | 2.188461% |
| B | 5529 | 36 | 0.651112% |
| C | 5529 | 16 | 0.289383% |
| D | 5529 | 4805 | 86.905408% |
Noise dominated data is calculated using 1-second bins in cleaned event files. If a bin has >2000 counts, and if more than 50% of those come from <1% of pixels, then it is considered to be noise-dominated and hence unusable.
| Quadrant | # 1 sec bins | Bins with >0 counts | Bins with >2000 counts | High rate bins dominated by noise | Noise dominated (total time) | Noise dominated (detector-on time) | Marked lightcurve |
|---|---|---|---|---|---|---|---|
| A | 7142 | 5530 | 83 | 83 | 1.16% | 1.50% | 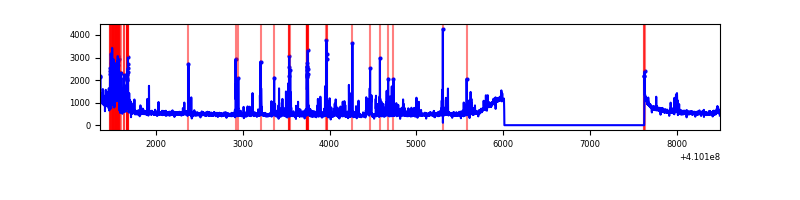 |
| B | 7142 | 5530 | 23 | 23 | 0.32% | 0.42% | 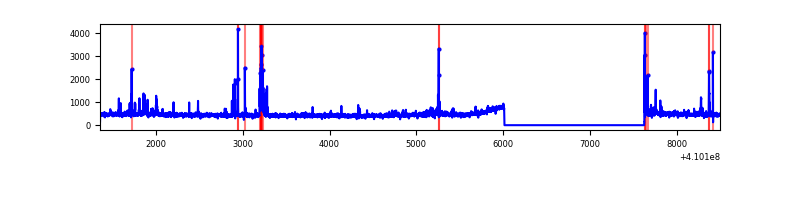 |
| C | 7142 | 5530 | 14 | 14 | 0.20% | 0.25% | 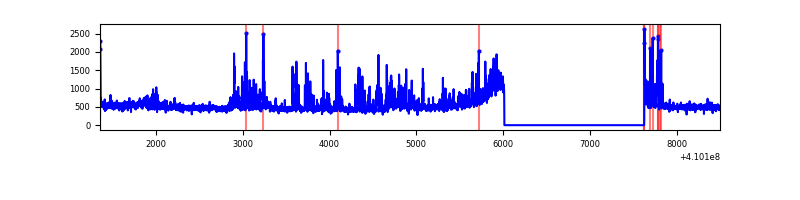 |
| D | 7141 | 5528 | 3642 | 3642 | 51.00% | 65.88% | 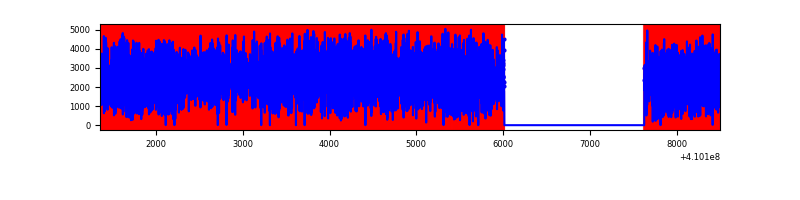 |
Top three noisy pixels from each quadrant. If the there are fewer than three noisy pixels in the level2.evt file, extra rows are filled as -1
| Pixel properties | Quadrant properties | ||||||
|---|---|---|---|---|---|---|---|
| Quadrant | DetID | PixID | Counts | Sigma | Mean | Median | Sigma |
| A | 13 | 248 | 567319 | 4327.8 | 640 | 629 | 130.9 |
| A | 10 | 83 | 454760 | 3468.19 | 640 | 629 | 130.9 |
| A | 13 | 254 | 7522 | 52.64 | 640 | 629 | 130.9 |
| B | 5 | 172 | 175446 | 1450.92 | 619 | 603 | 120.5 |
| B | 5 | 255 | 44597 | 365.08 | 619 | 603 | 120.5 |
| B | 0 | 230 | 32117 | 261.52 | 619 | 603 | 120.5 |
| C | 14 | 254 | 424715 | 2915.75 | 615 | 619 | 145.5 |
| C | 15 | 214 | 233113 | 1598.45 | 615 | 619 | 145.5 |
| C | 3 | 233 | 71217 | 485.38 | 615 | 619 | 145.5 |
| D | 12 | 235 | 10980154 | 123938.4 | 350 | 339 | 88.6 |
| D | 1 | 47 | 208927 | 2354.51 | 350 | 339 | 88.6 |
| D | 12 | 227 | 178768 | 2014.08 | 350 | 339 | 88.6 |
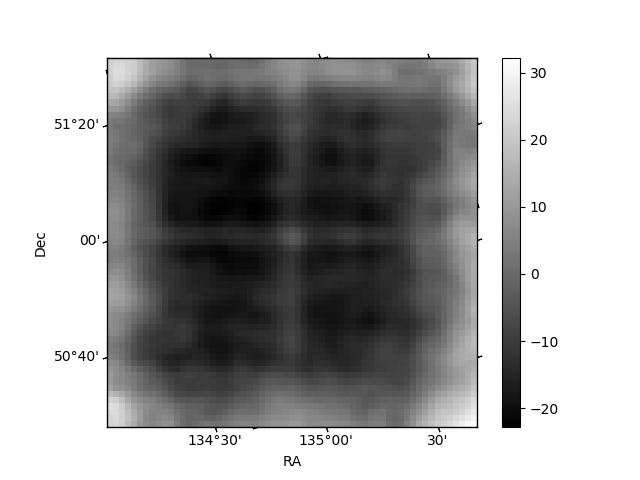
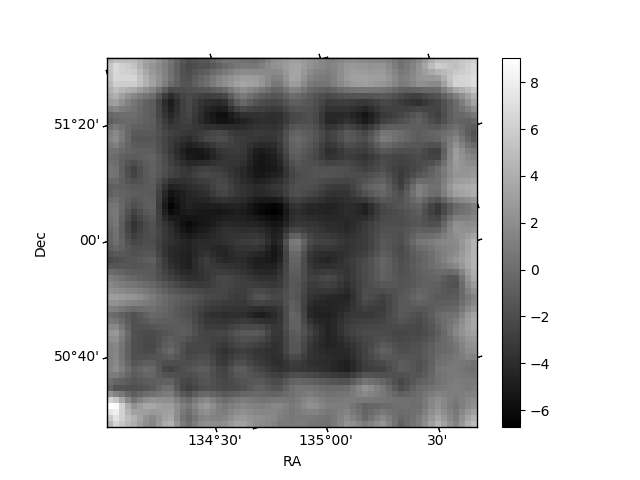
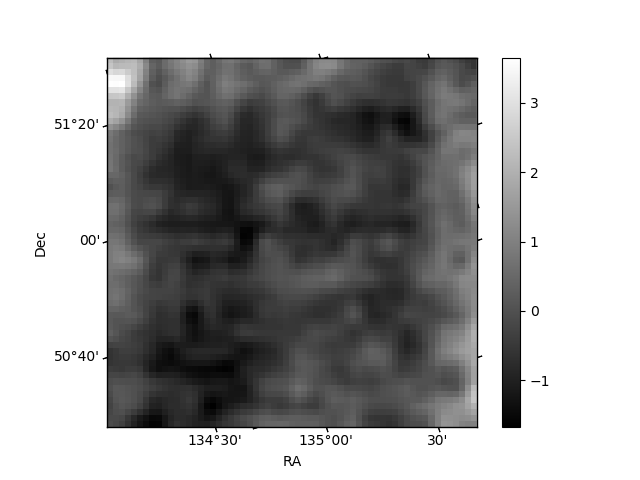
Histogram calculated using DETX and DETY for each event in the final _common_clean file
| Quadrant A | 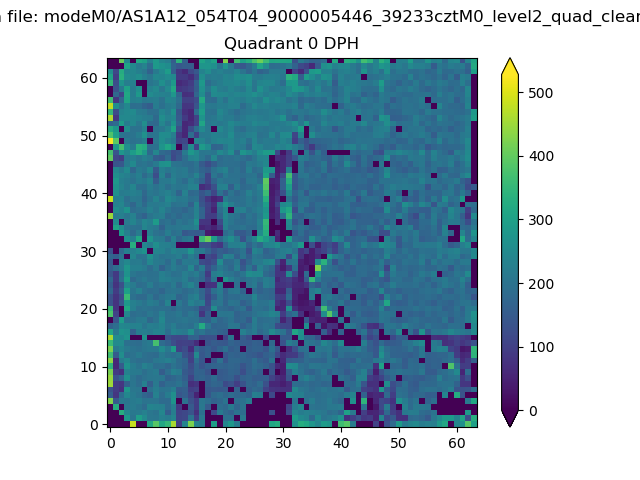 |
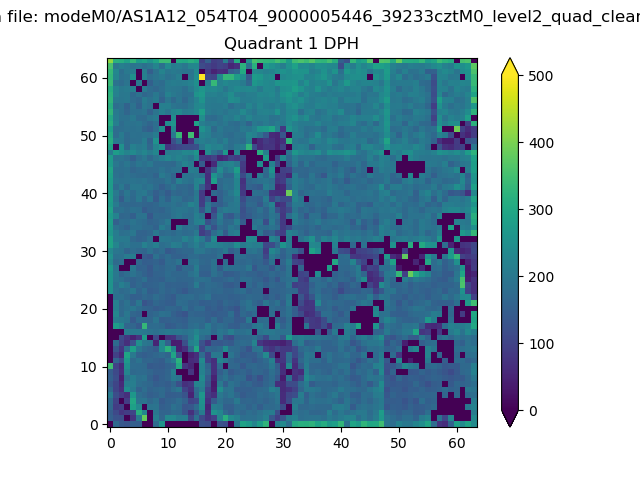 |
Quadrant B |
|---|---|---|---|
| Quadrant D | 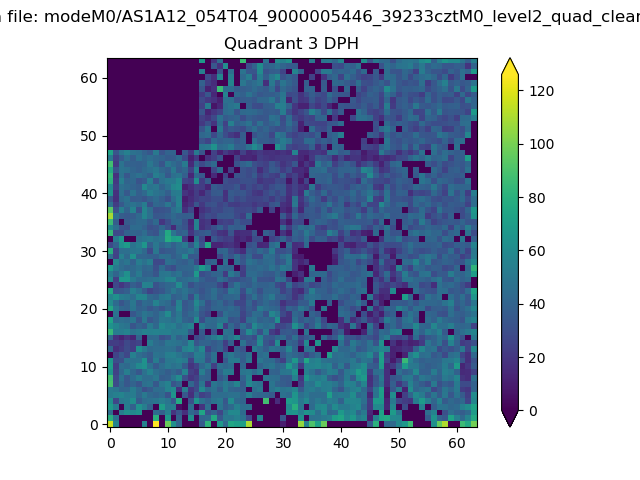 |
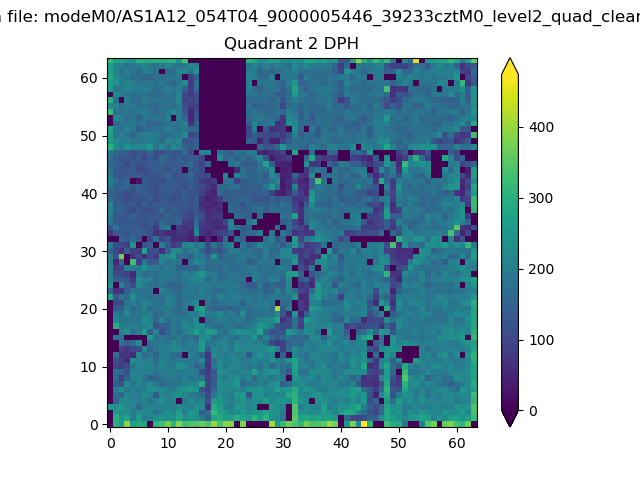 |
Quadrant C |
| Plot type | Count rate plots | Images |
|---|---|---|
| Comparison with Poisson distribution Blue bars denote a histogram of data divided into 1 sec bins. Red curve is a Poisson curve with rate = median count rate of data. |
 |
 |
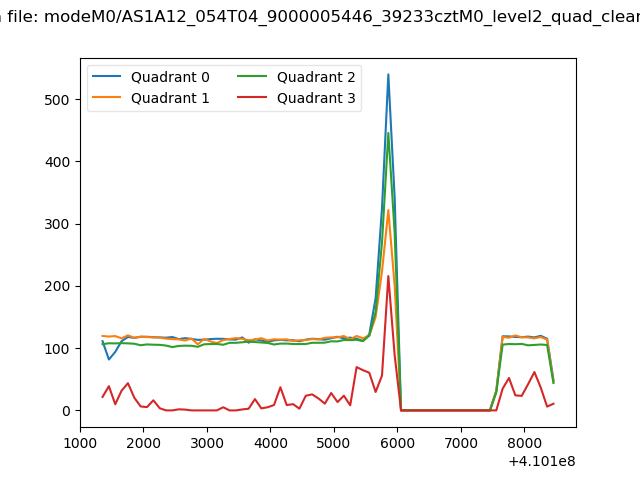
| Quadrant-wise count rates Data is divided into 100 sec bins |
 |
|
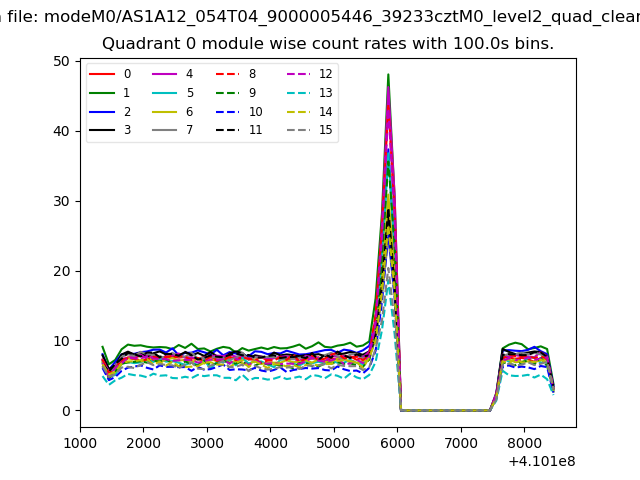
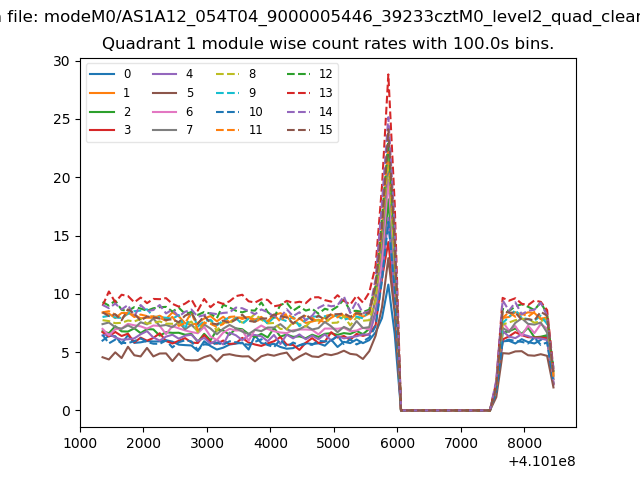
| Module-wise count rates for Quadrant A Data is divided into 100 sec bins |
 |
 |
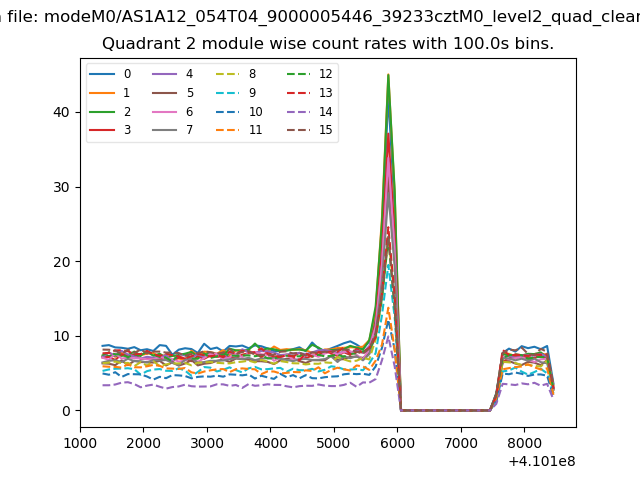
| Module-wise count rates for Quadrant B Data is divided into 100 sec bins |
 |
 |
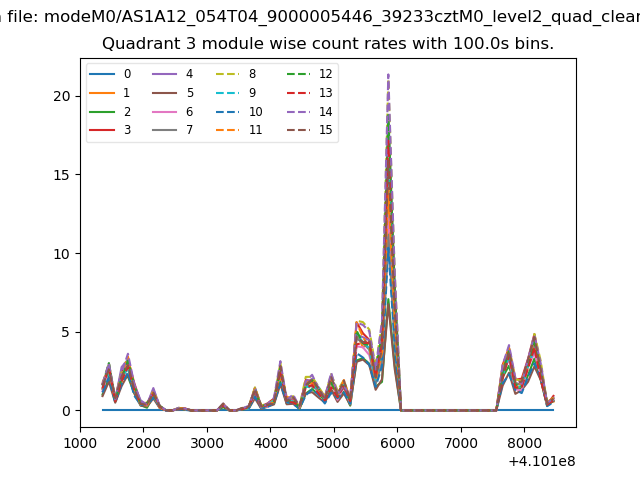
| Module-wise count rates for Quadrant C Data is divided into 100 sec bins |
 |
 |
| Module-wise count rates for Quadrant D Data is divided into 100 sec bins |
 |
 |
| Parameter | Plot |
|---|---|
| CZT HV Monitor | 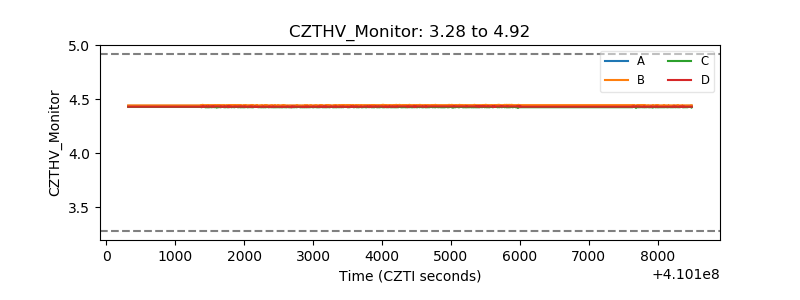 |
| D_VDD | 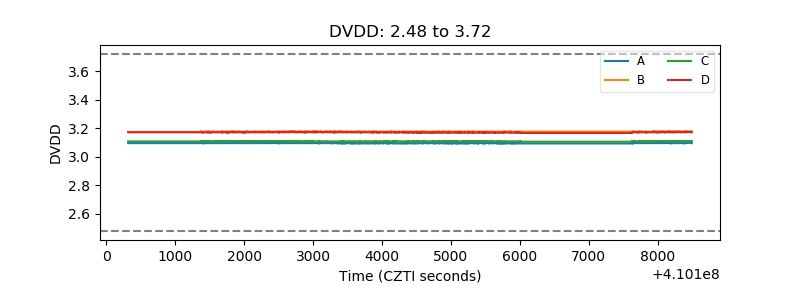 |
| Temperature 1 | 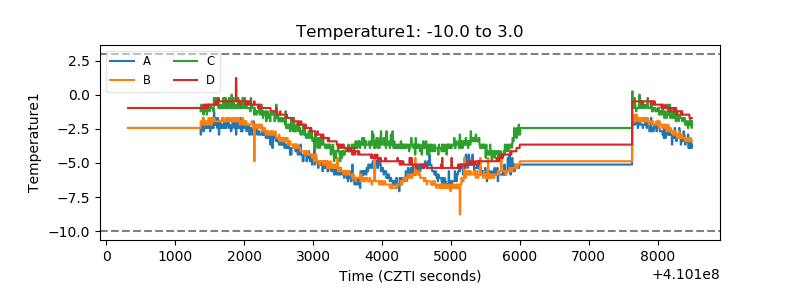 |
| Veto HV Monitor | 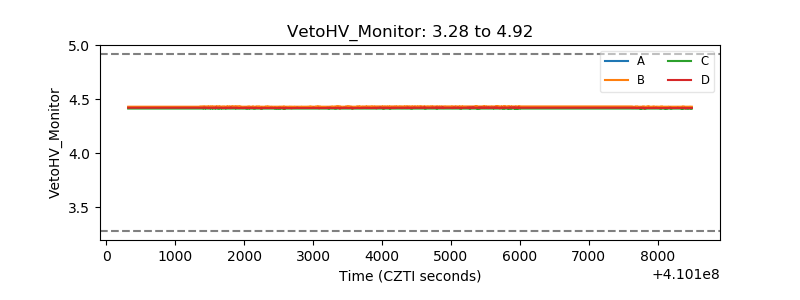 |
| Veto LLD | 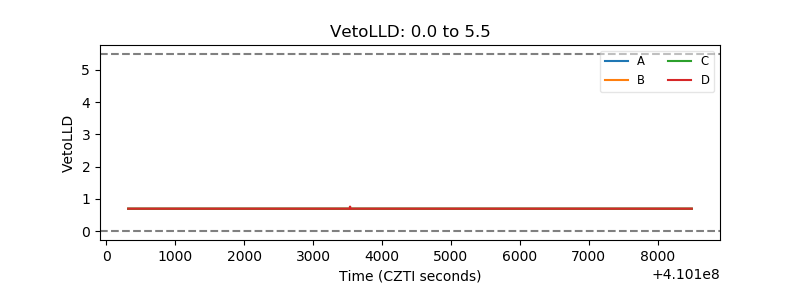 |
| Alpha Counter | 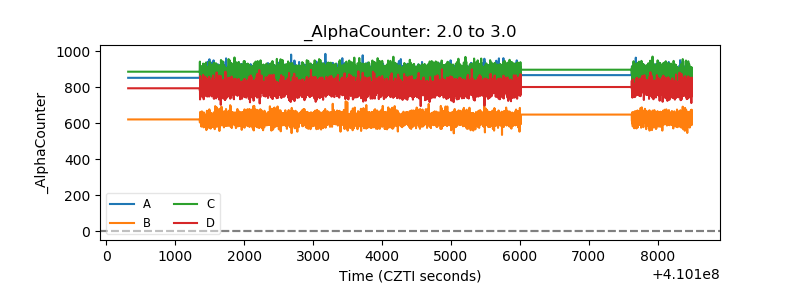 |
| _CPM_Rate | 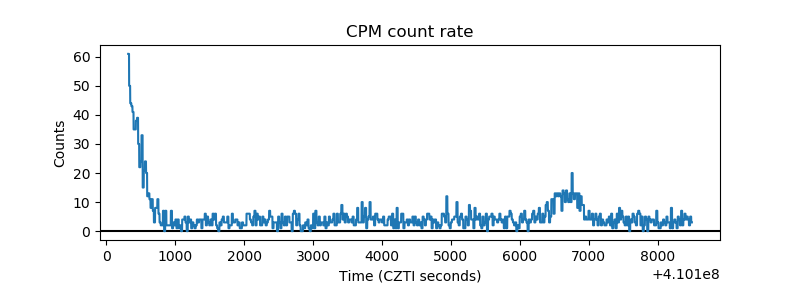 |
| CZT Counter | 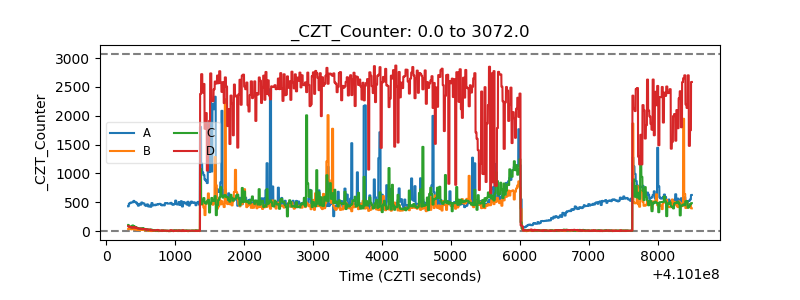 |
| +2.5 Volts monitor | 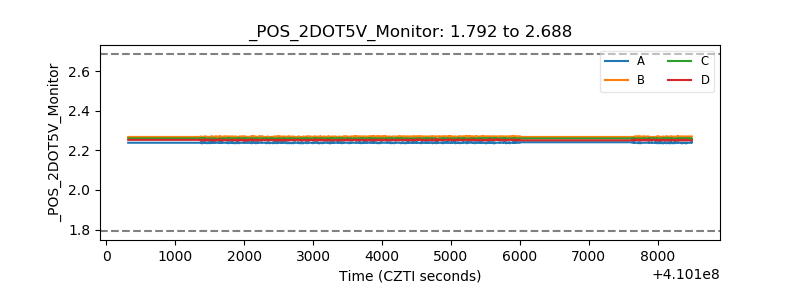 |
| +5 Volts monitor | 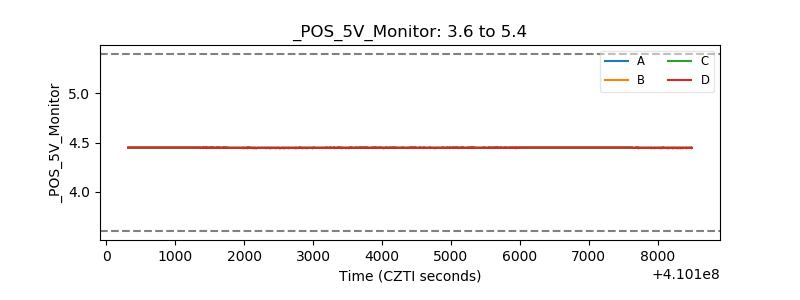 |
| _ROLL_ROT | 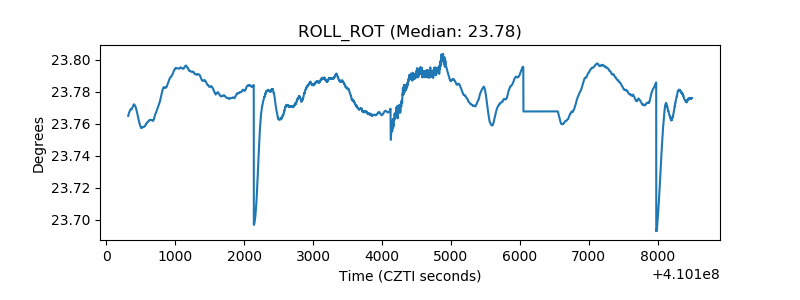 |
| _Roll_DEC | 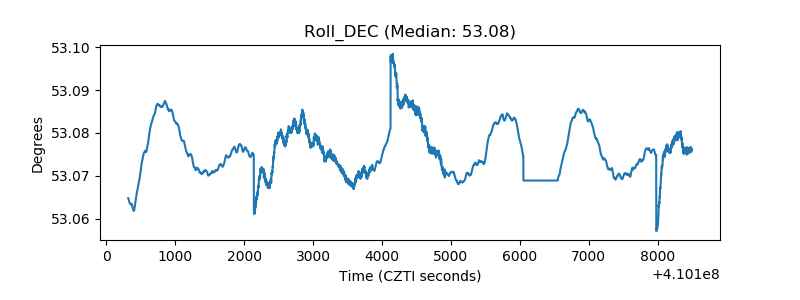 |
| _Roll_RA | 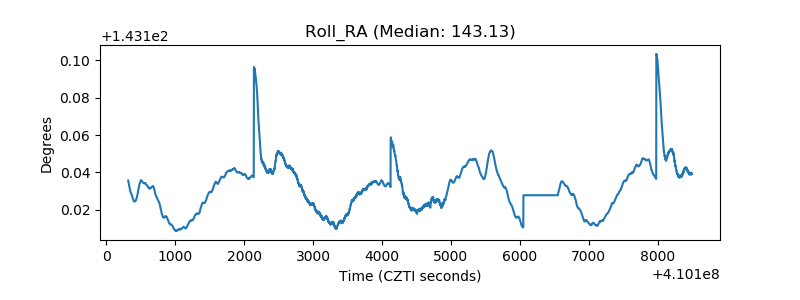 |
| Veto Counter | 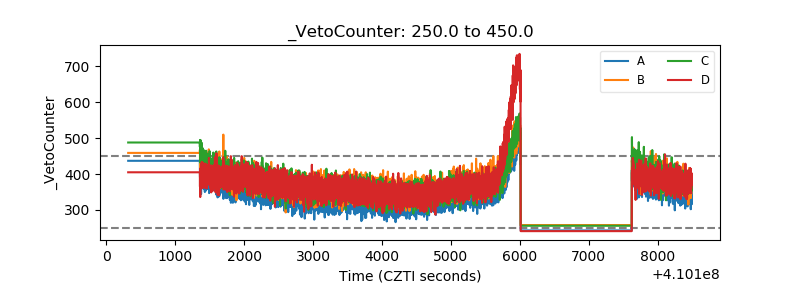 |