| Param | Original file | Final file |
|---|---|---|
| Filename | modeM0/AS1A12_054T04_9000005446_39234cztM0_level2.fits | modeM0/AS1A12_054T04_9000005446_39234cztM0_level2_quad_clean.evt |
| Size (bytes) | 150,600,960 | 20,229,120 |
| Size | 143.6 MB | 19.3 MB |
| Events in quadrant A | 827,242 | 164,175 |
| Events in quadrant B | 733,988 | 160,256 |
| Events in quadrant C | 759,441 | 148,344 |
| Events in quadrant D | 3,141,784 | 35,183 |
| Mode M9 | |||
|---|---|---|---|
| Quadrant | BADHDUFLAG | Total packets | Discarded packets |
| A | 0 | 10 | 0 |
| B | 0 | 10 | 0 |
| C | 0 | 10 | 0 |
| D | 0 | 11 | 0 |
| Mode M0 | |||
|---|---|---|---|
| Quadrant | BADHDUFLAG | Total packets | Discarded packets |
| A | 0 | 3331 | 1 |
| B | 0 | 3092 | 1 |
| C | 0 | 3098 | 1 |
| D | 0 | 10280 | 1 |
| Mode SS | |||
|---|---|---|---|
| Quadrant | BADHDUFLAG | Total packets | Discarded packets |
| A | 0 | 28 | 0 |
| B | 0 | 28 | 0 |
| C | 0 | 28 | 0 |
| D | 0 | 28 | 0 |
| Quadrant | Total seconds | Saturated seconds | Saturation percentage |
|---|---|---|---|
| A | 1404 | 5 | 0.356125% |
| B | 1404 | 26 | 1.851852% |
| C | 1404 | 10 | 0.712251% |
| D | 1404 | 1169 | 83.262108% |
Noise dominated data is calculated using 1-second bins in cleaned event files. If a bin has >2000 counts, and if more than 50% of those come from <1% of pixels, then it is considered to be noise-dominated and hence unusable.
| Quadrant | # 1 sec bins | Bins with >0 counts | Bins with >2000 counts | High rate bins dominated by noise | Noise dominated (total time) | Noise dominated (detector-on time) | Marked lightcurve |
|---|---|---|---|---|---|---|---|
| A | 1404 | 1404 | 3 | 3 | 0.21% | 0.21% | 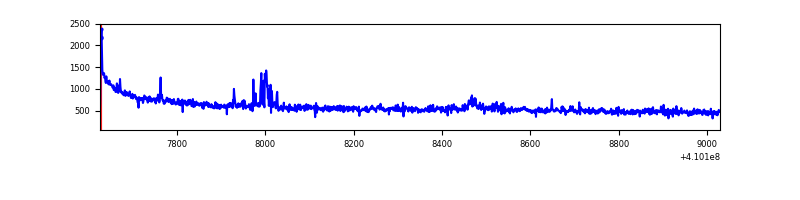 |
| B | 1404 | 1404 | 18 | 18 | 1.28% | 1.28% | 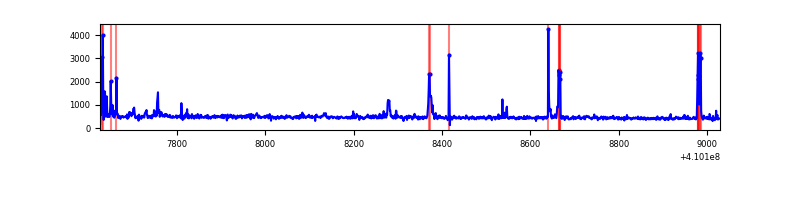 |
| C | 1404 | 1404 | 8 | 8 | 0.57% | 0.57% | 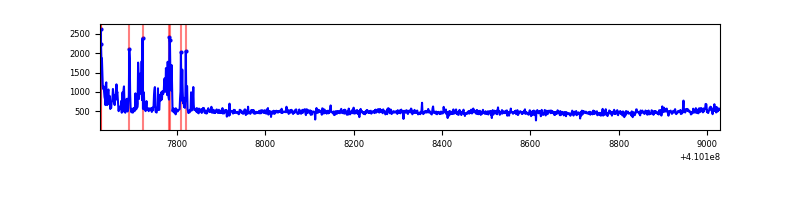 |
| D | 1404 | 1404 | 844 | 844 | 60.11% | 60.11% | 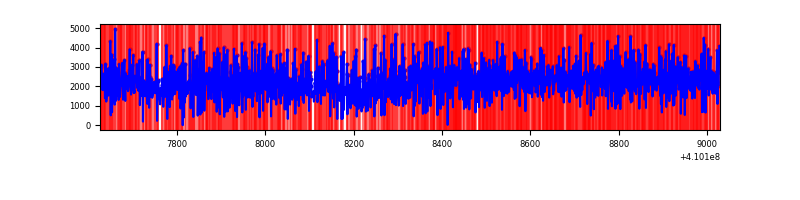 |
Top three noisy pixels from each quadrant. If the there are fewer than three noisy pixels in the level2.evt file, extra rows are filled as -1
| Pixel properties | Quadrant properties | ||||||
|---|---|---|---|---|---|---|---|
| Quadrant | DetID | PixID | Counts | Sigma | Mean | Median | Sigma |
| A | 10 | 83 | 169788 | 4869.43 | 161 | 158 | 34.8 |
| A | 13 | 248 | 19326 | 550.24 | 161 | 158 | 34.8 |
| A | 10 | 255 | 11112 | 314.45 | 161 | 158 | 34.8 |
| B | 5 | 255 | 59042 | 1819.85 | 157 | 153 | 32.4 |
| B | 5 | 172 | 37109 | 1142.06 | 157 | 153 | 32.4 |
| B | 0 | 197 | 5746 | 172.84 | 157 | 153 | 32.4 |
| C | 15 | 214 | 62368 | 1636.33 | 155 | 156 | 38.0 |
| C | 14 | 254 | 60491 | 1586.96 | 155 | 156 | 38.0 |
| C | 3 | 233 | 16809 | 438.02 | 155 | 156 | 38.0 |
| D | 12 | 235 | 2537884 | 91316.85 | 104 | 100 | 27.8 |
| D | 12 | 227 | 69862 | 2510.24 | 104 | 100 | 27.8 |
| D | 1 | 47 | 55831 | 2005.36 | 104 | 100 | 27.8 |
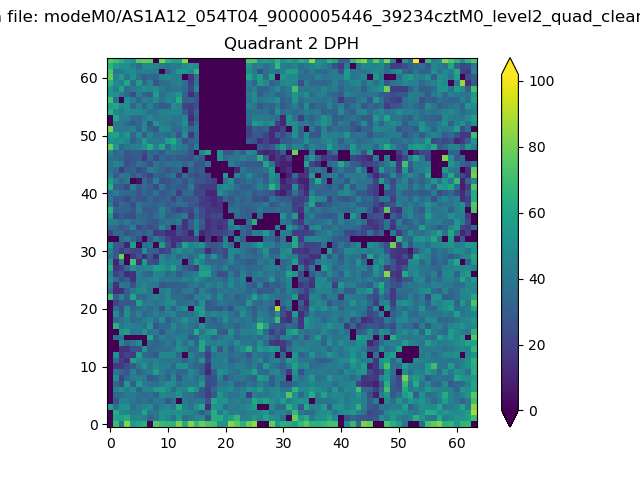
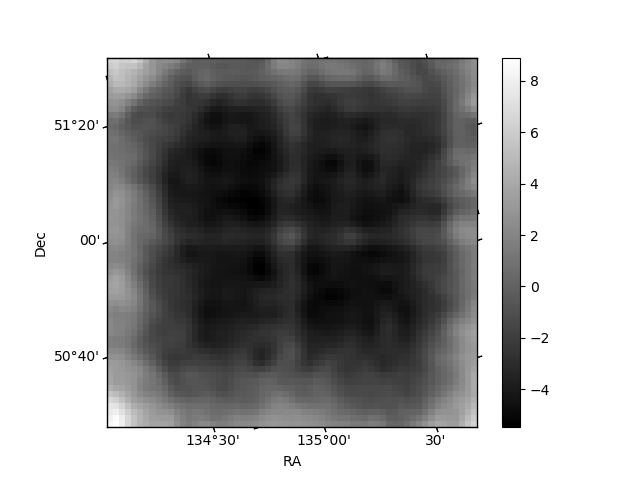
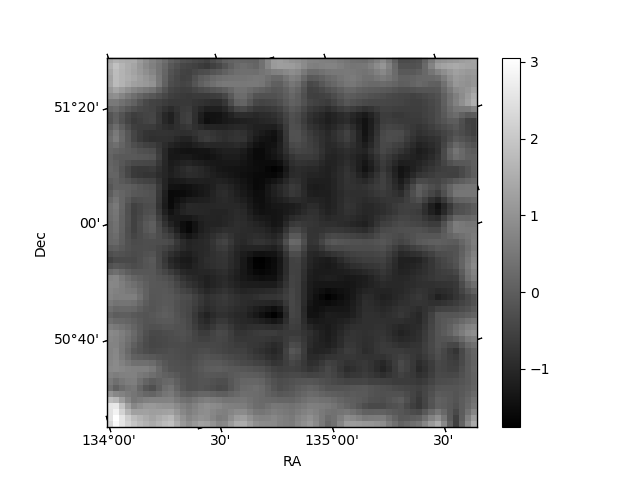
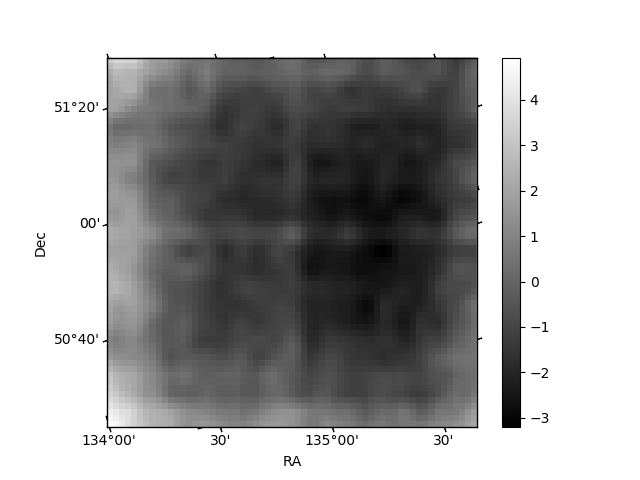
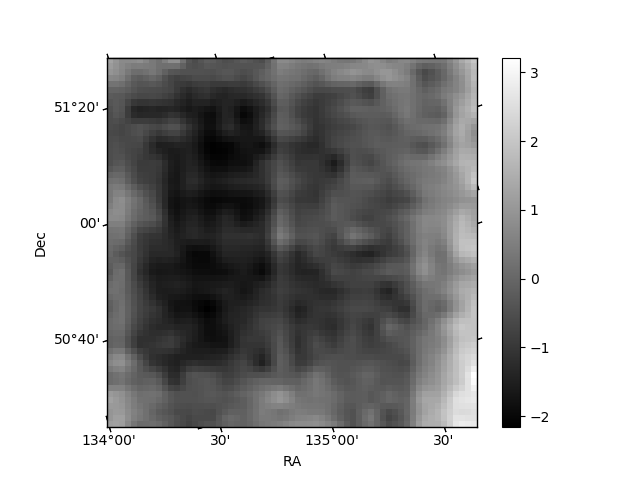
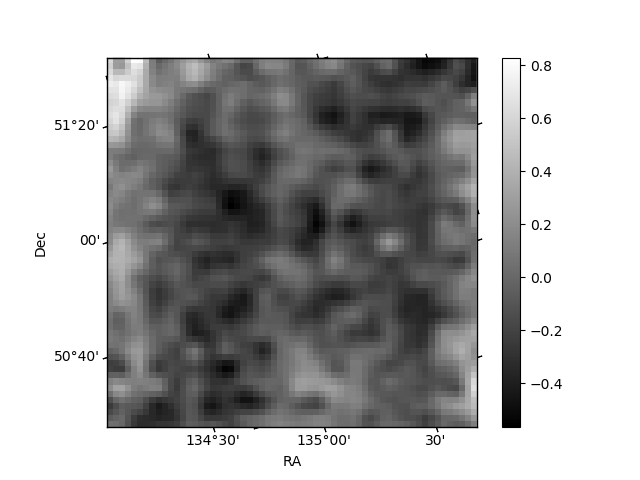
Histogram calculated using DETX and DETY for each event in the final _common_clean file
| Quadrant A | 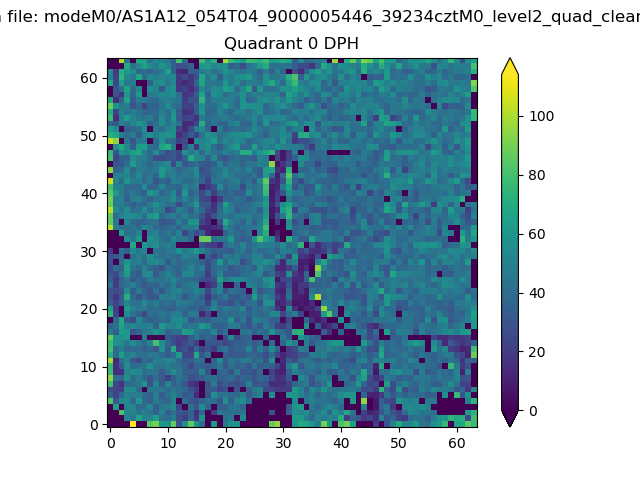 |
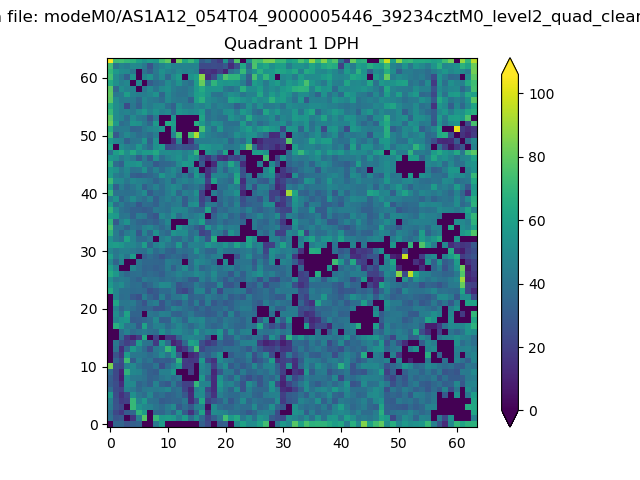 |
Quadrant B |
|---|---|---|---|
| Quadrant D | 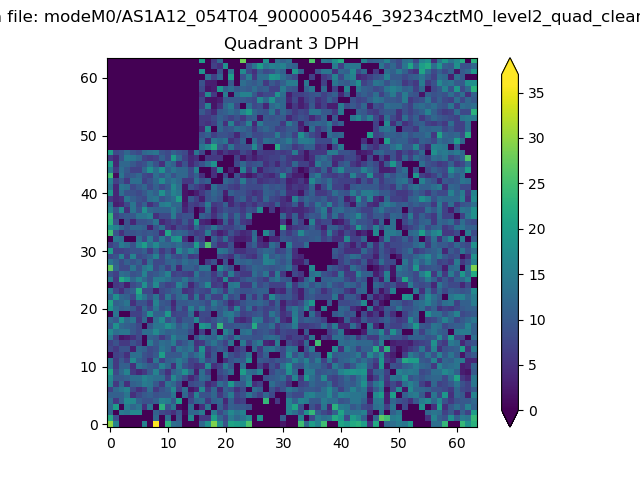 |
 |
Quadrant C |
| Plot type | Count rate plots | Images |
|---|---|---|
| Comparison with Poisson distribution Blue bars denote a histogram of data divided into 1 sec bins. Red curve is a Poisson curve with rate = median count rate of data. |
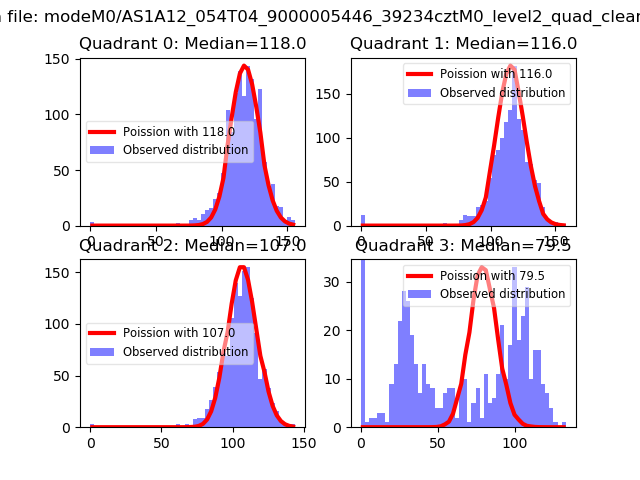 |
 |
| Quadrant-wise count rates Data is divided into 100 sec bins |
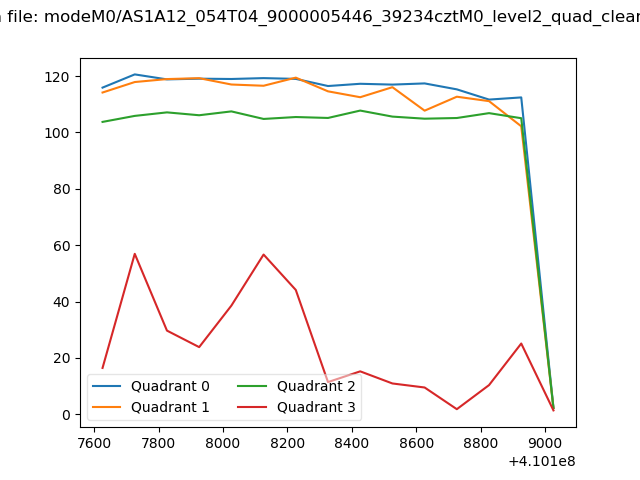 |
|
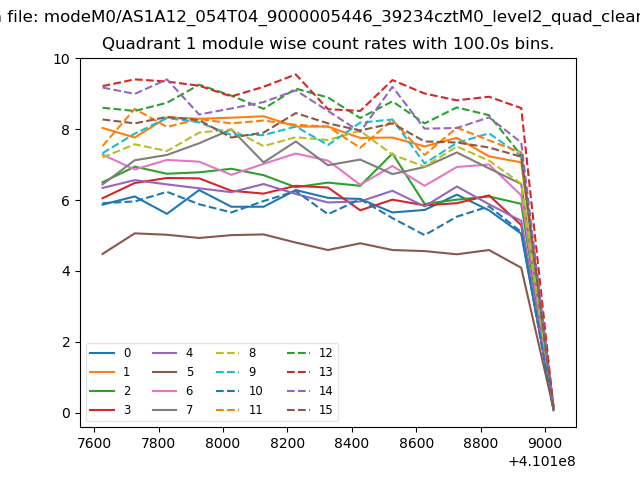
| Module-wise count rates for Quadrant A Data is divided into 100 sec bins |
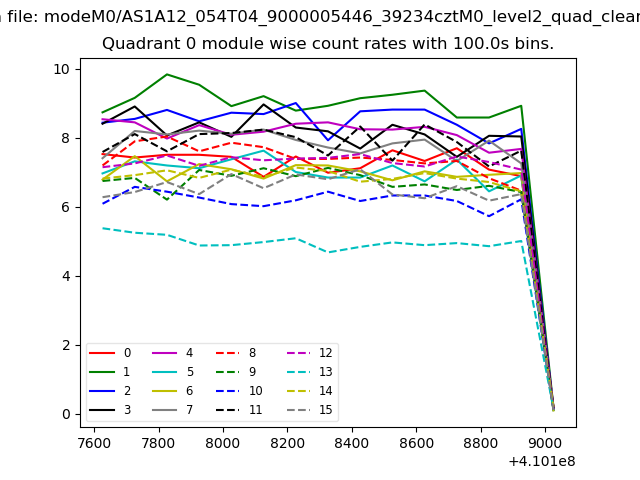 |
 |
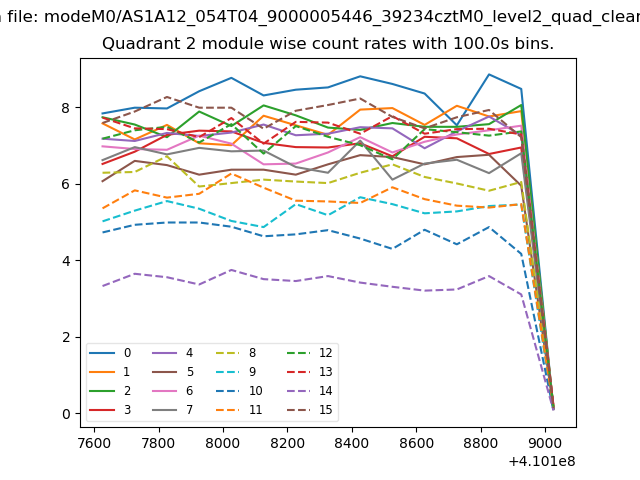
| Module-wise count rates for Quadrant B Data is divided into 100 sec bins |
 |
 |
| Module-wise count rates for Quadrant C Data is divided into 100 sec bins |
 |
 |
| Module-wise count rates for Quadrant D Data is divided into 100 sec bins |
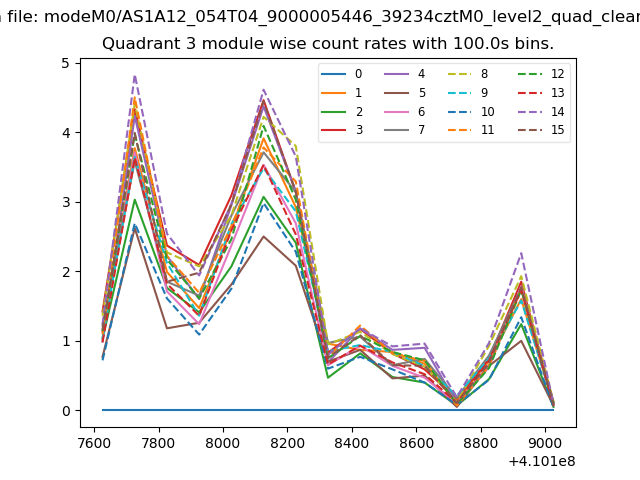 |
 |
| Parameter | Plot |
|---|---|
| CZT HV Monitor |  |
| D_VDD |  |
| Temperature 1 | 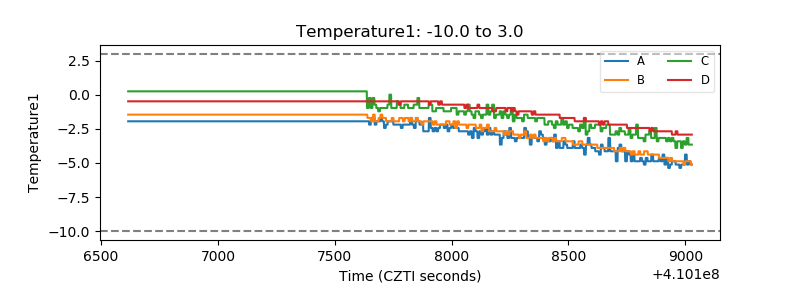 |
| Veto HV Monitor | 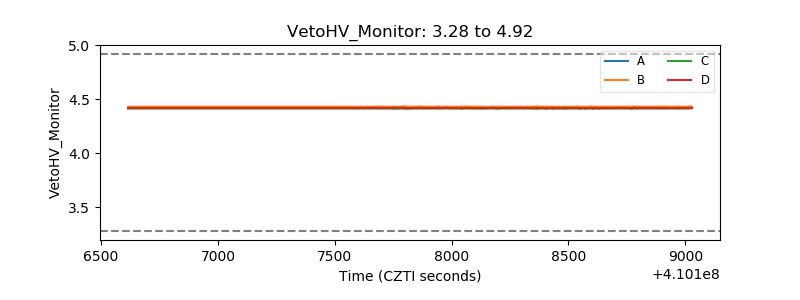 |
| Veto LLD | 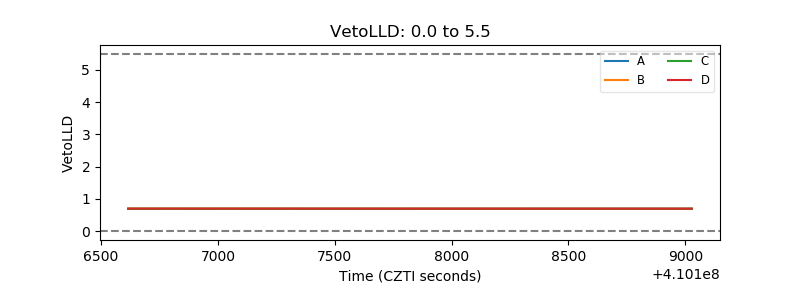 |
| Alpha Counter | 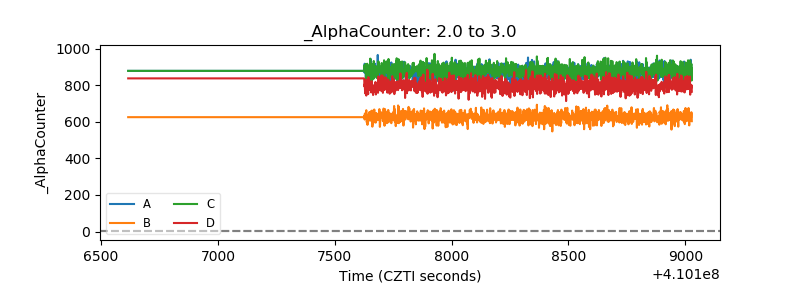 |
| _CPM_Rate | 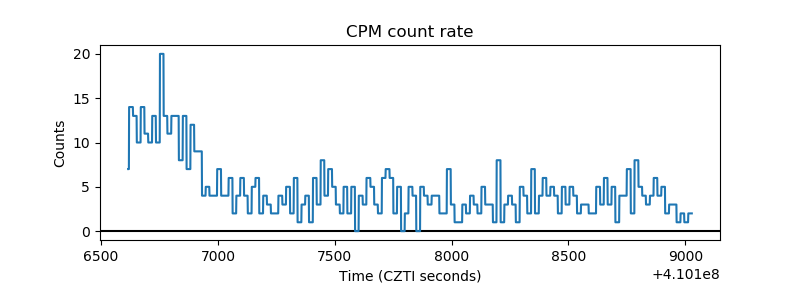 |
| CZT Counter | 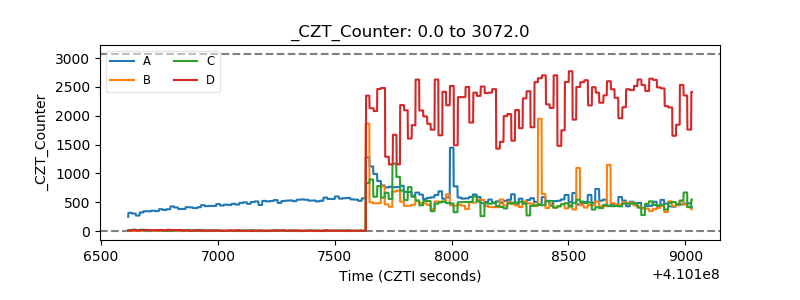 |
| +2.5 Volts monitor | 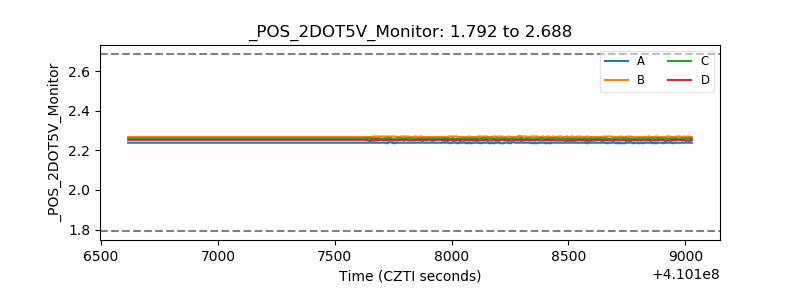 |
| +5 Volts monitor |  |
| _ROLL_ROT | 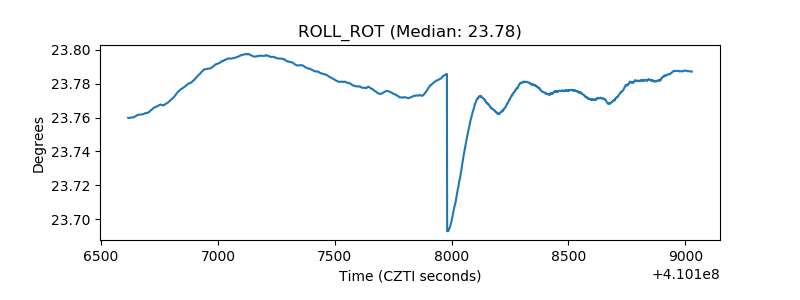 |
| _Roll_DEC | 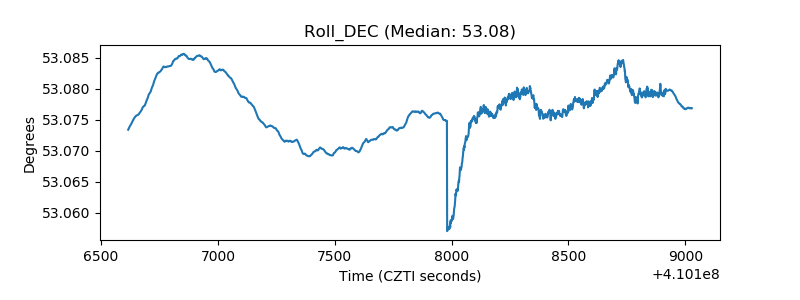 |
| _Roll_RA | 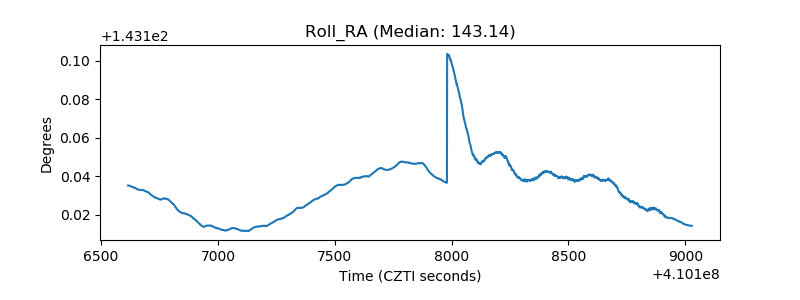 |
| Veto Counter | 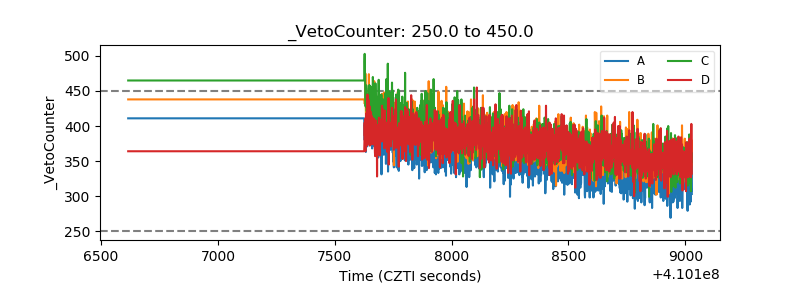 |