| Param | Original file | Final file |
|---|---|---|
| Filename | modeM0/AS1A12_083T01_9000005448_39234cztM0_level2.fits | modeM0/AS1A12_083T01_9000005448_39234cztM0_level2_quad_clean.evt |
| Size (bytes) | 408,790,080 | 53,231,040 |
| Size | 389.9 MB | 50.8 MB |
| Events in quadrant A | 2,581,235 | 413,609 |
| Events in quadrant B | 1,704,029 | 427,890 |
| Events in quadrant C | 2,065,193 | 403,984 |
| Events in quadrant D | 8,493,849 | 105,594 |
| Mode M0 | |||
|---|---|---|---|
| Quadrant | BADHDUFLAG | Total packets | Discarded packets |
| A | 0 | 10050 | 2 |
| B | 0 | 7518 | 1 |
| C | 0 | 8586 | 1 |
| D | 0 | 27731 | 1 |
| Mode M9 | |||
|---|---|---|---|
| Quadrant | BADHDUFLAG | Total packets | Discarded packets |
| A | 0 | 13 | 0 |
| B | 0 | 13 | 0 |
| C | 0 | 13 | 0 |
| D | 0 | 13 | 0 |
| Mode SS | |||
|---|---|---|---|
| Quadrant | BADHDUFLAG | Total packets | Discarded packets |
| A | 0 | 76 | 0 |
| B | 0 | 76 | 0 |
| C | 0 | 76 | 0 |
| D | 0 | 76 | 0 |
| Quadrant | Total seconds | Saturated seconds | Saturation percentage |
|---|---|---|---|
| A | 3684 | 137 | 3.718784% |
| B | 3684 | 7 | 0.190011% |
| C | 3684 | 52 | 1.411509% |
| D | 3684 | 2868 | 77.850163% |
Noise dominated data is calculated using 1-second bins in cleaned event files. If a bin has >2000 counts, and if more than 50% of those come from <1% of pixels, then it is considered to be noise-dominated and hence unusable.
| Quadrant | # 1 sec bins | Bins with >0 counts | Bins with >2000 counts | High rate bins dominated by noise | Noise dominated (total time) | Noise dominated (detector-on time) | Marked lightcurve |
|---|---|---|---|---|---|---|---|
| A | 5057 | 3685 | 123 | 123 | 2.43% | 3.34% | 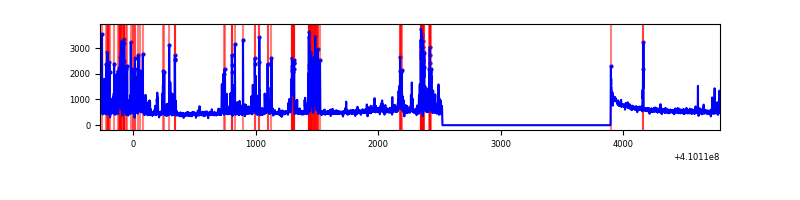 |
| B | 5057 | 3685 | 0 | 0 | 0.00% | 0.00% | 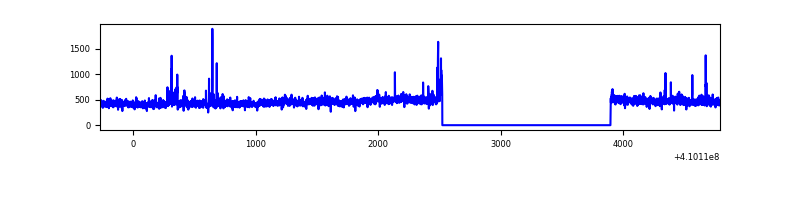 |
| C | 5057 | 3685 | 43 | 43 | 0.85% | 1.17% | 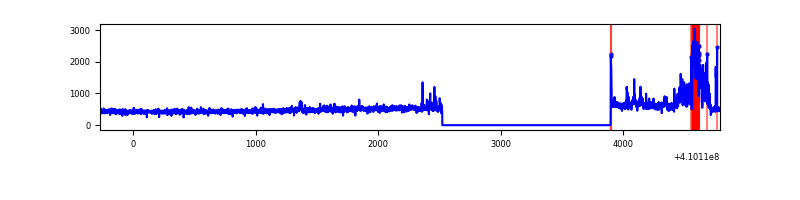 |
| D | 5057 | 3685 | 2514 | 2514 | 49.71% | 68.22% | 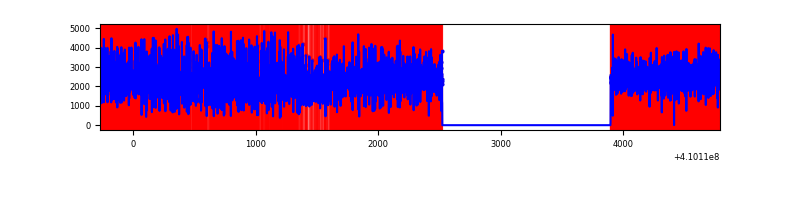 |
Top three noisy pixels from each quadrant. If the there are fewer than three noisy pixels in the level2.evt file, extra rows are filled as -1
| Pixel properties | Quadrant properties | ||||||
|---|---|---|---|---|---|---|---|
| Quadrant | DetID | PixID | Counts | Sigma | Mean | Median | Sigma |
| A | 13 | 248 | 718332 | 8513.04 | 411 | 403 | 84.3 |
| A | 10 | 83 | 257574 | 3049.47 | 411 | 403 | 84.3 |
| A | 10 | 255 | 16255 | 187.97 | 411 | 403 | 84.3 |
| B | 5 | 172 | 31976 | 385.04 | 411 | 401 | 82.0 |
| B | 0 | 190 | 30819 | 370.93 | 411 | 401 | 82.0 |
| B | 0 | 230 | 12164 | 143.44 | 411 | 401 | 82.0 |
| C | 9 | 187 | 250237 | 2625.42 | 401 | 406 | 95.2 |
| C | 15 | 214 | 151442 | 1587.21 | 401 | 406 | 95.2 |
| C | 3 | 233 | 60004 | 626.3 | 401 | 406 | 95.2 |
| D | 12 | 235 | 7055053 | 109506.7 | 260 | 253 | 64.4 |
| D | 2 | 249 | 180202 | 2793.22 | 260 | 253 | 64.4 |
| D | 12 | 227 | 110407 | 1709.84 | 260 | 253 | 64.4 |
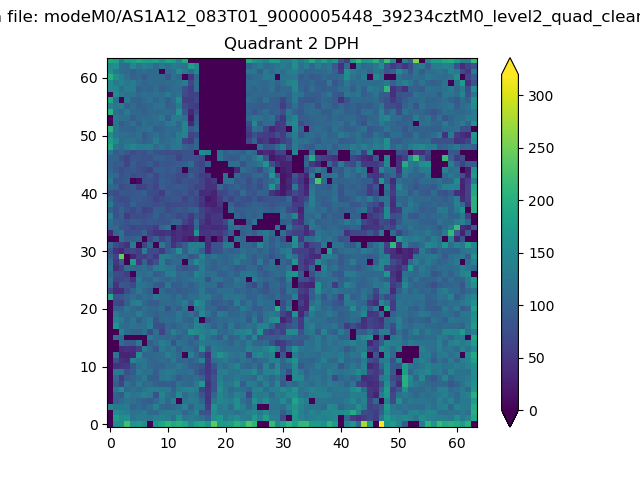
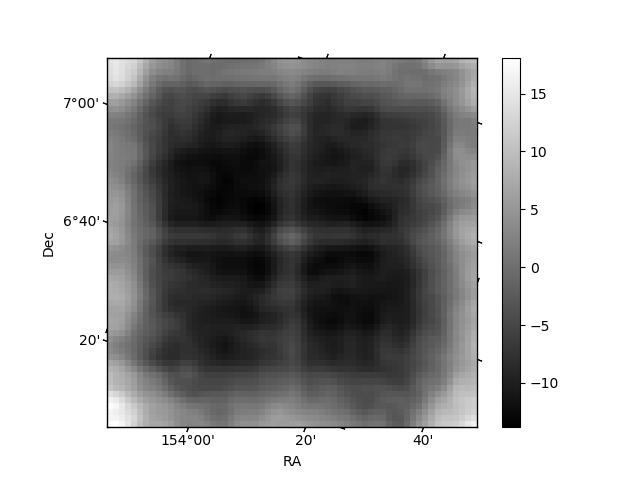
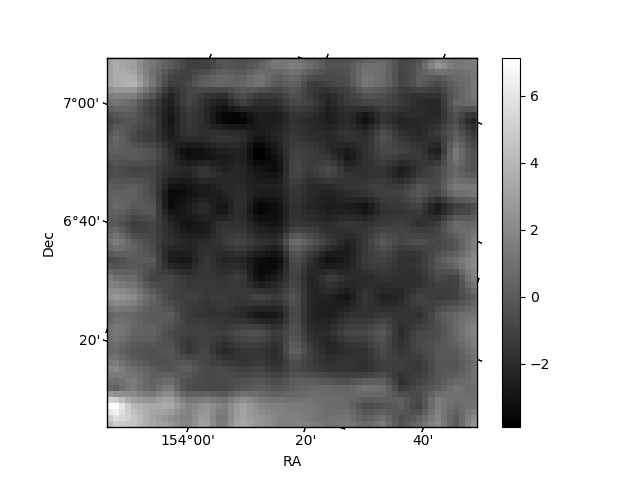
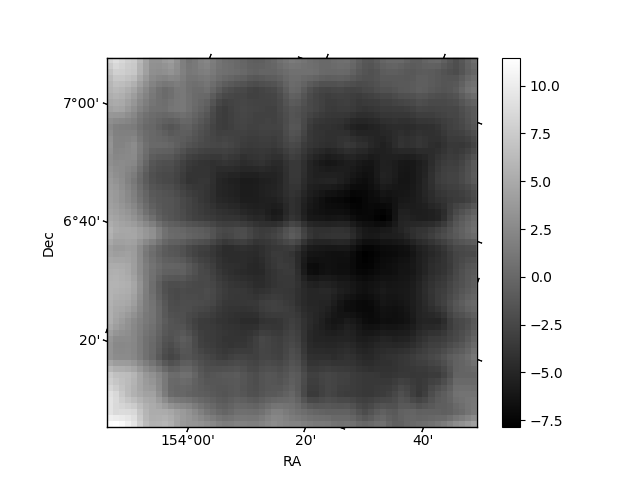
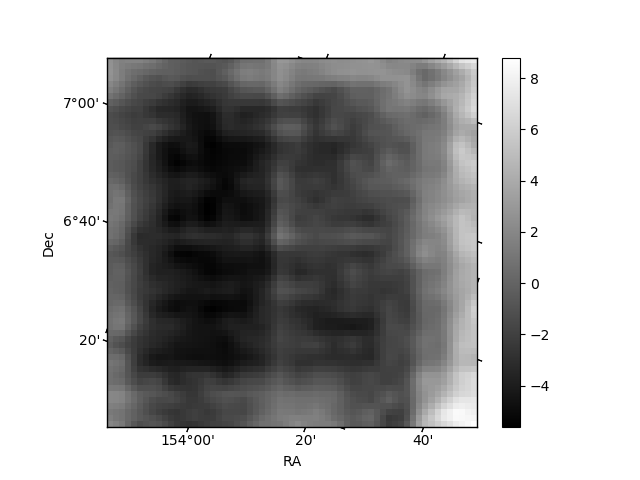
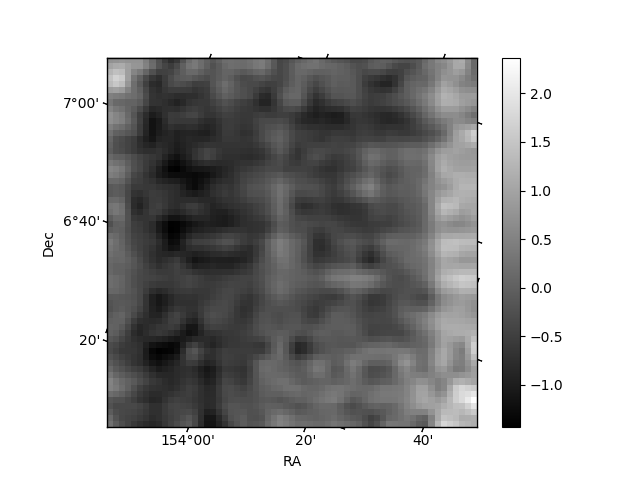
Histogram calculated using DETX and DETY for each event in the final _common_clean file
| Quadrant A | 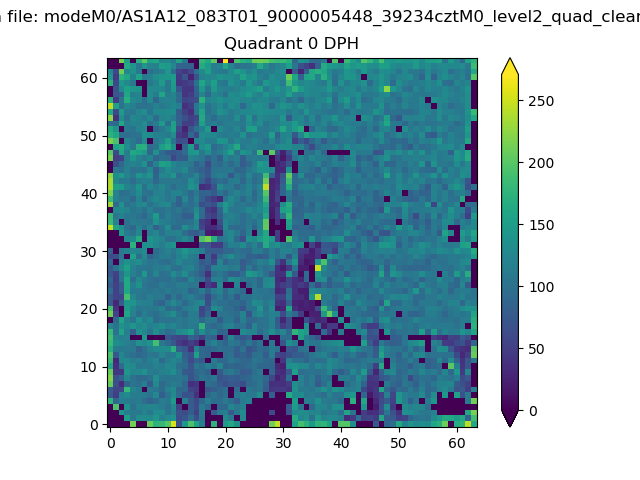 |
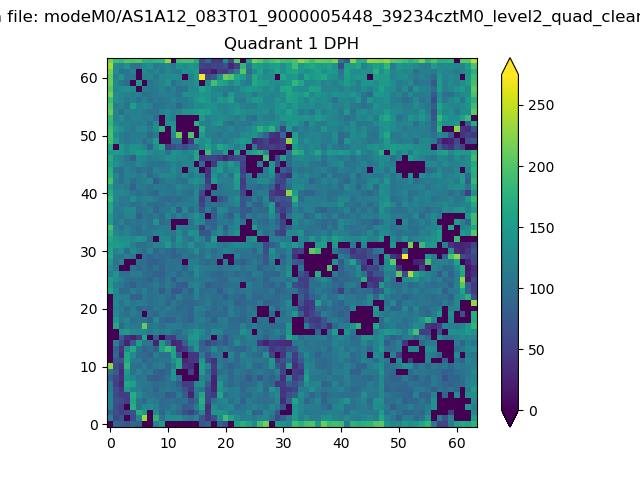 |
Quadrant B |
|---|---|---|---|
| Quadrant D | 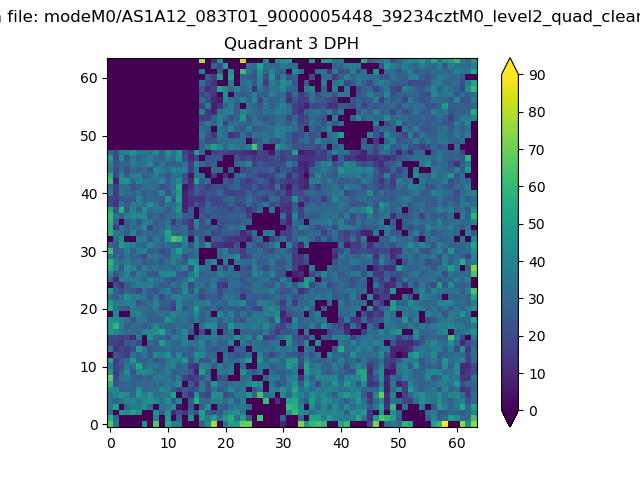 |
 |
Quadrant C |
| Plot type | Count rate plots | Images |
|---|---|---|
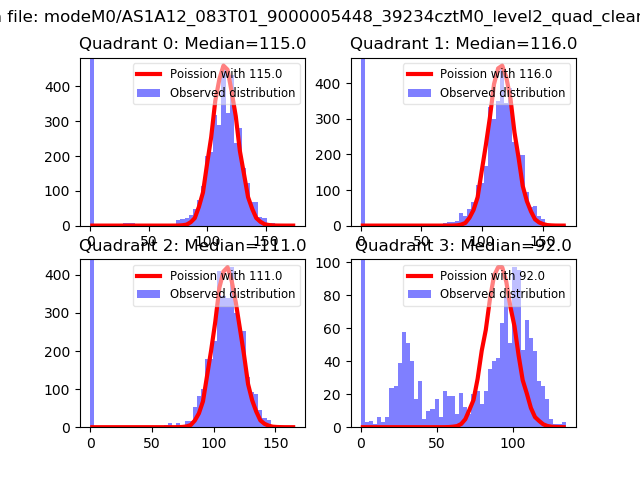
| Comparison with Poisson distribution Blue bars denote a histogram of data divided into 1 sec bins. Red curve is a Poisson curve with rate = median count rate of data. |
 |
 |
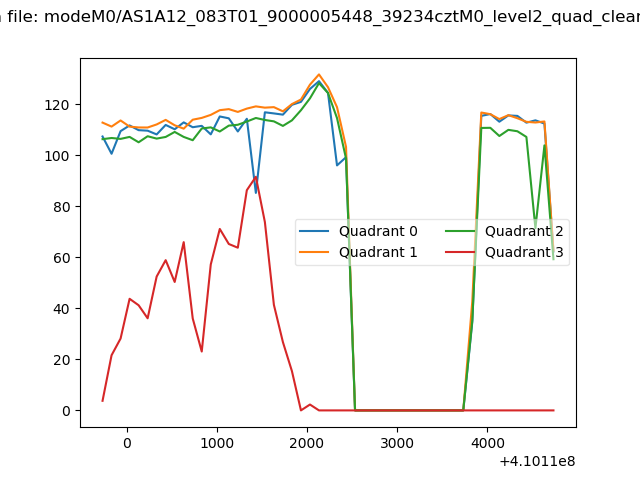
| Quadrant-wise count rates Data is divided into 100 sec bins |
 |
|
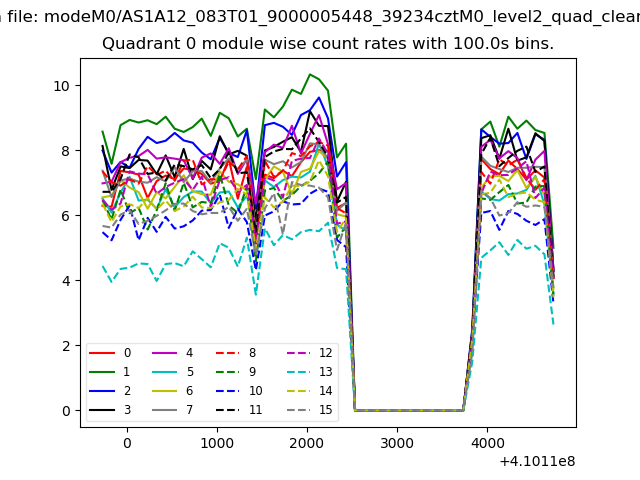
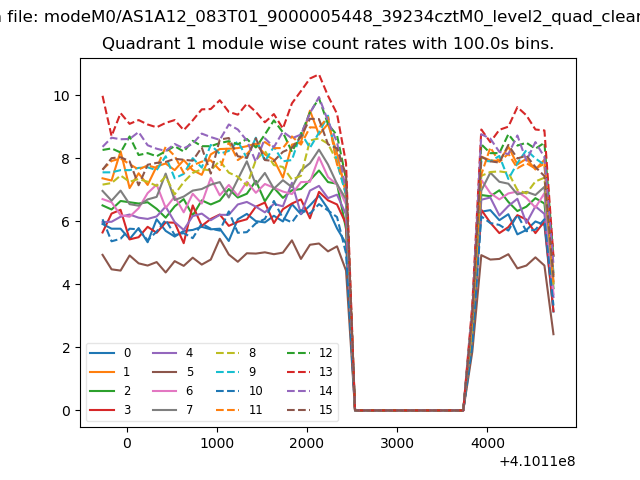
| Module-wise count rates for Quadrant A Data is divided into 100 sec bins |
 |
 |
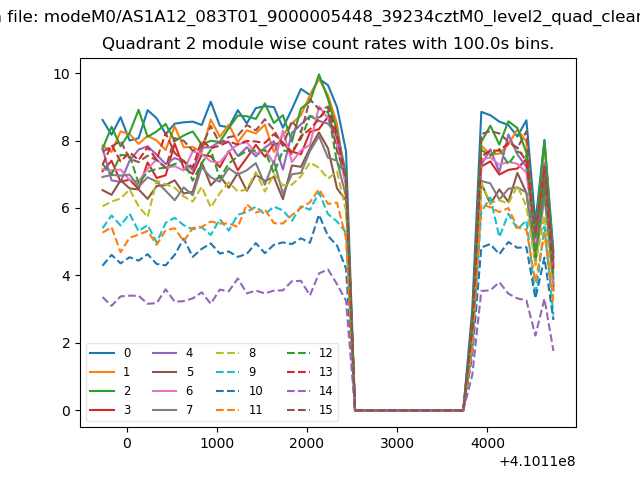
| Module-wise count rates for Quadrant B Data is divided into 100 sec bins |
 |
 |
| Module-wise count rates for Quadrant C Data is divided into 100 sec bins |
 |
 |
| Module-wise count rates for Quadrant D Data is divided into 100 sec bins |
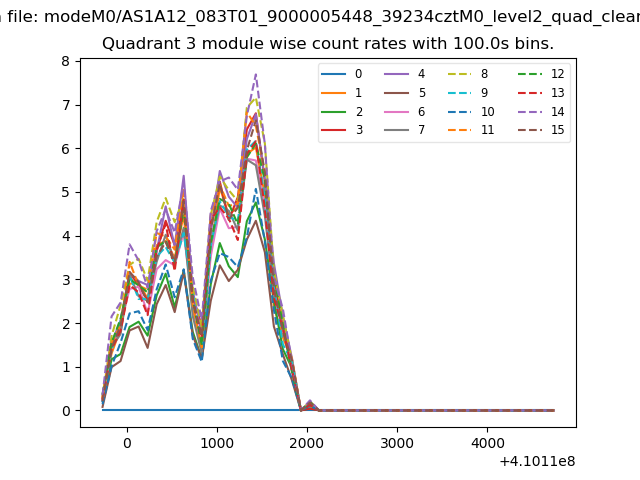 |
 |
| Parameter | Plot |
|---|---|
| CZT HV Monitor | 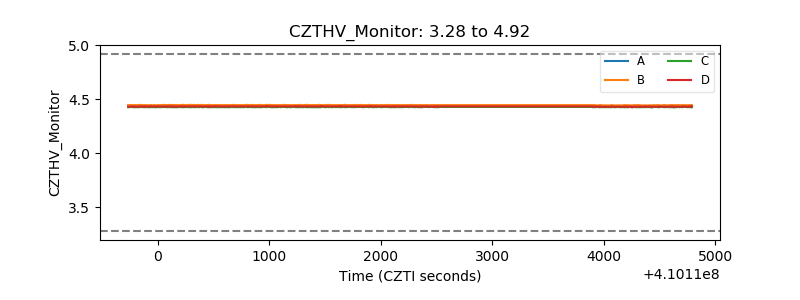 |
| D_VDD | 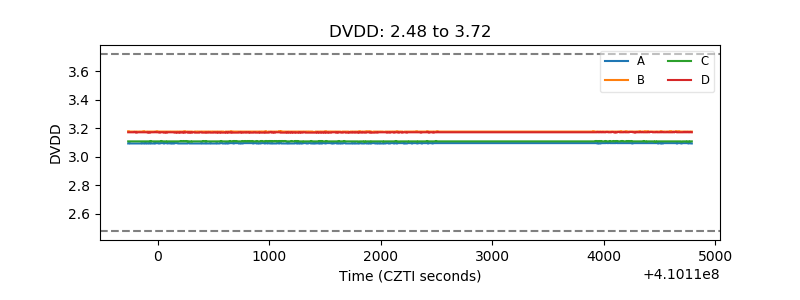 |
| Temperature 1 | 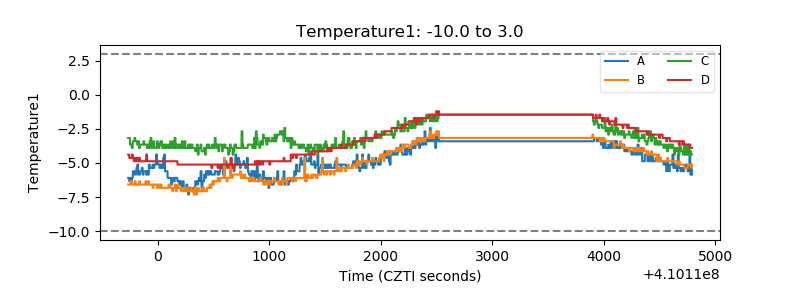 |
| Veto HV Monitor |  |
| Veto LLD | 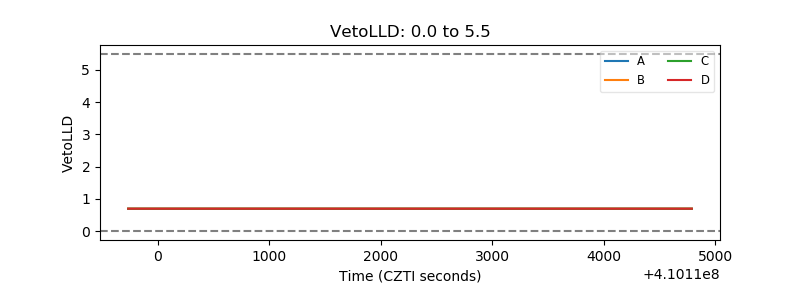 |
| Alpha Counter | 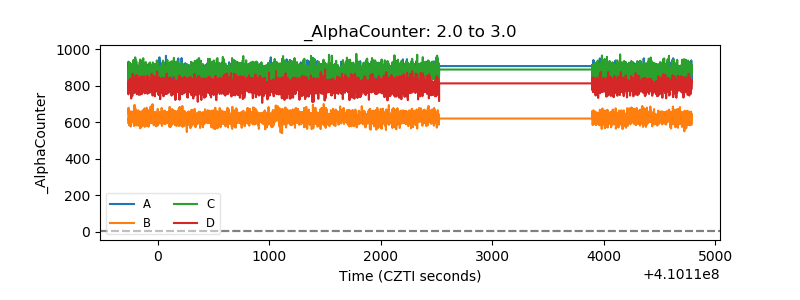 |
| _CPM_Rate | 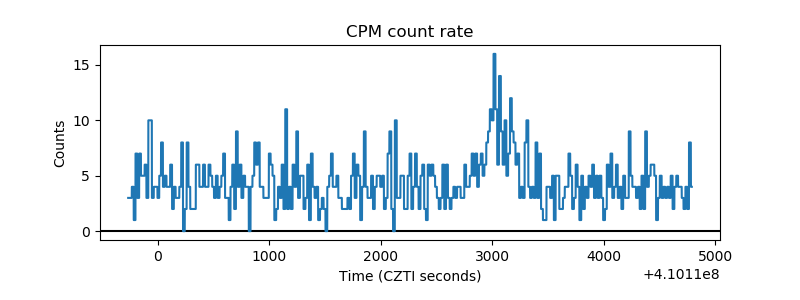 |
| CZT Counter | 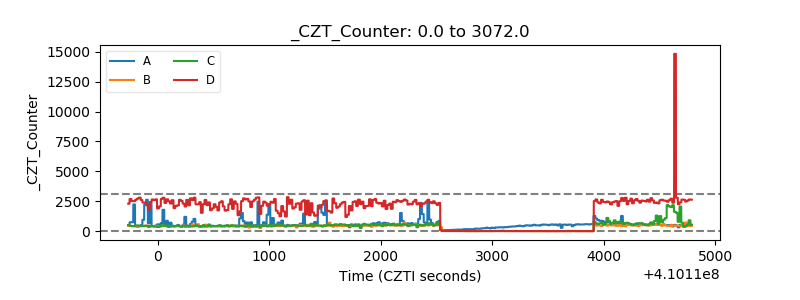 |
| +2.5 Volts monitor | 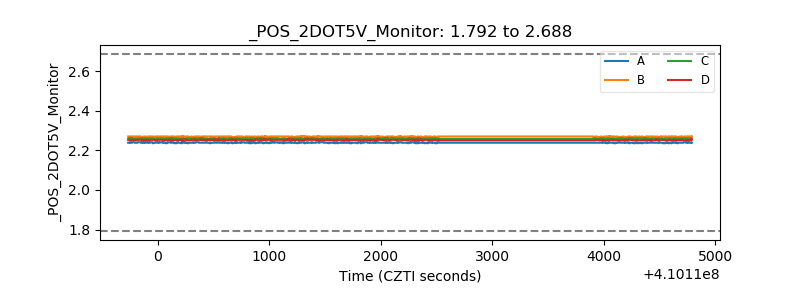 |
| +5 Volts monitor | 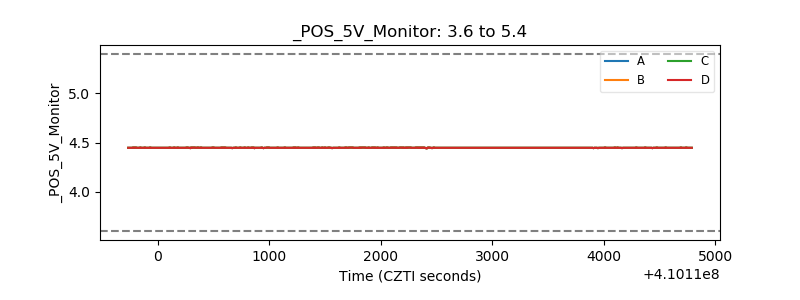 |
| _ROLL_ROT | 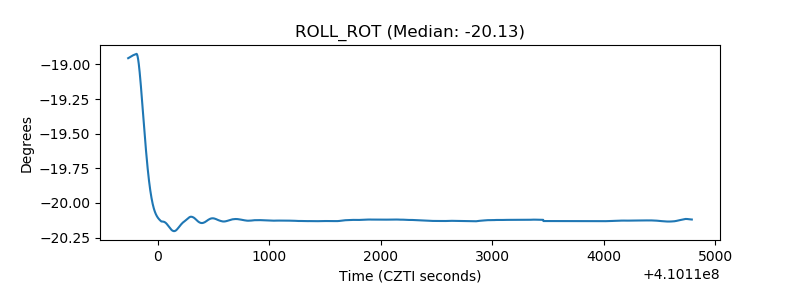 |
| _Roll_DEC | 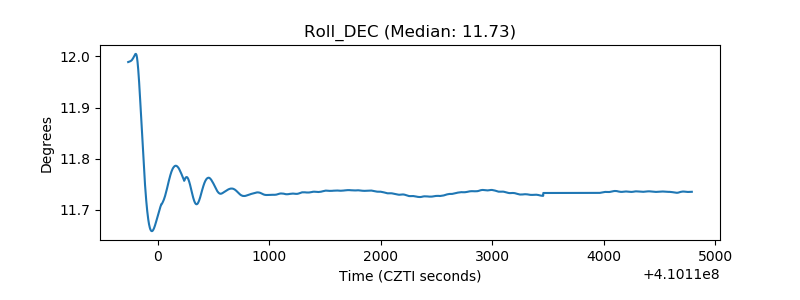 |
| _Roll_RA | 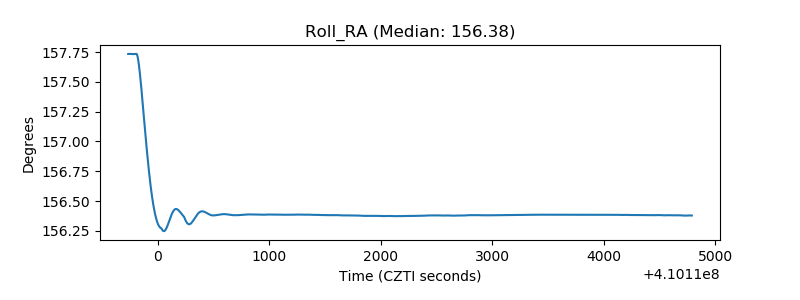 |
| Veto Counter | 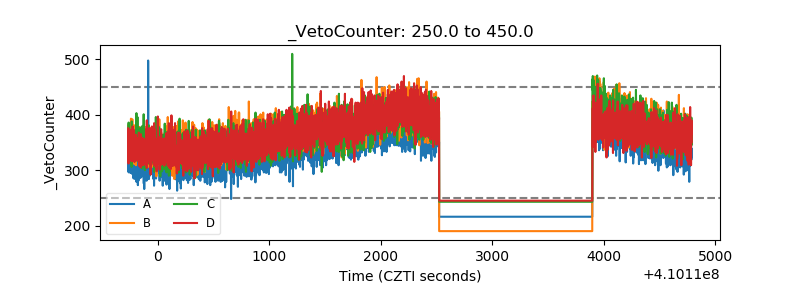 |