| Param | Original file | Final file |
|---|---|---|
| Filename | modeM0/AS1A12_083T01_9000005448_39235cztM0_level2.fits | modeM0/AS1A12_083T01_9000005448_39235cztM0_level2_quad_clean.evt |
| Size (bytes) | 641,243,520 | 84,628,800 |
| Size | 611.5 MB | 80.7 MB |
| Events in quadrant A | 4,090,621 | 652,268 |
| Events in quadrant B | 2,982,150 | 658,256 |
| Events in quadrant C | 3,087,156 | 633,290 |
| Events in quadrant D | 13,120,405 | 208,400 |
| Mode M0 | |||
|---|---|---|---|
| Quadrant | BADHDUFLAG | Total packets | Discarded packets |
| A | 0 | 15998 | 2 |
| B | 0 | 12845 | 1 |
| C | 0 | 12934 | 1 |
| D | 0 | 42940 | 1 |
| Mode M9 | |||
|---|---|---|---|
| Quadrant | BADHDUFLAG | Total packets | Discarded packets |
| A | 0 | 13 | 0 |
| B | 0 | 13 | 0 |
| C | 0 | 13 | 0 |
| D | 0 | 13 | 0 |
| Mode SS | |||
|---|---|---|---|
| Quadrant | BADHDUFLAG | Total packets | Discarded packets |
| A | 0 | 118 | 0 |
| B | 0 | 118 | 0 |
| C | 0 | 118 | 0 |
| D | 0 | 118 | 0 |
| Quadrant | Total seconds | Saturated seconds | Saturation percentage |
|---|---|---|---|
| A | 5874 | 157 | 2.672795% |
| B | 5874 | 109 | 1.855635% |
| C | 5874 | 51 | 0.868233% |
| D | 5874 | 4256 | 72.454886% |
Noise dominated data is calculated using 1-second bins in cleaned event files. If a bin has >2000 counts, and if more than 50% of those come from <1% of pixels, then it is considered to be noise-dominated and hence unusable.
| Quadrant | # 1 sec bins | Bins with >0 counts | Bins with >2000 counts | High rate bins dominated by noise | Noise dominated (total time) | Noise dominated (detector-on time) | Marked lightcurve |
|---|---|---|---|---|---|---|---|
| A | 7157 | 5875 | 125 | 125 | 1.75% | 2.13% | 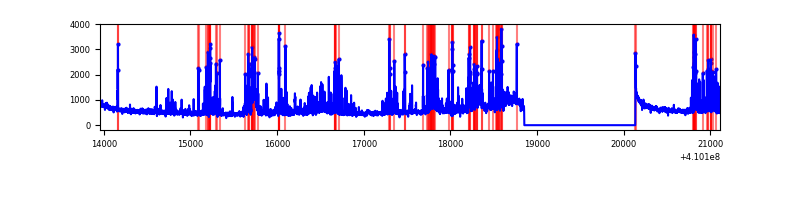 |
| B | 7157 | 5875 | 59 | 59 | 0.82% | 1.00% | 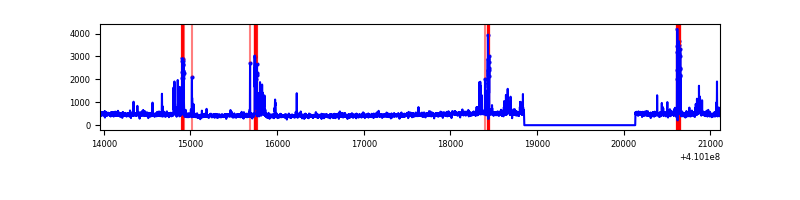 |
| C | 7157 | 5875 | 42 | 42 | 0.59% | 0.71% | 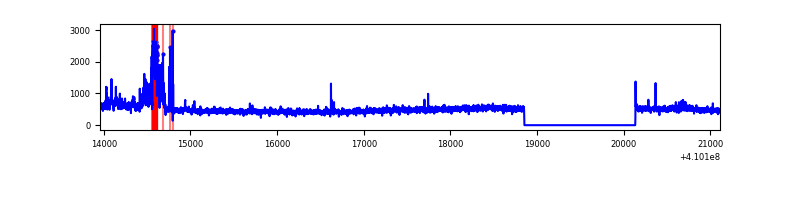 |
| D | 7157 | 5873 | 3630 | 3630 | 50.72% | 61.81% | 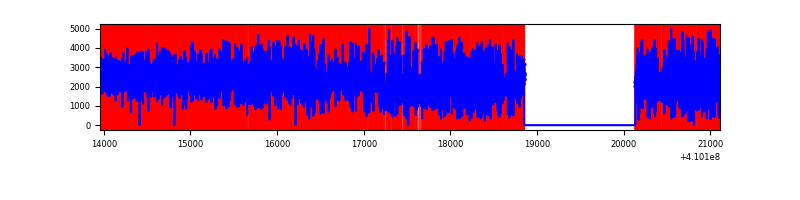 |
Top three noisy pixels from each quadrant. If the there are fewer than three noisy pixels in the level2.evt file, extra rows are filled as -1
| Pixel properties | Quadrant properties | ||||||
|---|---|---|---|---|---|---|---|
| Quadrant | DetID | PixID | Counts | Sigma | Mean | Median | Sigma |
| A | 13 | 248 | 754653 | 5633.87 | 653 | 641 | 133.8 |
| A | 10 | 83 | 421426 | 3144.04 | 653 | 641 | 133.8 |
| A | 3 | 80 | 320244 | 2388.03 | 653 | 641 | 133.8 |
| B | 5 | 172 | 357103 | 2792.63 | 649 | 631 | 127.6 |
| B | 0 | 190 | 32365 | 248.61 | 649 | 631 | 127.6 |
| B | 0 | 213 | 21372 | 162.49 | 649 | 631 | 127.6 |
| C | 15 | 214 | 244561 | 1612.5 | 639 | 642 | 151.3 |
| C | 9 | 187 | 242397 | 1598.2 | 639 | 642 | 151.3 |
| C | 3 | 233 | 49721 | 324.45 | 639 | 642 | 151.3 |
| D | 12 | 235 | 10066592 | 93743.23 | 437 | 426 | 107.4 |
| D | 2 | 249 | 811541 | 7553.67 | 437 | 426 | 107.4 |
| D | 12 | 227 | 405226 | 3769.78 | 437 | 426 | 107.4 |
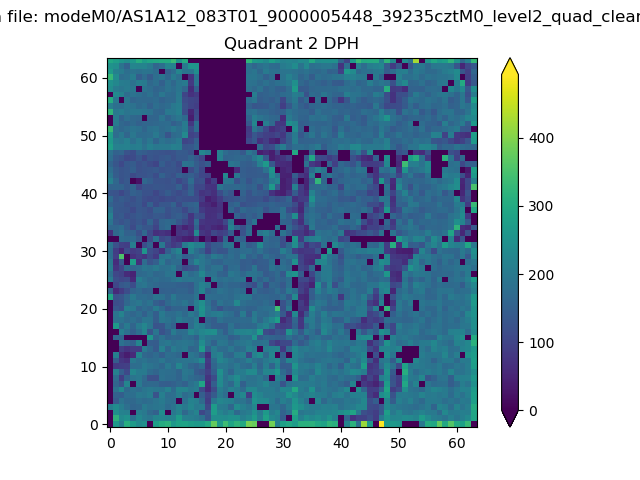
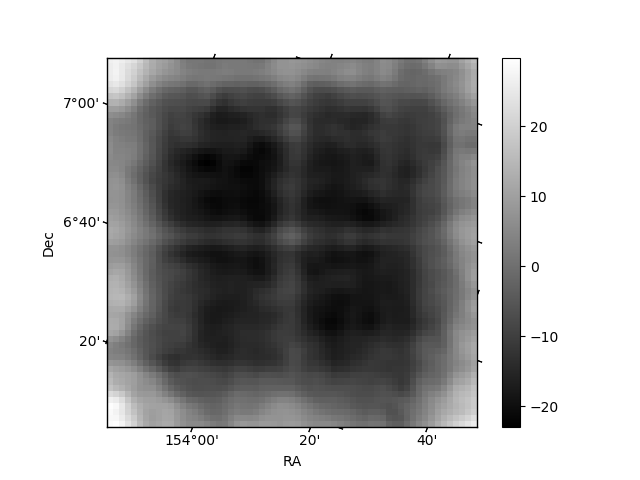
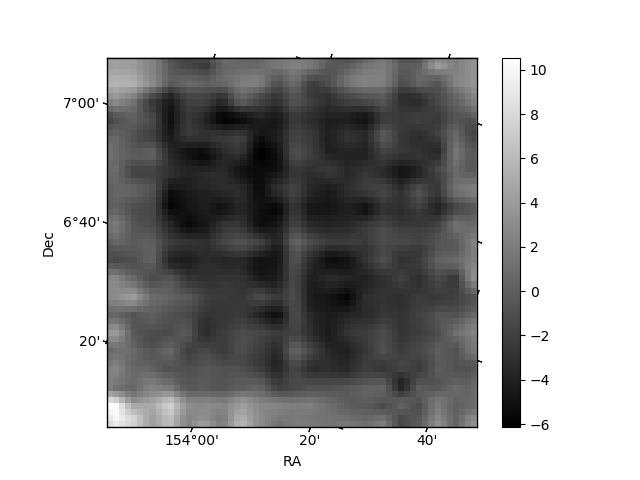
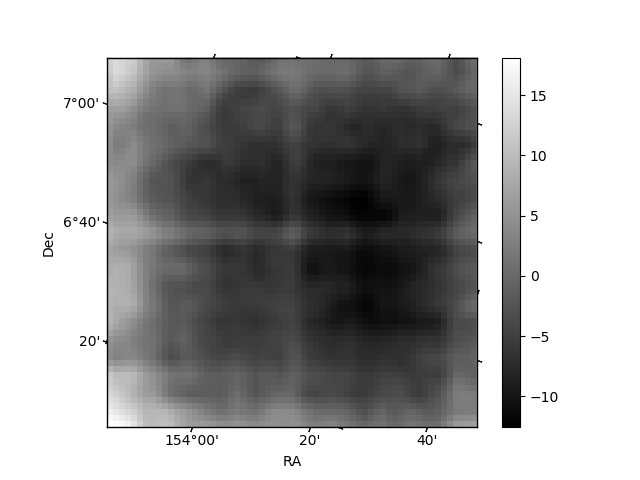
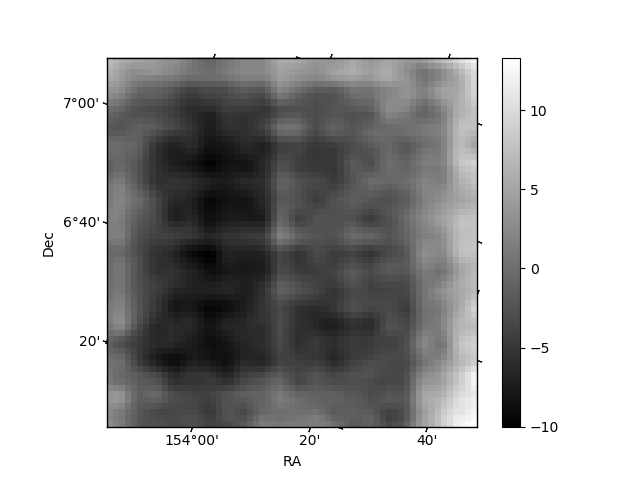
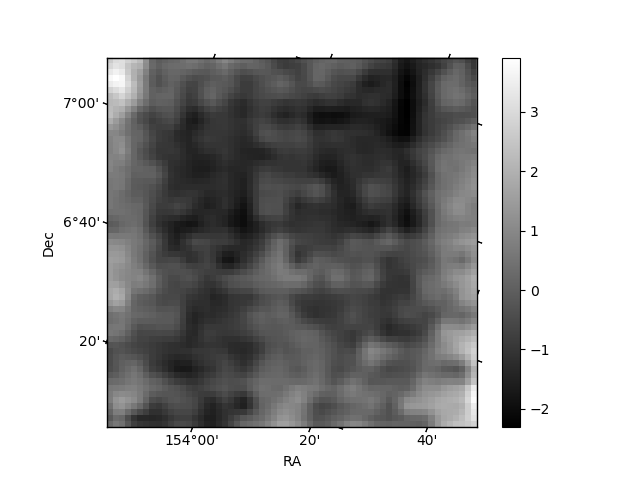
Histogram calculated using DETX and DETY for each event in the final _common_clean file
| Quadrant A | 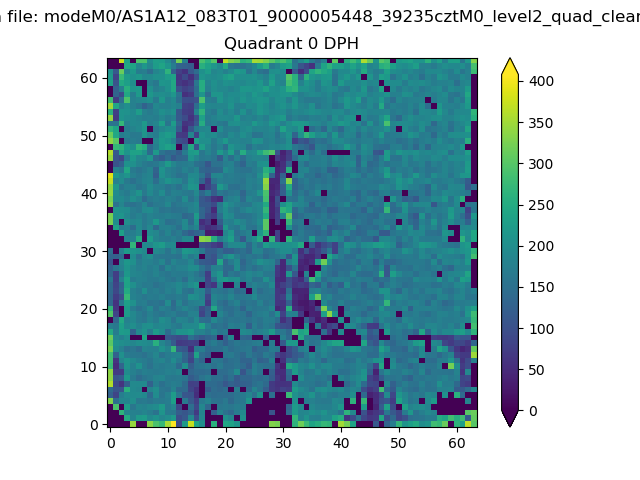 |
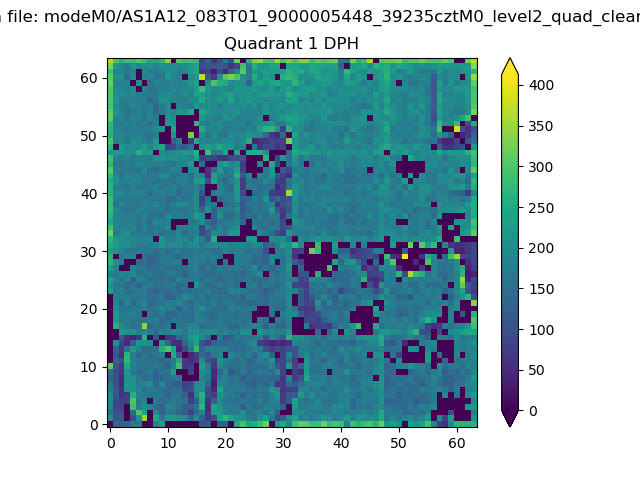 |
Quadrant B |
|---|---|---|---|
| Quadrant D | 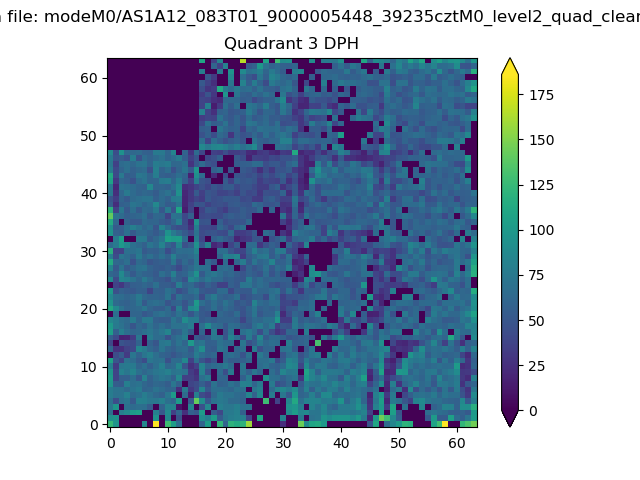 |
 |
Quadrant C |
| Plot type | Count rate plots | Images |
|---|---|---|
| Comparison with Poisson distribution Blue bars denote a histogram of data divided into 1 sec bins. Red curve is a Poisson curve with rate = median count rate of data. |
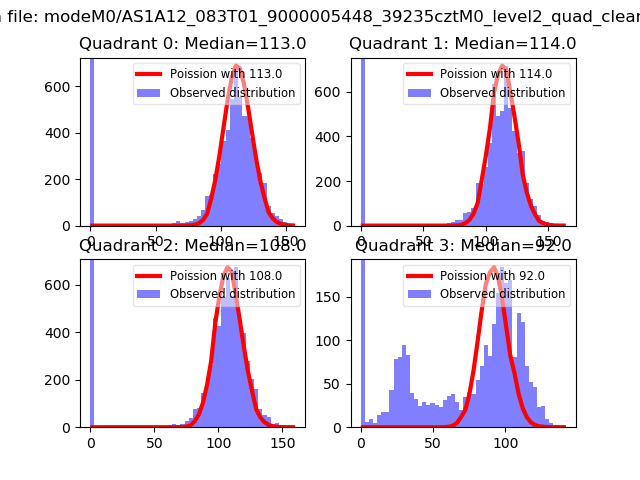 |
 |
| Quadrant-wise count rates Data is divided into 100 sec bins |
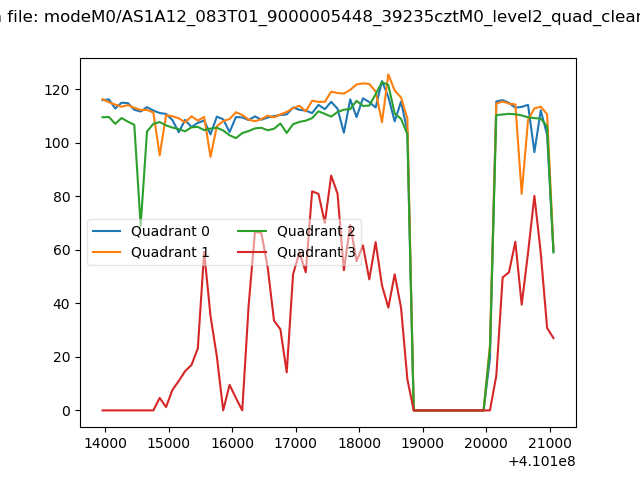 |
|
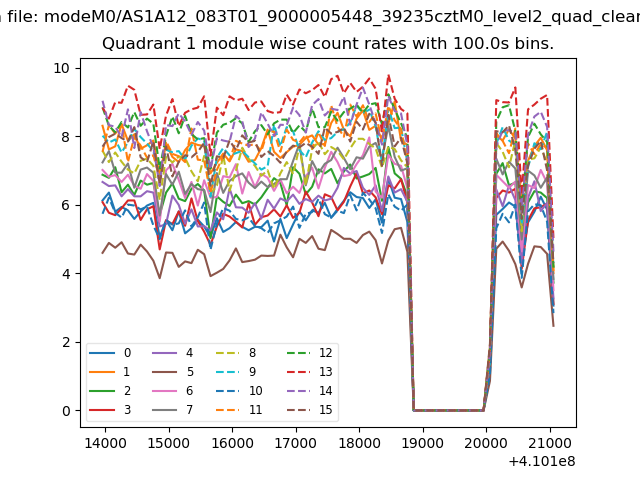
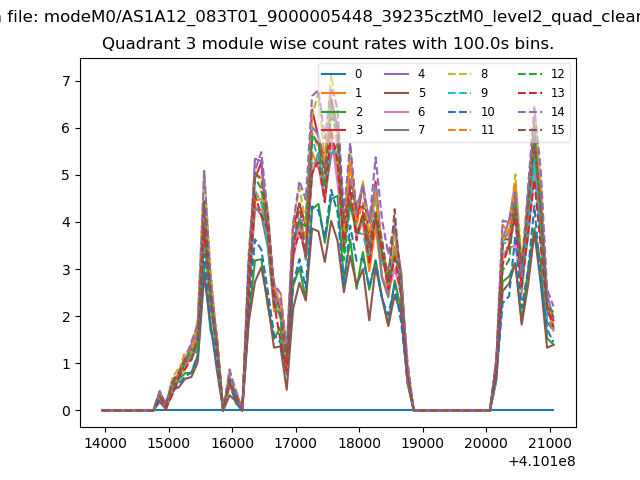
| Module-wise count rates for Quadrant A Data is divided into 100 sec bins |
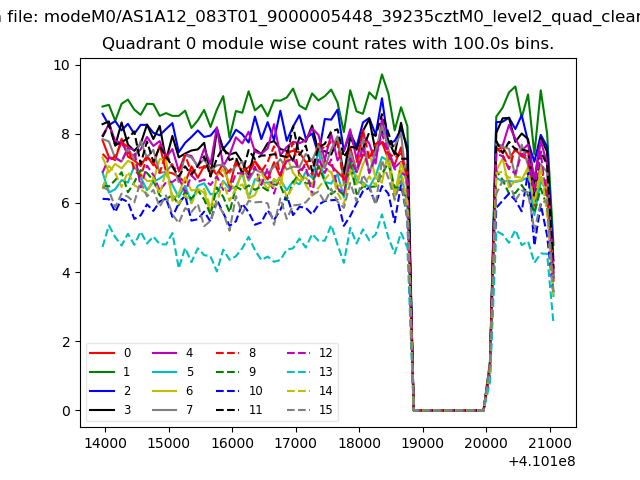 |
 |
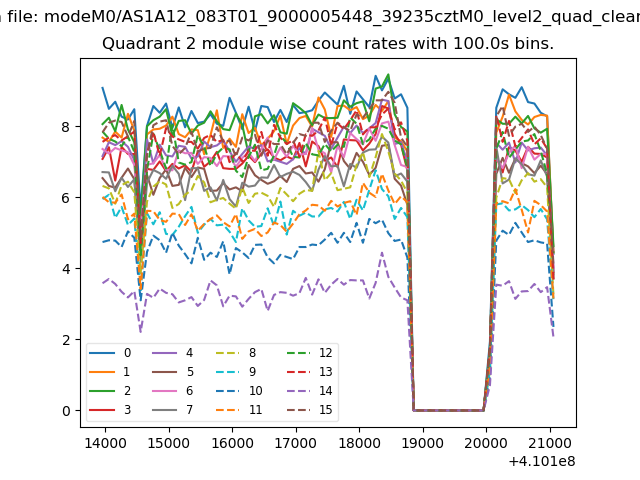
| Module-wise count rates for Quadrant B Data is divided into 100 sec bins |
 |
 |
| Module-wise count rates for Quadrant C Data is divided into 100 sec bins |
 |
 |
| Module-wise count rates for Quadrant D Data is divided into 100 sec bins |
 |
 |
| Parameter | Plot |
|---|---|
| CZT HV Monitor |  |
| D_VDD | 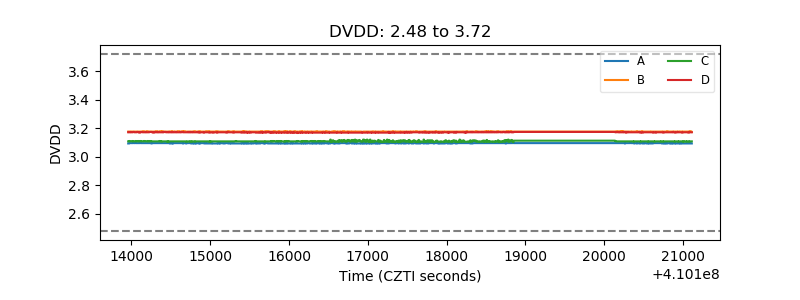 |
| Temperature 1 | 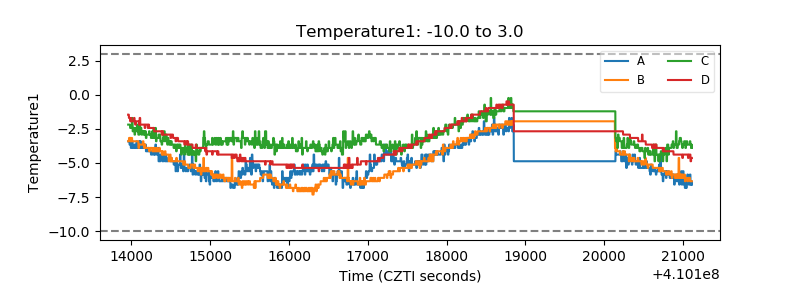 |
| Veto HV Monitor | 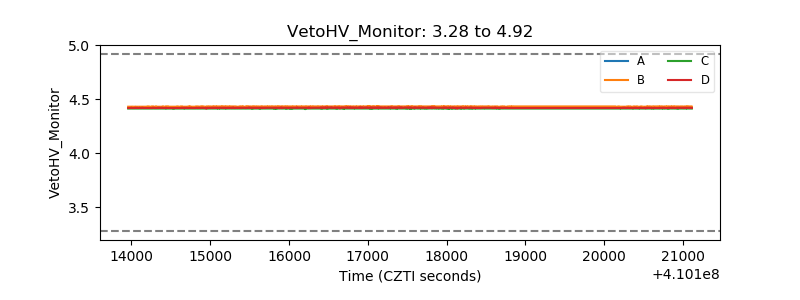 |
| Veto LLD | 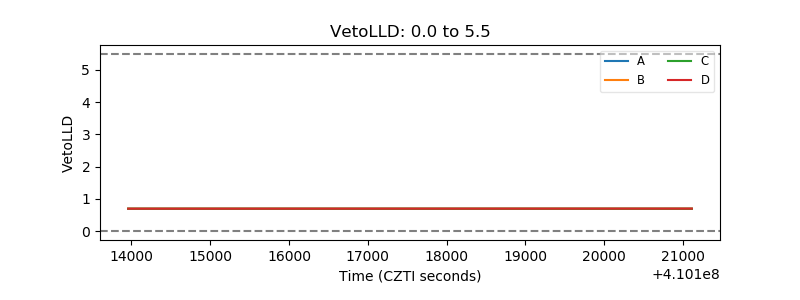 |
| Alpha Counter | 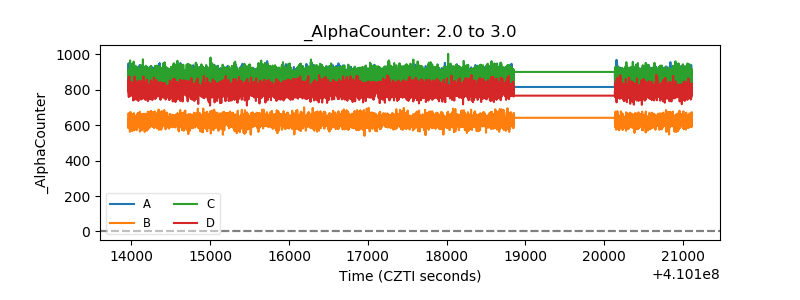 |
| _CPM_Rate | 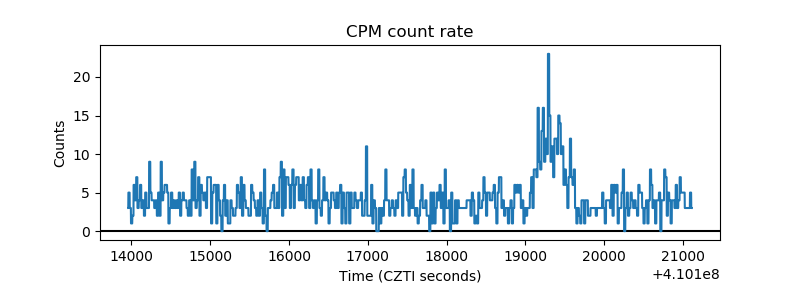 |
| CZT Counter | 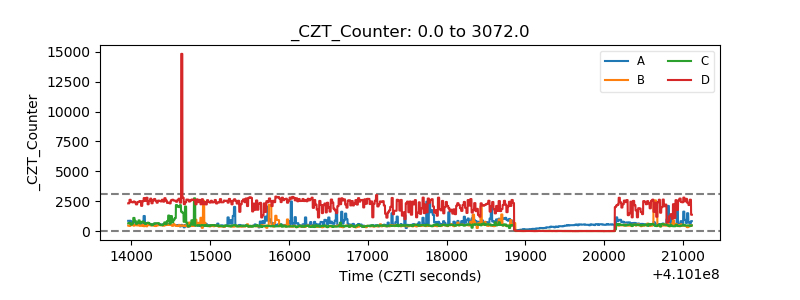 |
| +2.5 Volts monitor | 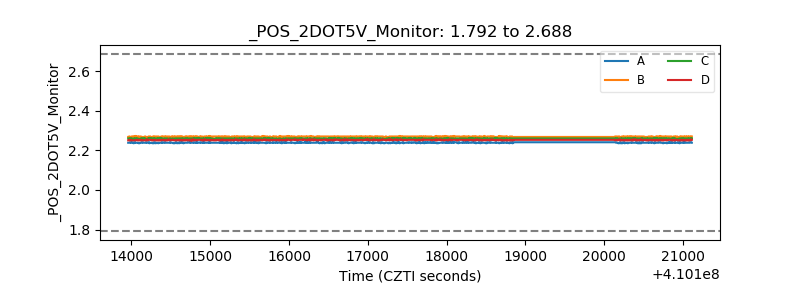 |
| +5 Volts monitor | 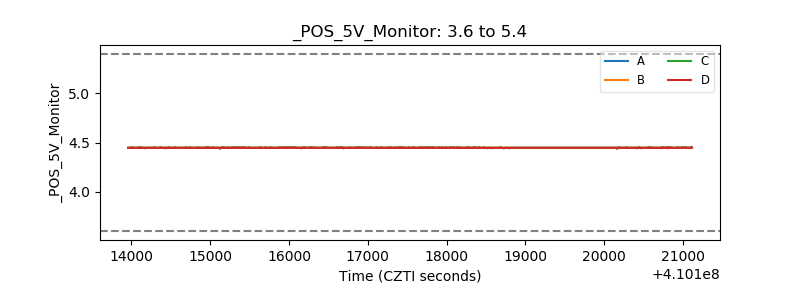 |
| _ROLL_ROT | 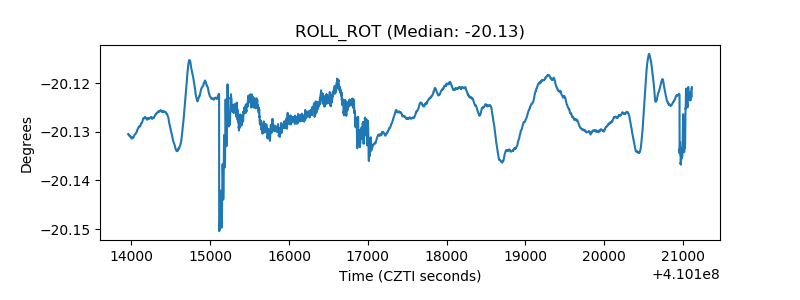 |
| _Roll_DEC | 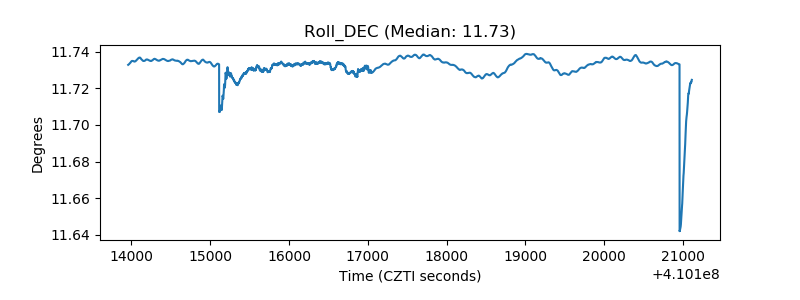 |
| _Roll_RA | 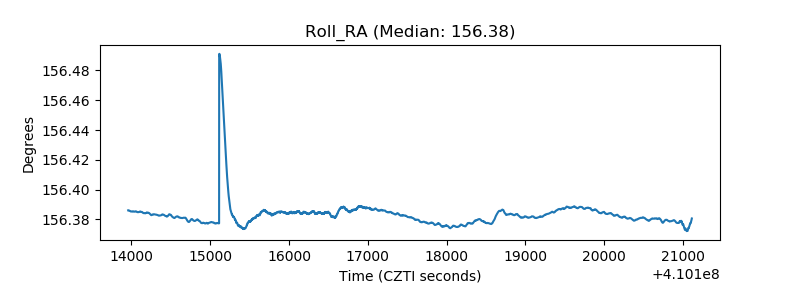 |
| Veto Counter | 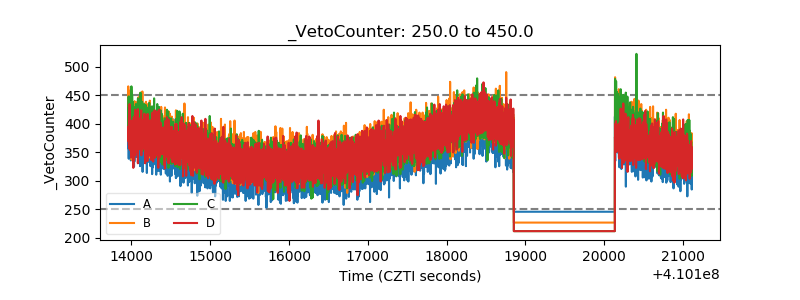 |