| Param | Original file | Final file |
|---|---|---|
| Filename | modeM0/AS1A12_083T01_9000005448_39238cztM0_level2.fits | modeM0/AS1A12_083T01_9000005448_39238cztM0_level2_quad_clean.evt |
| Size (bytes) | 1,077,252,480 | 169,804,800 |
| Size | 1.0 GB | 161.9 MB |
| Events in quadrant A | 8,471,879 | 1,208,459 |
| Events in quadrant B | 5,921,037 | 1,247,244 |
| Events in quadrant C | 5,448,326 | 1,222,629 |
| Events in quadrant D | 19,162,873 | 682,403 |
| Mode M0 | |||
|---|---|---|---|
| Quadrant | BADHDUFLAG | Total packets | Discarded packets |
| A | 0 | 32618 | 22 |
| B | 0 | 25264 | 3 |
| C | 0 | 23413 | 3 |
| D | 0 | 64702 | 3 |
| Mode M9 | |||
|---|---|---|---|
| Quadrant | BADHDUFLAG | Total packets | Discarded packets |
| A | 0 | 40 | 0 |
| B | 0 | 40 | 0 |
| C | 0 | 40 | 0 |
| D | 0 | 40 | 0 |
| Mode SS | |||
|---|---|---|---|
| Quadrant | BADHDUFLAG | Total packets | Discarded packets |
| A | 0 | 232 | 0 |
| B | 0 | 232 | 0 |
| C | 0 | 232 | 0 |
| D | 0 | 232 | 0 |
| Quadrant | Total seconds | Saturated seconds | Saturation percentage |
|---|---|---|---|
| A | 11265 | 628 | 5.574789% |
| B | 11270 | 253 | 2.244898% |
| C | 11270 | 10 | 0.088731% |
| D | 11270 | 5215 | 46.273292% |
Noise dominated data is calculated using 1-second bins in cleaned event files. If a bin has >2000 counts, and if more than 50% of those come from <1% of pixels, then it is considered to be noise-dominated and hence unusable.
| Quadrant | # 1 sec bins | Bins with >0 counts | Bins with >2000 counts | High rate bins dominated by noise | Noise dominated (total time) | Noise dominated (detector-on time) | Marked lightcurve |
|---|---|---|---|---|---|---|---|
| A | 15269 | 11271 | 462 | 462 | 3.03% | 4.10% | 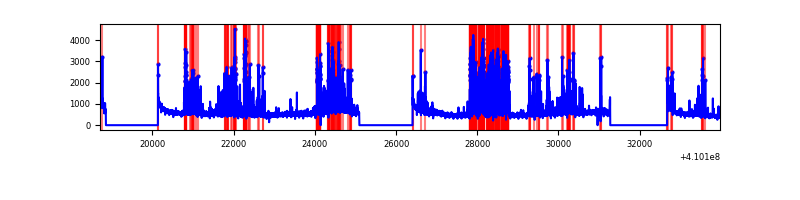 |
| B | 15269 | 11273 | 139 | 139 | 0.91% | 1.23% | 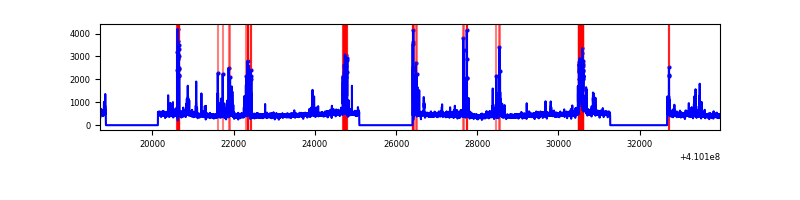 |
| C | 15269 | 11273 | 3 | 3 | 0.02% | 0.03% | 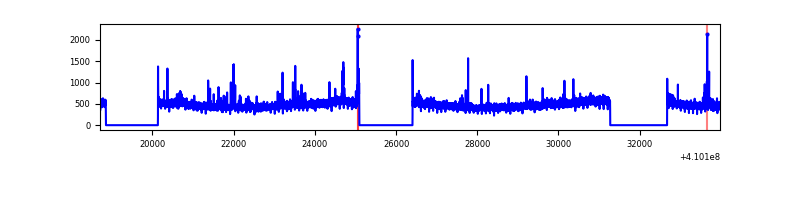 |
| D | 15269 | 11270 | 4281 | 4281 | 28.04% | 37.99% | 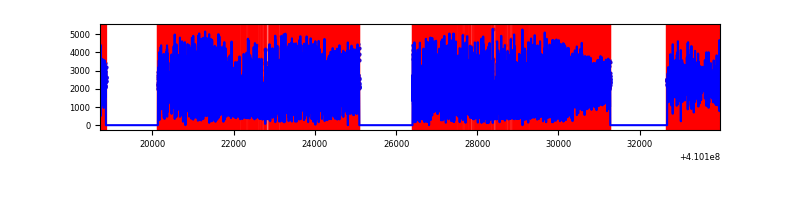 |
Top three noisy pixels from each quadrant. If the there are fewer than three noisy pixels in the level2.evt file, extra rows are filled as -1
| Pixel properties | Quadrant properties | ||||||
|---|---|---|---|---|---|---|---|
| Quadrant | DetID | PixID | Counts | Sigma | Mean | Median | Sigma |
| A | 13 | 248 | 2448689 | 9767.04 | 1234 | 1212 | 250.6 |
| A | 10 | 83 | 785738 | 3130.78 | 1234 | 1212 | 250.6 |
| A | 3 | 80 | 289704 | 1151.27 | 1234 | 1212 | 250.6 |
| B | 5 | 172 | 909047 | 3797.17 | 1232 | 1198 | 239.1 |
| B | 0 | 190 | 111578 | 461.68 | 1232 | 1198 | 239.1 |
| B | 0 | 230 | 33890 | 136.74 | 1232 | 1198 | 239.1 |
| C | 15 | 214 | 467392 | 1641.44 | 1220 | 1229 | 284.0 |
| C | 14 | 254 | 129289 | 450.92 | 1220 | 1229 | 284.0 |
| C | 9 | 187 | 41915 | 143.26 | 1220 | 1229 | 284.0 |
| D | 12 | 235 | 13540807 | 56325.68 | 971 | 947 | 240.4 |
| D | 12 | 227 | 854548 | 3550.97 | 971 | 947 | 240.4 |
| D | 5 | 222 | 582467 | 2419.12 | 971 | 947 | 240.4 |
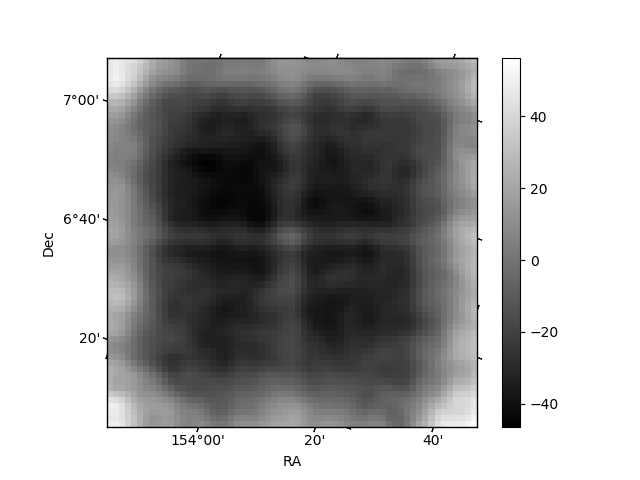
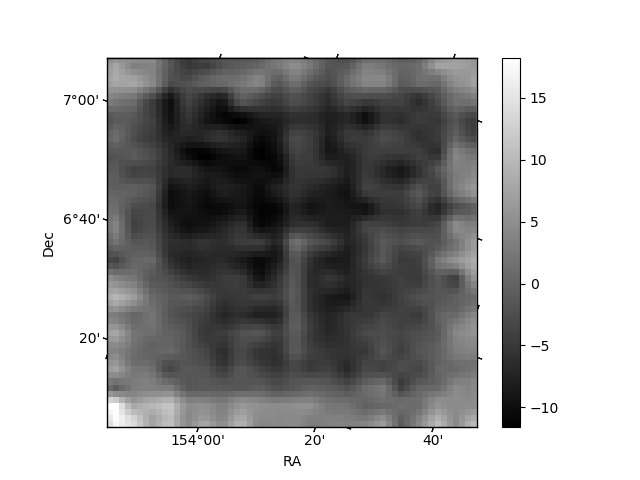
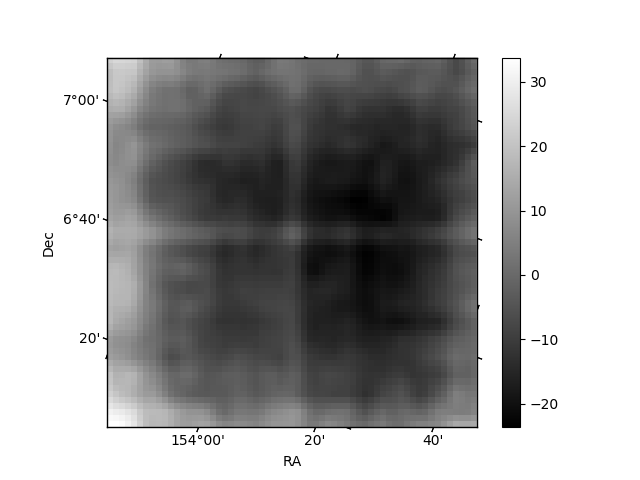
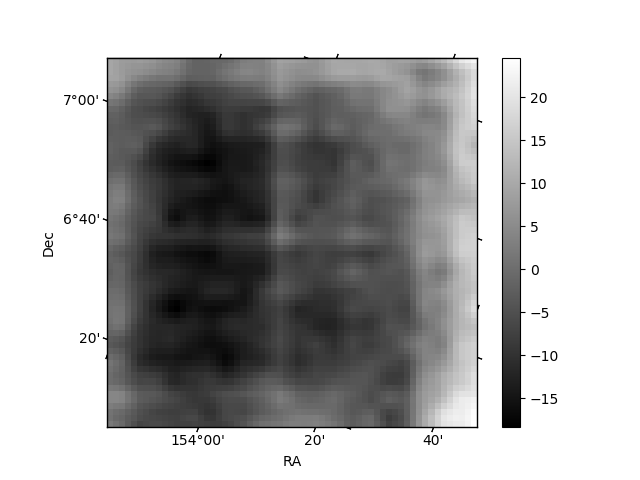
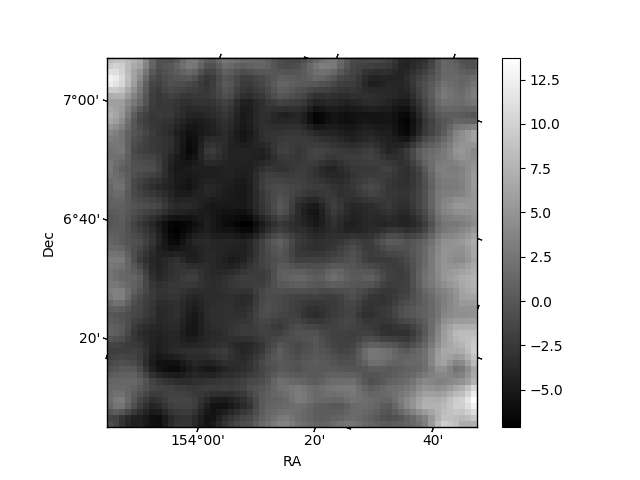
Histogram calculated using DETX and DETY for each event in the final _common_clean file
| Quadrant A | 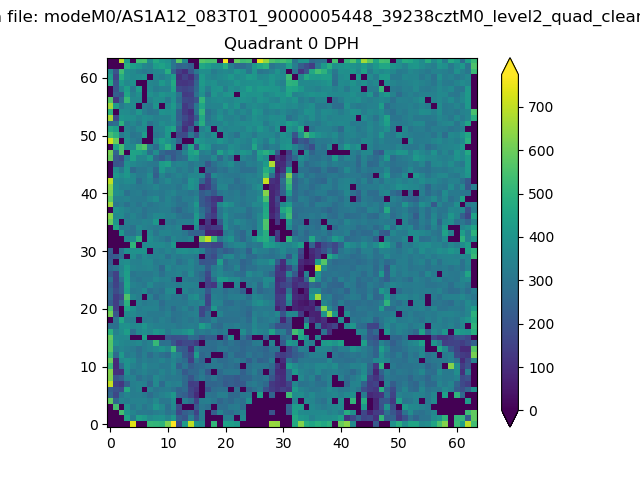 |
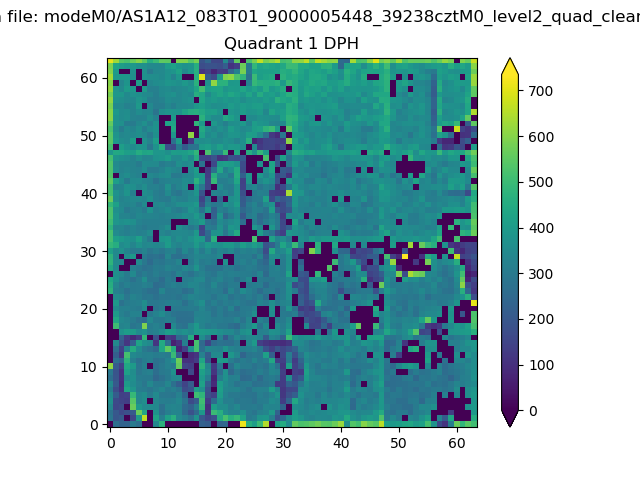 |
Quadrant B |
|---|---|---|---|
| Quadrant D | 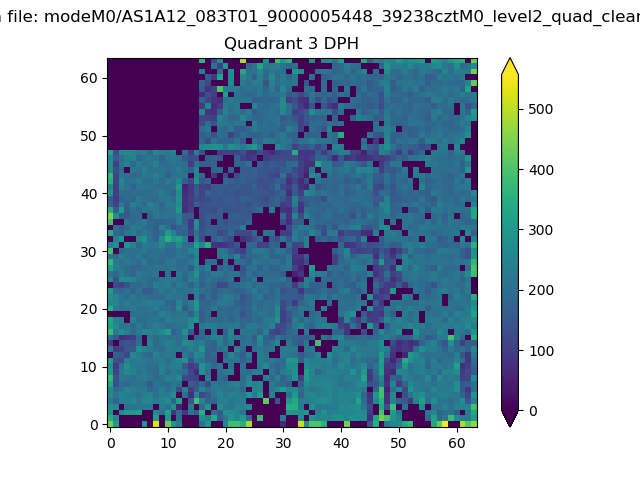 |
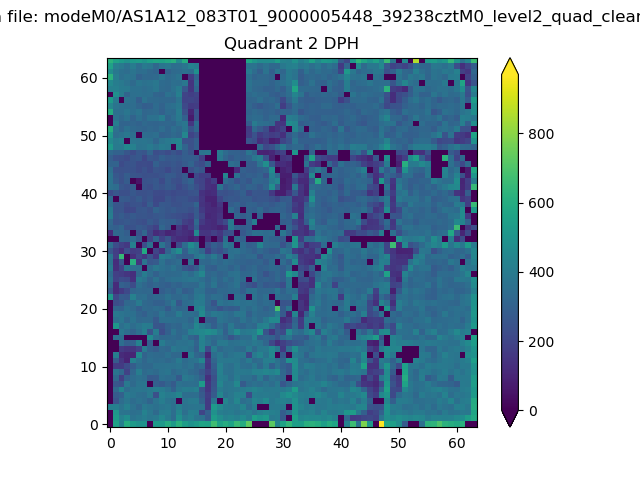 |
Quadrant C |
| Plot type | Count rate plots | Images |
|---|---|---|
| Comparison with Poisson distribution Blue bars denote a histogram of data divided into 1 sec bins. Red curve is a Poisson curve with rate = median count rate of data. |
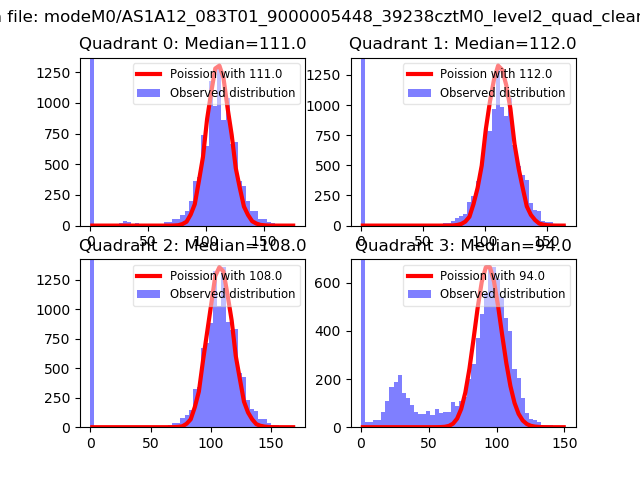 |
 |
| Quadrant-wise count rates Data is divided into 100 sec bins |
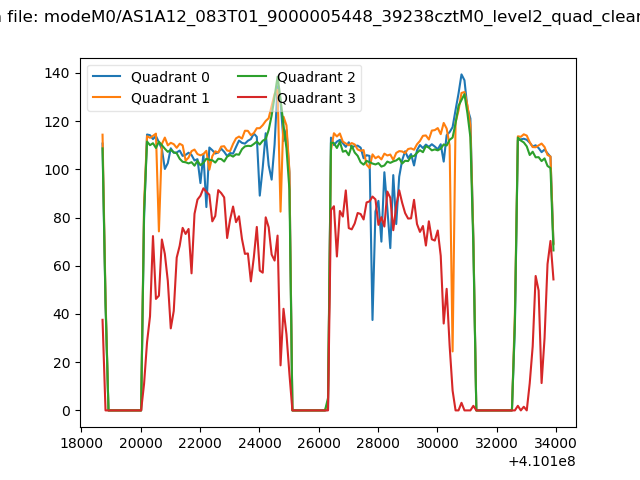 |
|
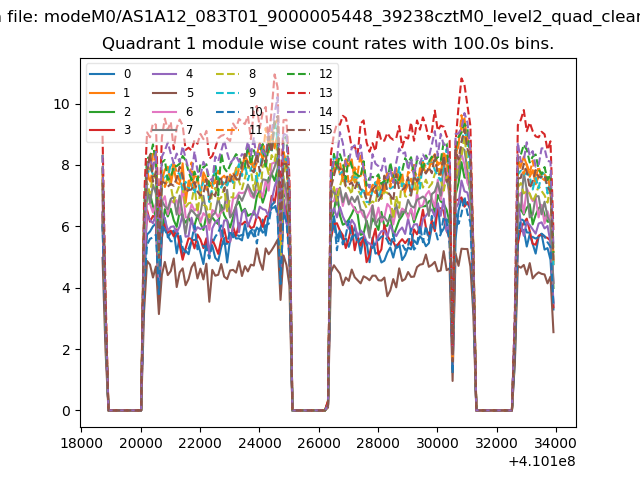
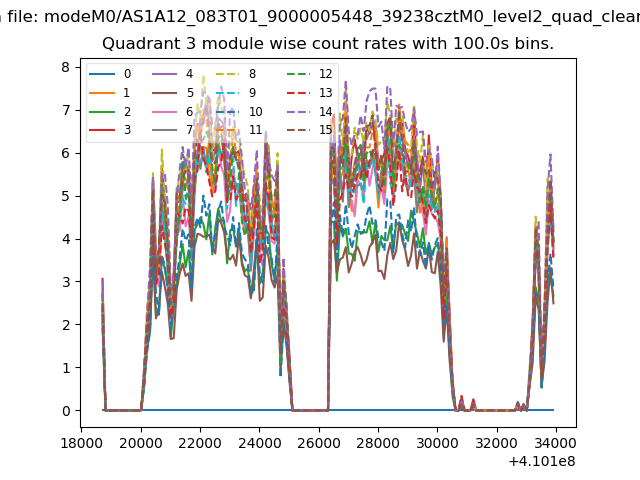
| Module-wise count rates for Quadrant A Data is divided into 100 sec bins |
 |
 |
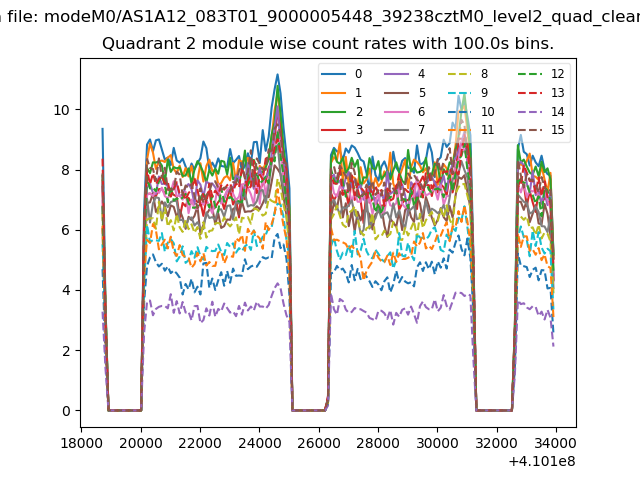
| Module-wise count rates for Quadrant B Data is divided into 100 sec bins |
 |
 |
| Module-wise count rates for Quadrant C Data is divided into 100 sec bins |
 |
 |
| Module-wise count rates for Quadrant D Data is divided into 100 sec bins |
 |
 |
| Parameter | Plot |
|---|---|
| CZT HV Monitor | 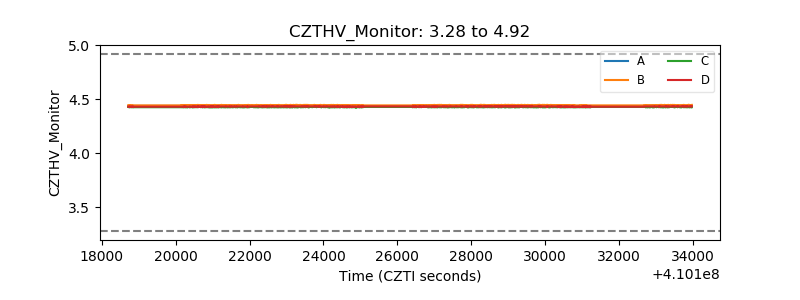 |
| D_VDD | 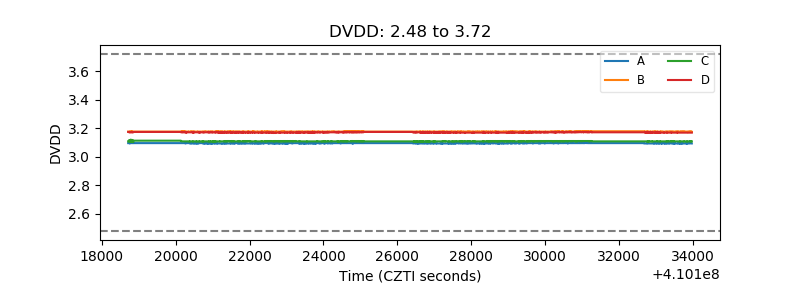 |
| Temperature 1 | 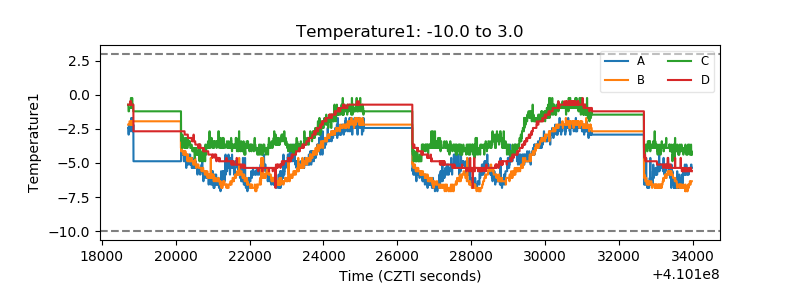 |
| Veto HV Monitor | 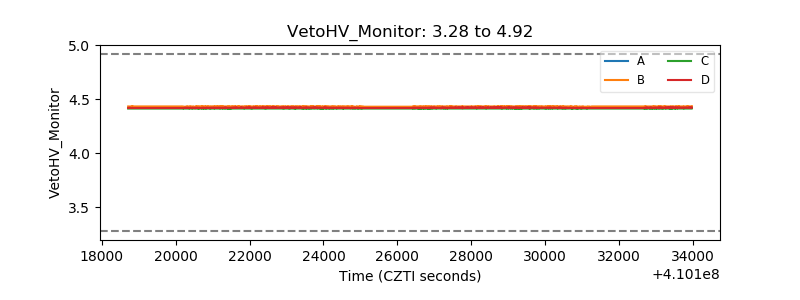 |
| Veto LLD | 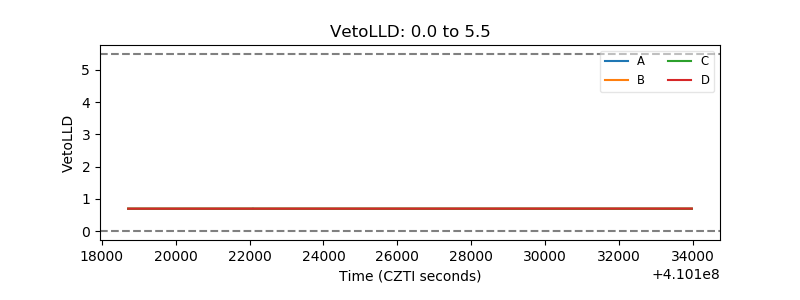 |
| Alpha Counter | 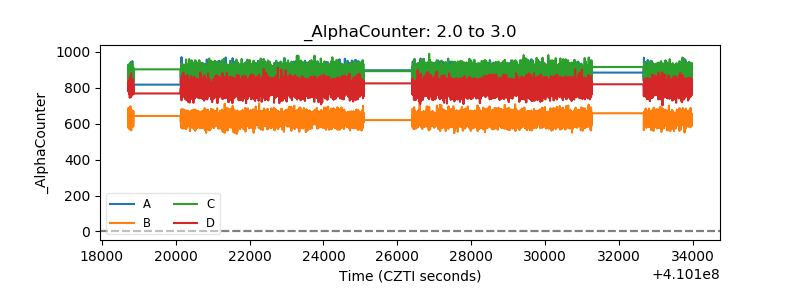 |
| _CPM_Rate | 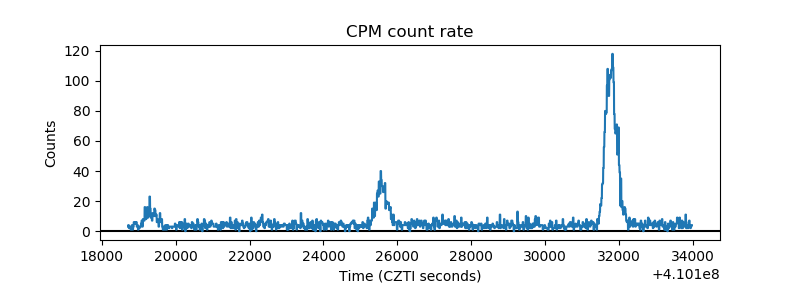 |
| CZT Counter | 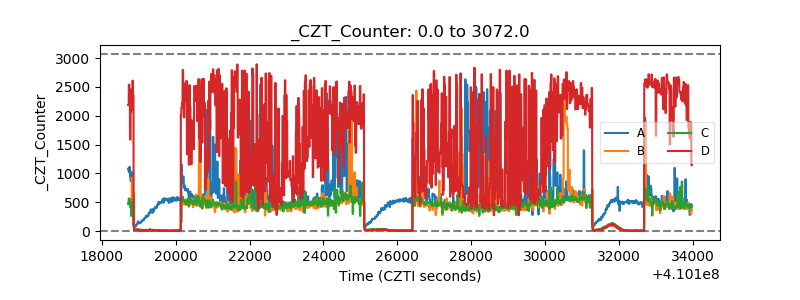 |
| +2.5 Volts monitor | 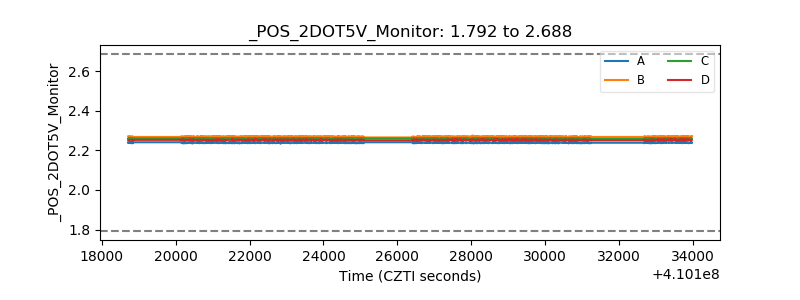 |
| +5 Volts monitor | 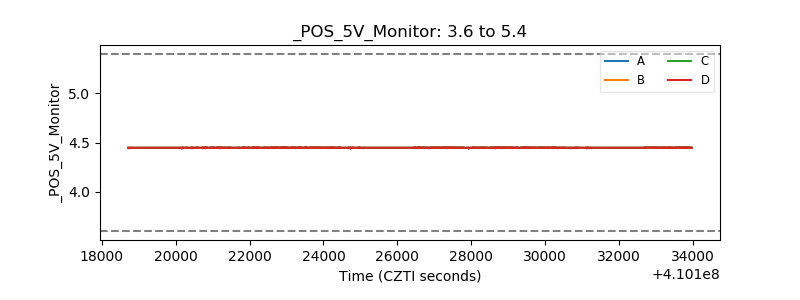 |
| _ROLL_ROT | 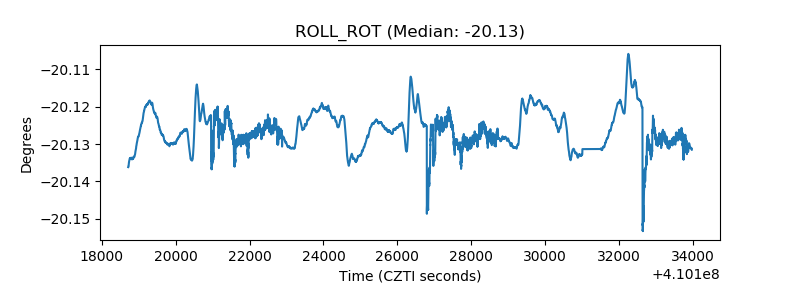 |
| _Roll_DEC | 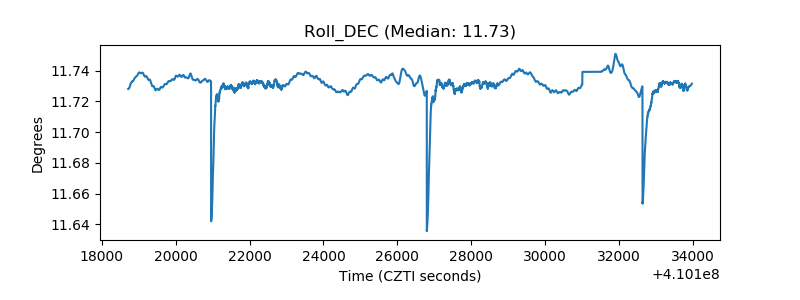 |
| _Roll_RA | 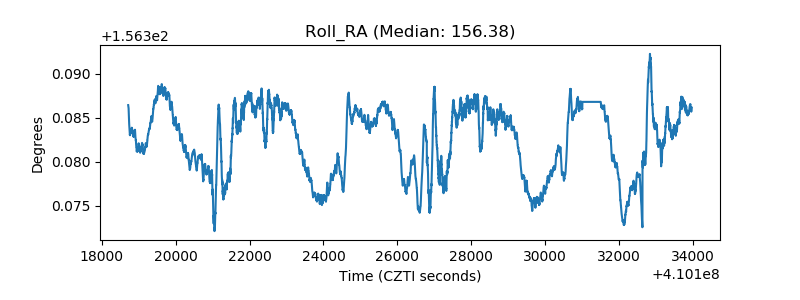 |
| Veto Counter | 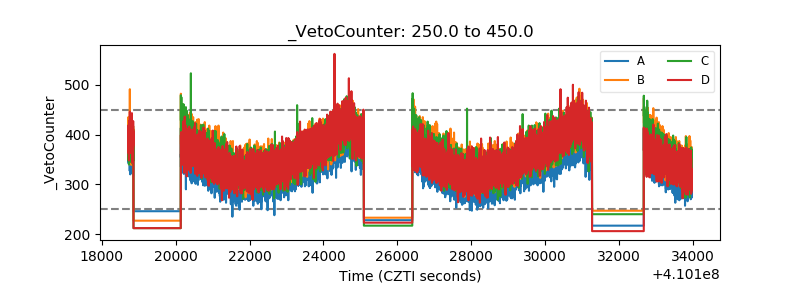 |