| Param | Original file | Final file |
|---|---|---|
| Filename | modeM0/AS1A12_083T01_9000005448_39242cztM0_level2.fits | modeM0/AS1A12_083T01_9000005448_39242cztM0_level2_quad_clean.evt |
| Size (bytes) | 1,365,310,080 | 210,009,600 |
| Size | 1.3 GB | 200.3 MB |
| Events in quadrant A | 10,463,693 | 1,503,612 |
| Events in quadrant B | 7,225,975 | 1,561,248 |
| Events in quadrant C | 6,740,280 | 1,509,434 |
| Events in quadrant D | 25,024,405 | 814,720 |
| Mode M0 | |||
|---|---|---|---|
| Quadrant | BADHDUFLAG | Total packets | Discarded packets |
| A | 0 | 40319 | 3 |
| B | 0 | 31070 | 3 |
| C | 0 | 28994 | 3 |
| D | 0 | 83999 | 3 |
| Mode M9 | |||
|---|---|---|---|
| Quadrant | BADHDUFLAG | Total packets | Discarded packets |
| A | 0 | 40 | 0 |
| B | 0 | 40 | 0 |
| C | 0 | 40 | 0 |
| D | 0 | 40 | 0 |
| Mode SS | |||
|---|---|---|---|
| Quadrant | BADHDUFLAG | Total packets | Discarded packets |
| A | 0 | 286 | 0 |
| B | 0 | 286 | 0 |
| C | 0 | 286 | 0 |
| D | 0 | 286 | 0 |
| Quadrant | Total seconds | Saturated seconds | Saturation percentage |
|---|---|---|---|
| A | 14030 | 719 | 5.124733% |
| B | 14030 | 278 | 1.981468% |
| C | 14030 | 12 | 0.085531% |
| D | 14030 | 6911 | 49.258731% |
Noise dominated data is calculated using 1-second bins in cleaned event files. If a bin has >2000 counts, and if more than 50% of those come from <1% of pixels, then it is considered to be noise-dominated and hence unusable.
| Quadrant | # 1 sec bins | Bins with >0 counts | Bins with >2000 counts | High rate bins dominated by noise | Noise dominated (total time) | Noise dominated (detector-on time) | Marked lightcurve |
|---|---|---|---|---|---|---|---|
| A | 18029 | 14033 | 533 | 533 | 2.96% | 3.80% | 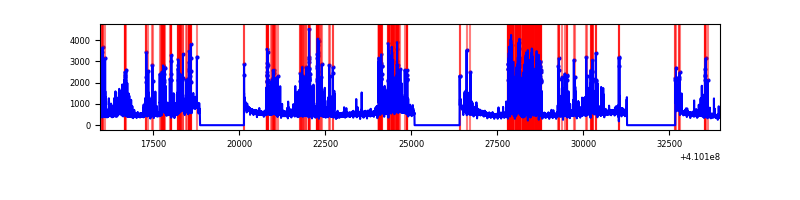 |
| B | 18029 | 14033 | 151 | 151 | 0.84% | 1.08% | 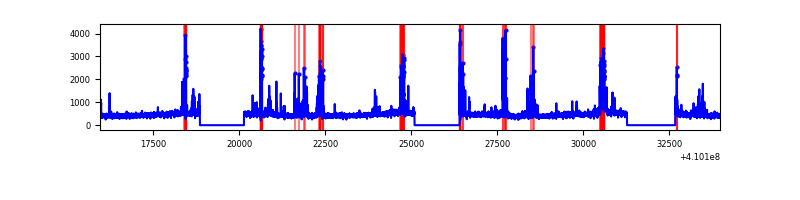 |
| C | 18029 | 14033 | 3 | 3 | 0.02% | 0.02% | 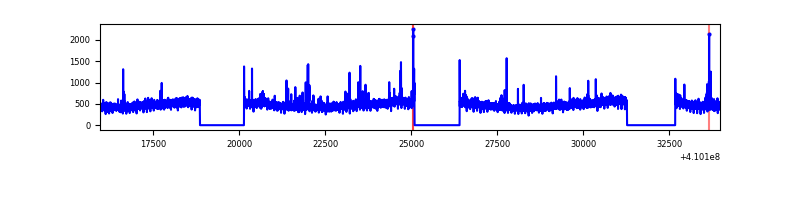 |
| D | 18029 | 14029 | 5758 | 5758 | 31.94% | 41.04% | 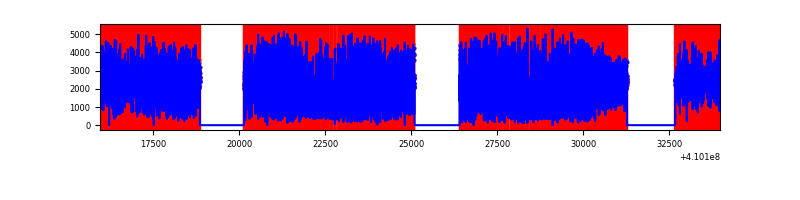 |
Top three noisy pixels from each quadrant. If the there are fewer than three noisy pixels in the level2.evt file, extra rows are filled as -1
| Pixel properties | Quadrant properties | ||||||
|---|---|---|---|---|---|---|---|
| Quadrant | DetID | PixID | Counts | Sigma | Mean | Median | Sigma |
| A | 13 | 248 | 2868460 | 9187.13 | 1540 | 1513 | 312.1 |
| A | 10 | 83 | 913242 | 2921.64 | 1540 | 1513 | 312.1 |
| A | 3 | 80 | 502019 | 1603.87 | 1540 | 1513 | 312.1 |
| B | 5 | 172 | 989544 | 3316.57 | 1536 | 1494 | 297.9 |
| B | 0 | 190 | 126744 | 420.42 | 1536 | 1494 | 297.9 |
| B | 0 | 230 | 44966 | 145.92 | 1536 | 1494 | 297.9 |
| C | 15 | 214 | 578051 | 1629.29 | 1519 | 1530 | 353.8 |
| C | 14 | 254 | 133312 | 372.43 | 1519 | 1530 | 353.8 |
| C | 9 | 187 | 46249 | 126.38 | 1519 | 1530 | 353.8 |
| D | 12 | 235 | 17945876 | 59978.98 | 1206 | 1175 | 299.2 |
| D | 12 | 227 | 1058395 | 3533.69 | 1206 | 1175 | 299.2 |
| D | 5 | 222 | 583188 | 1945.34 | 1206 | 1175 | 299.2 |
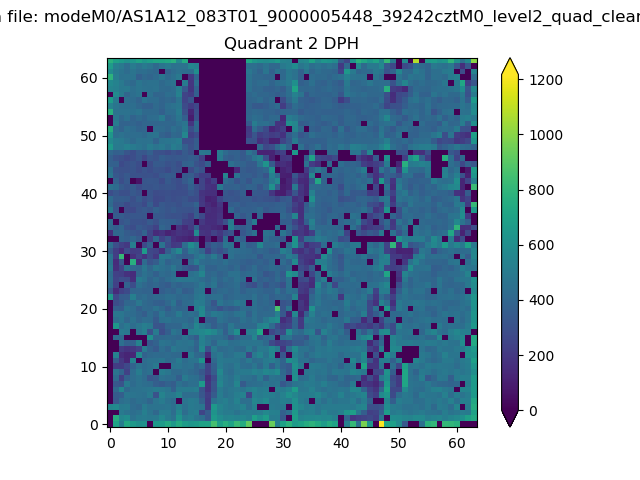
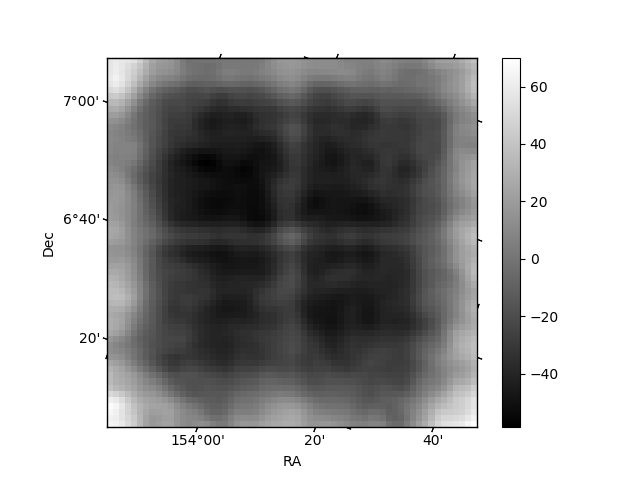
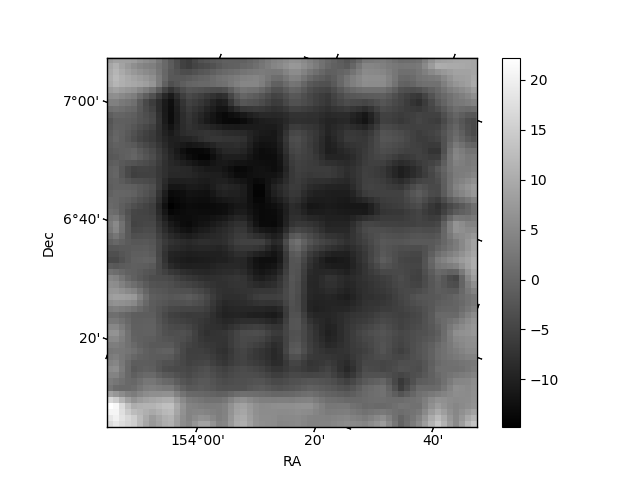
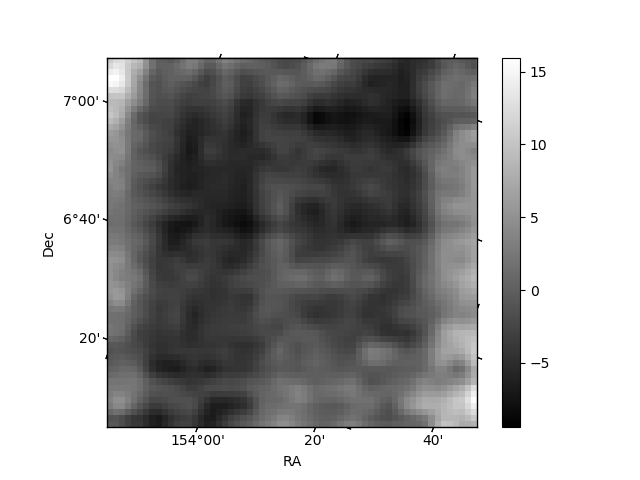
Histogram calculated using DETX and DETY for each event in the final _common_clean file
| Quadrant A | 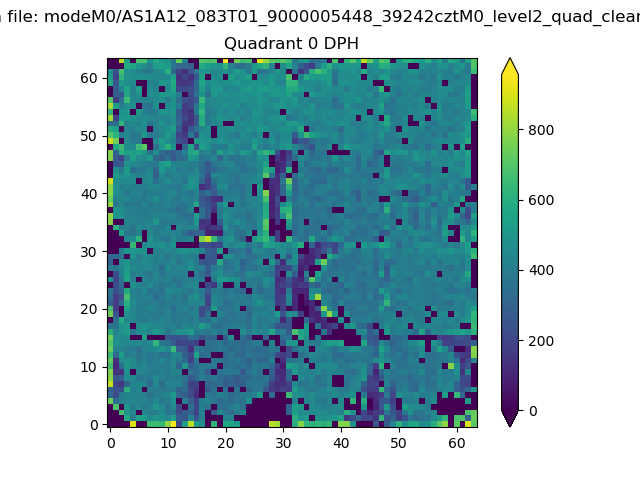 |
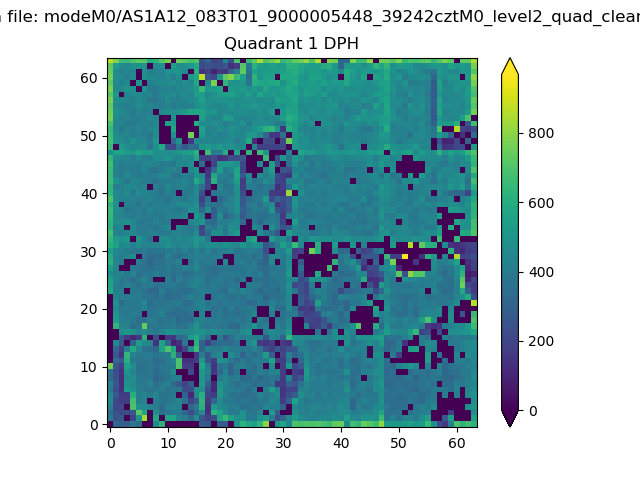 |
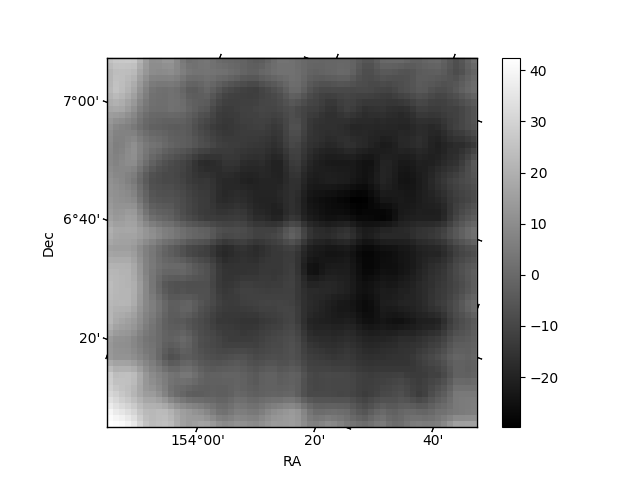
Quadrant B |
|---|---|---|---|
| Quadrant D | 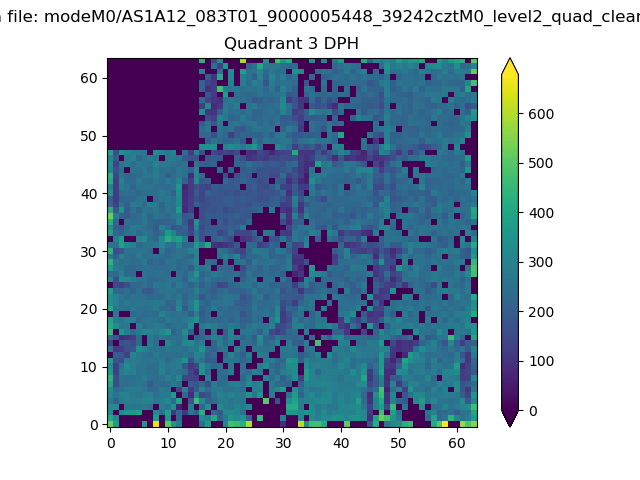 |
 |
Quadrant C |
| Plot type | Count rate plots | Images |
|---|---|---|
| Comparison with Poisson distribution Blue bars denote a histogram of data divided into 1 sec bins. Red curve is a Poisson curve with rate = median count rate of data. |
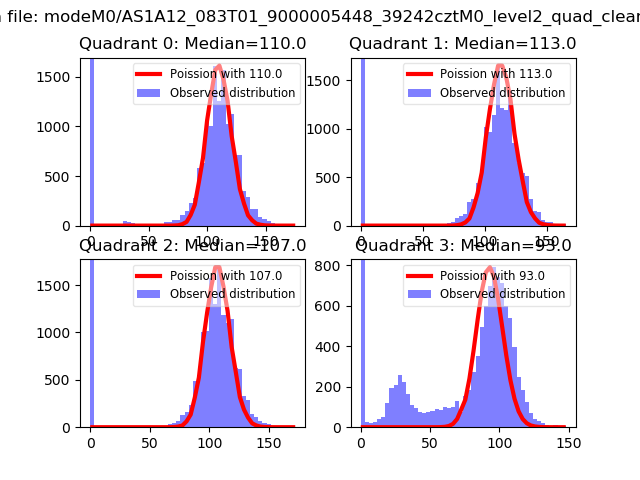 |
 |
| Quadrant-wise count rates Data is divided into 100 sec bins |
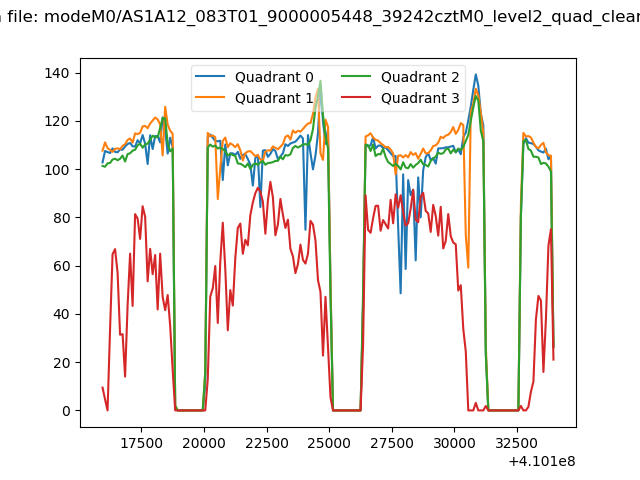 |
|
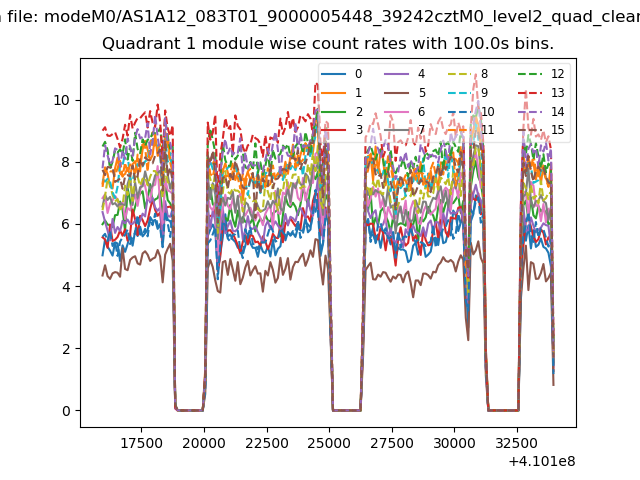
| Module-wise count rates for Quadrant A Data is divided into 100 sec bins |
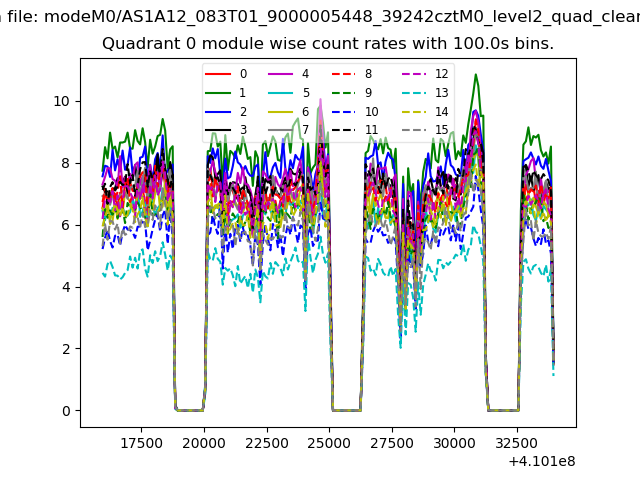 |
 |
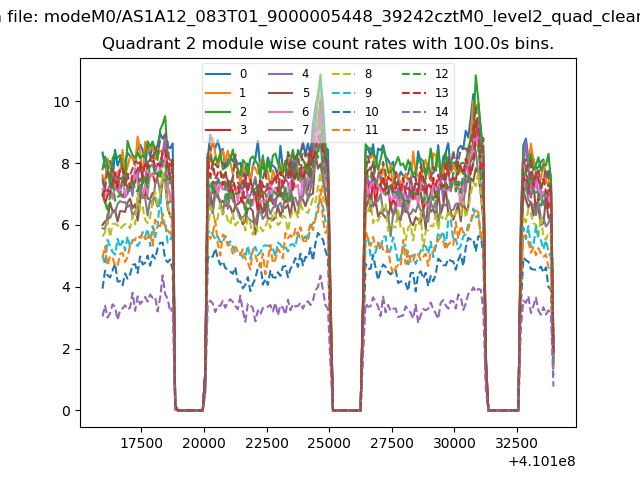
| Module-wise count rates for Quadrant B Data is divided into 100 sec bins |
 |
 |
| Module-wise count rates for Quadrant C Data is divided into 100 sec bins |
 |
 |
| Module-wise count rates for Quadrant D Data is divided into 100 sec bins |
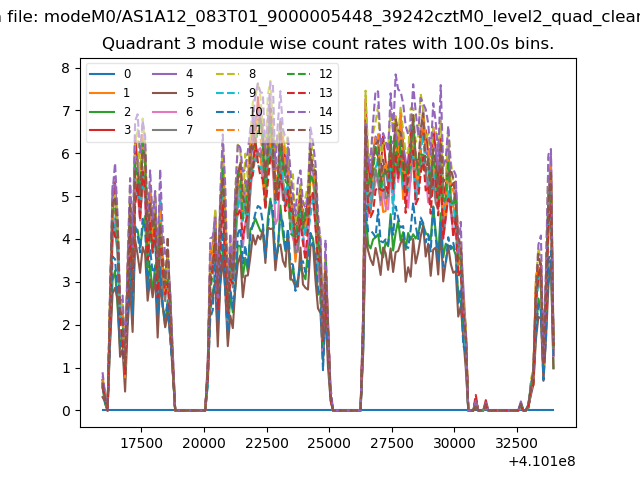 |
 |
| Parameter | Plot |
|---|---|
| CZT HV Monitor | 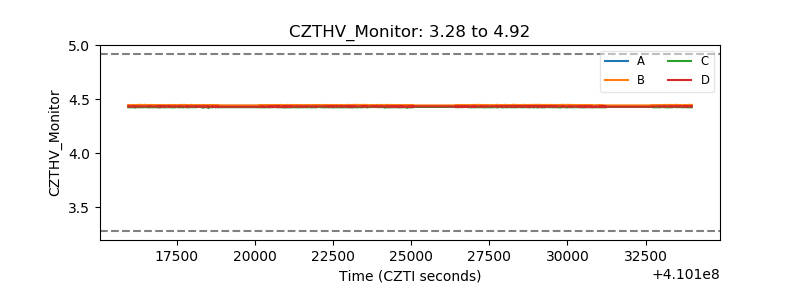 |
| D_VDD | 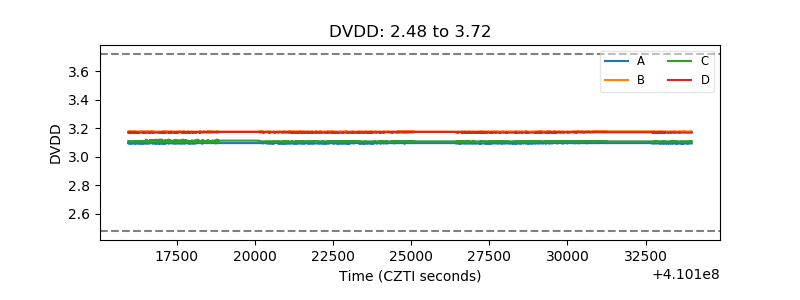 |
| Temperature 1 | 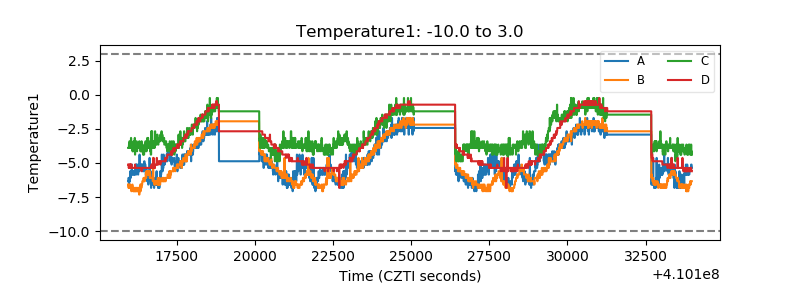 |
| Veto HV Monitor | 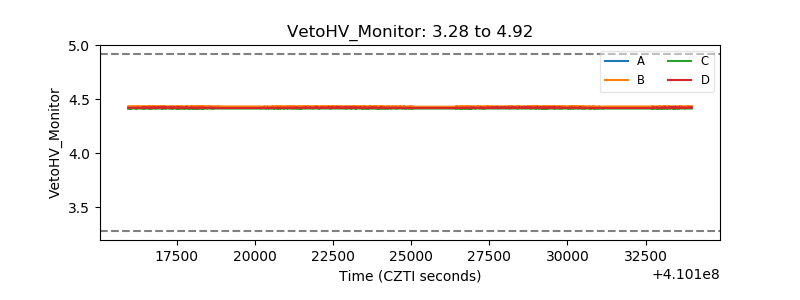 |
| Veto LLD | 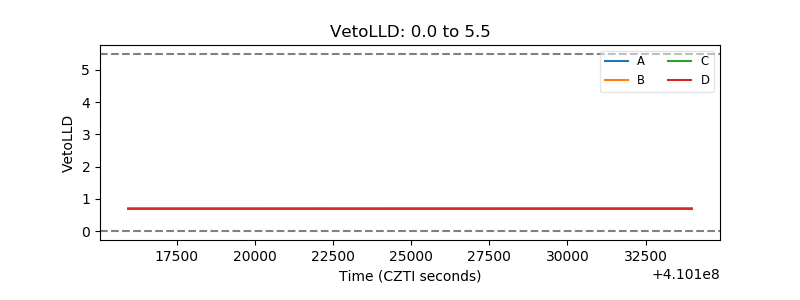 |
| Alpha Counter | 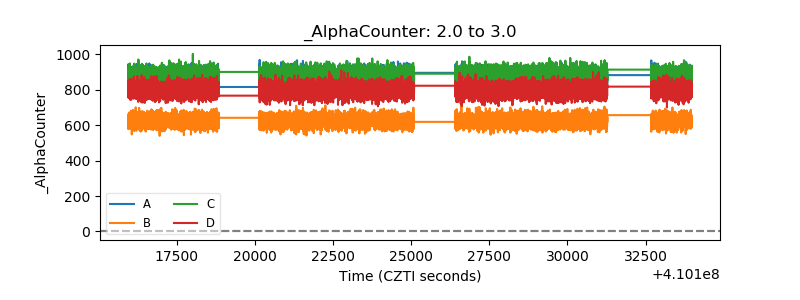 |
| _CPM_Rate | 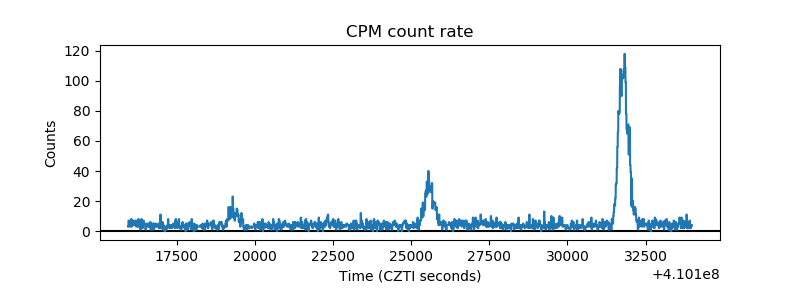 |
| CZT Counter | 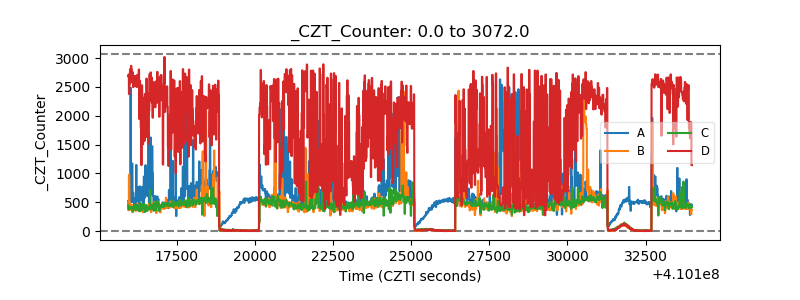 |
| +2.5 Volts monitor | 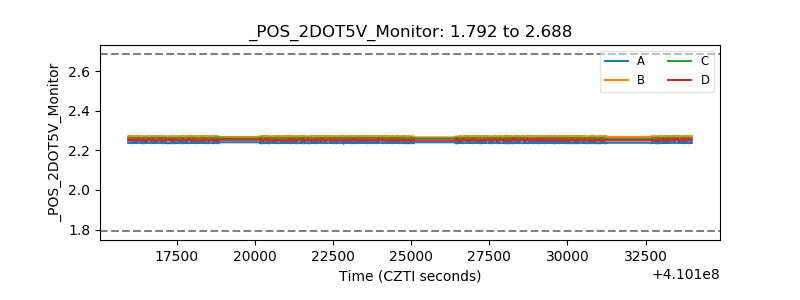 |
| +5 Volts monitor | 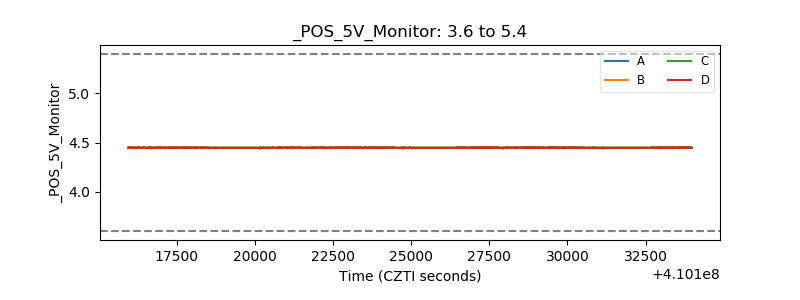 |
| _ROLL_ROT | 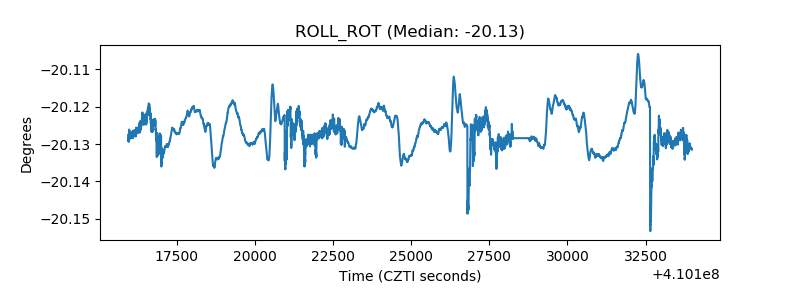 |
| _Roll_DEC | 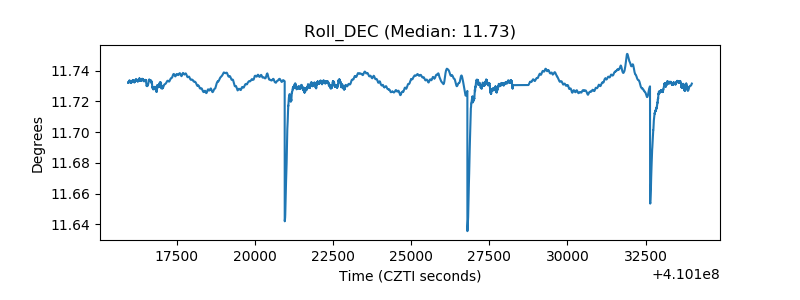 |
| _Roll_RA | 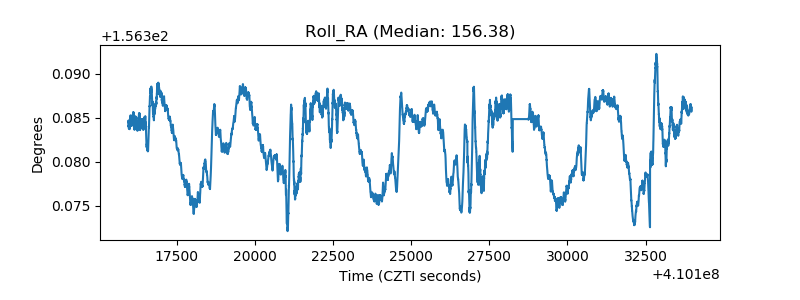 |
| Veto Counter | 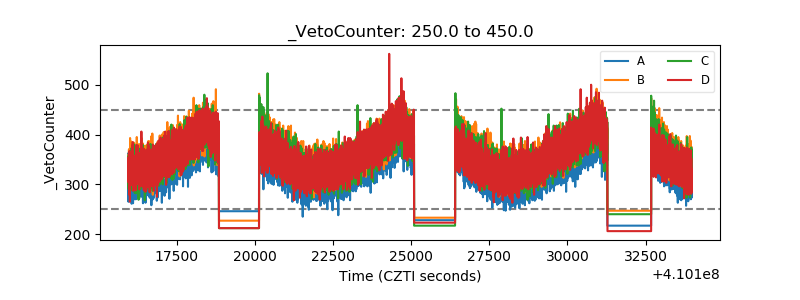 |