| Param | Original file | Final file |
|---|---|---|
| Filename | modeM0/AS1A12_095T01_9000005450_39238cztM0_level2.fits | modeM0/AS1A12_095T01_9000005450_39238cztM0_level2_quad_clean.evt |
| Size (bytes) | 430,508,160 | 57,208,320 |
| Size | 410.6 MB | 54.6 MB |
| Events in quadrant A | 2,911,539 | 421,033 |
| Events in quadrant B | 2,106,656 | 446,926 |
| Events in quadrant C | 1,875,602 | 433,422 |
| Events in quadrant D | 8,733,938 | 151,295 |
| Mode M9 | |||
|---|---|---|---|
| Quadrant | BADHDUFLAG | Total packets | Discarded packets |
| A | 0 | 15 | 0 |
| B | 0 | 15 | 0 |
| C | 0 | 15 | 0 |
| D | 0 | 15 | 0 |
| Mode M0 | |||
|---|---|---|---|
| Quadrant | BADHDUFLAG | Total packets | Discarded packets |
| A | 0 | 11292 | 2 |
| B | 0 | 9003 | 1 |
| C | 0 | 8118 | 1 |
| D | 0 | 28630 | 1 |
| Mode SS | |||
|---|---|---|---|
| Quadrant | BADHDUFLAG | Total packets | Discarded packets |
| A | 0 | 82 | 0 |
| B | 0 | 82 | 0 |
| C | 0 | 82 | 0 |
| D | 0 | 82 | 0 |
| Quadrant | Total seconds | Saturated seconds | Saturation percentage |
|---|---|---|---|
| A | 3955 | 314 | 7.939317% |
| B | 3955 | 95 | 2.402023% |
| C | 3955 | 2 | 0.050569% |
| D | 3955 | 2678 | 67.711757% |
Noise dominated data is calculated using 1-second bins in cleaned event files. If a bin has >2000 counts, and if more than 50% of those come from <1% of pixels, then it is considered to be noise-dominated and hence unusable.
| Quadrant | # 1 sec bins | Bins with >0 counts | Bins with >2000 counts | High rate bins dominated by noise | Noise dominated (total time) | Noise dominated (detector-on time) | Marked lightcurve |
|---|---|---|---|---|---|---|---|
| A | 5478 | 3956 | 203 | 203 | 3.71% | 5.13% | 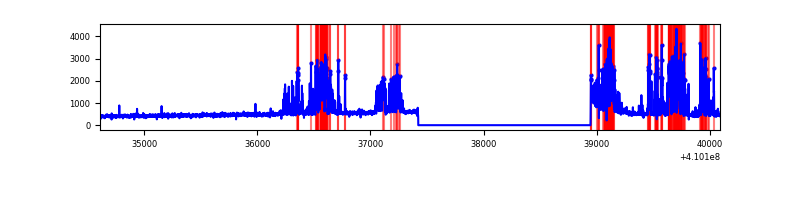 |
| B | 5478 | 3956 | 64 | 64 | 1.17% | 1.62% | 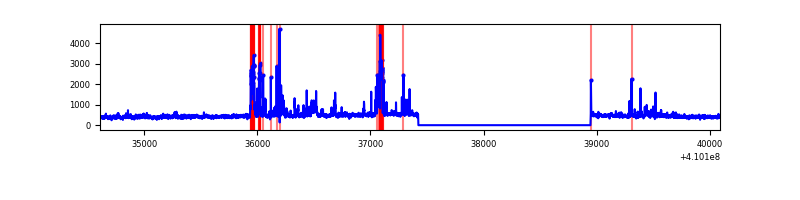 |
| C | 5478 | 3956 | 0 | 0 | 0.00% | 0.00% | 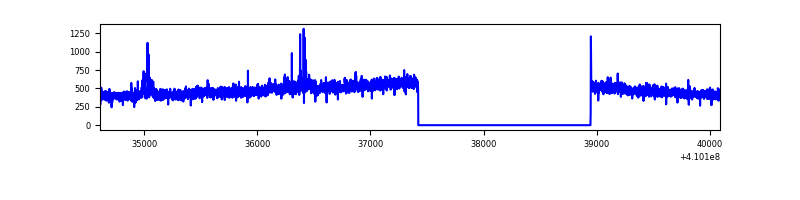 |
| D | 5478 | 3956 | 2678 | 2678 | 48.89% | 67.69% | 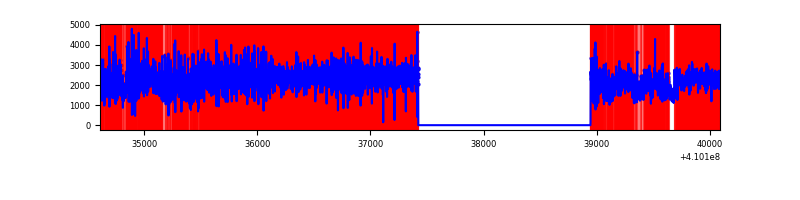 |
Top three noisy pixels from each quadrant. If the there are fewer than three noisy pixels in the level2.evt file, extra rows are filled as -1
| Pixel properties | Quadrant properties | ||||||
|---|---|---|---|---|---|---|---|
| Quadrant | DetID | PixID | Counts | Sigma | Mean | Median | Sigma |
| A | 13 | 248 | 973044 | 11114.83 | 428 | 419 | 87.5 |
| A | 10 | 83 | 267233 | 3049.06 | 428 | 419 | 87.5 |
| A | 10 | 255 | 14783 | 164.14 | 428 | 419 | 87.5 |
| B | 5 | 172 | 319138 | 3833.26 | 429 | 417 | 83.1 |
| B | 0 | 230 | 41959 | 499.63 | 429 | 417 | 83.1 |
| B | 5 | 255 | 41821 | 497.97 | 429 | 417 | 83.1 |
| C | 15 | 214 | 163296 | 1622.6 | 425 | 427 | 100.4 |
| C | 3 | 233 | 25067 | 245.48 | 425 | 427 | 100.4 |
| C | 9 | 187 | 14465 | 139.86 | 425 | 427 | 100.4 |
| D | 12 | 235 | 7376022 | 100919.8 | 294 | 286 | 73.1 |
| D | 13 | 249 | 84739 | 1155.54 | 294 | 286 | 73.1 |
| D | 12 | 227 | 65921 | 898.06 | 294 | 286 | 73.1 |
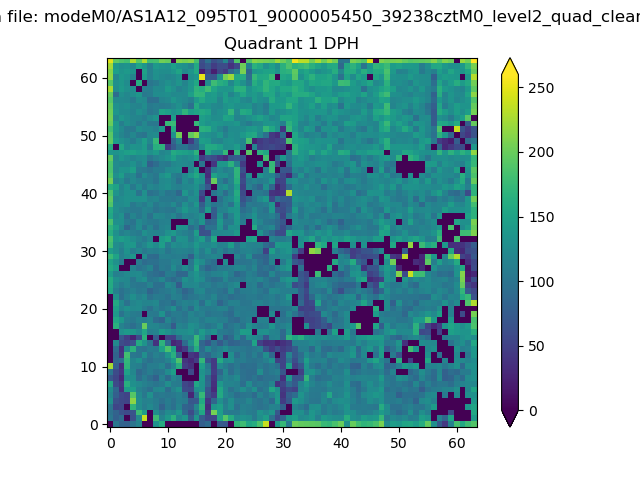
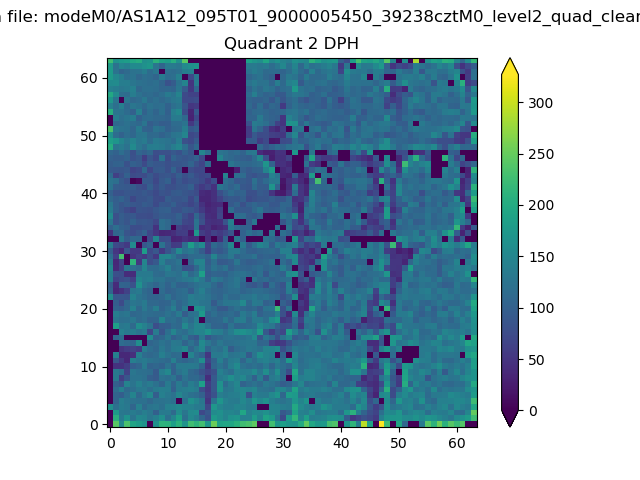
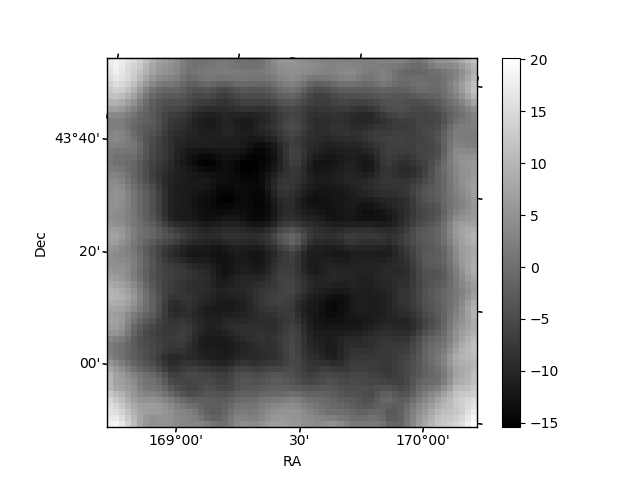
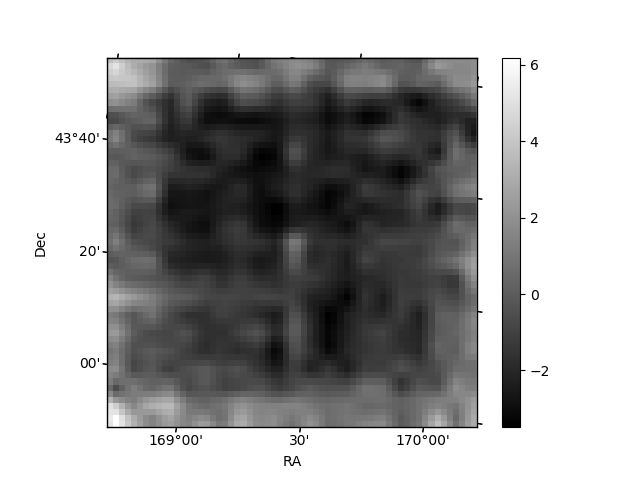
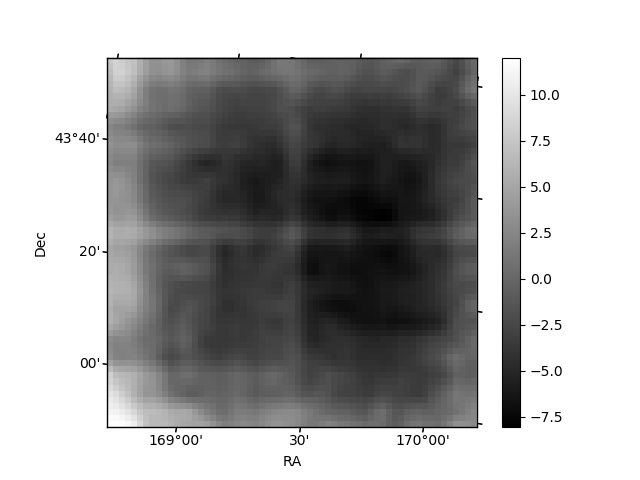
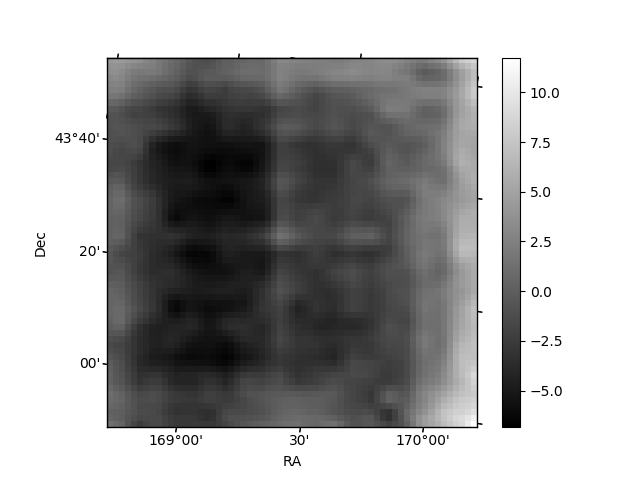
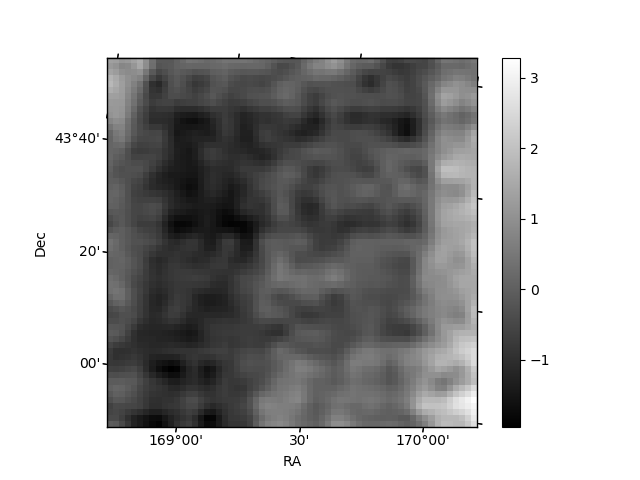
Histogram calculated using DETX and DETY for each event in the final _common_clean file
| Quadrant A | 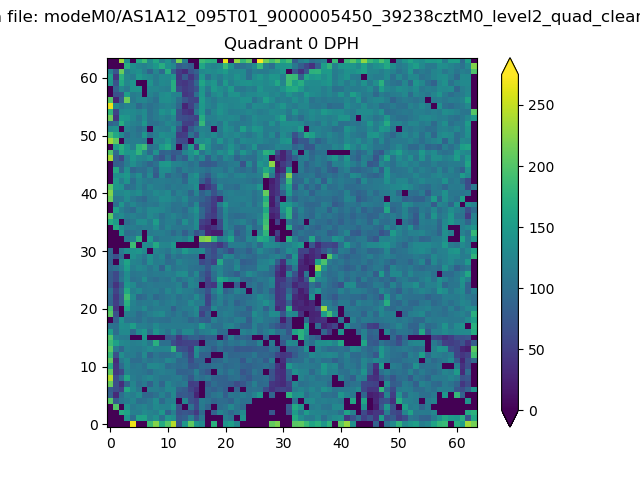 |
 |
Quadrant B |
|---|---|---|---|
| Quadrant D | 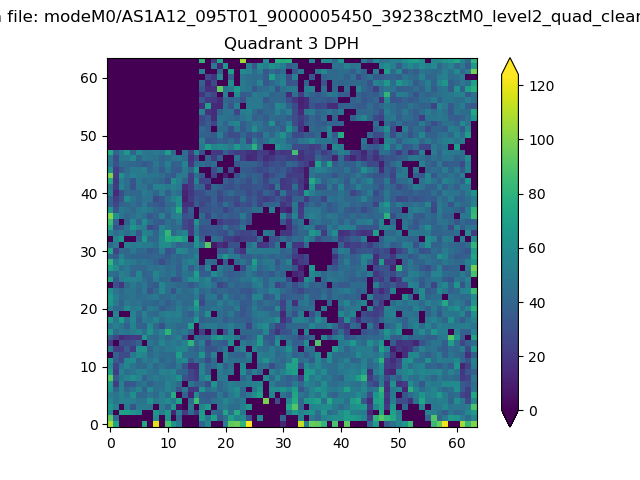 |
 |
Quadrant C |
| Plot type | Count rate plots | Images |
|---|---|---|
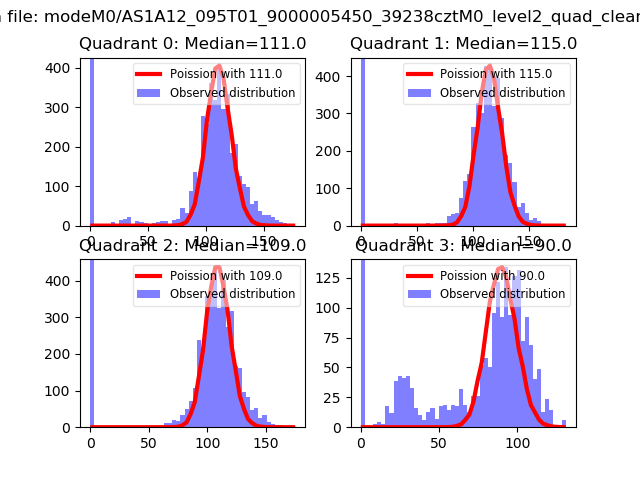
| Comparison with Poisson distribution Blue bars denote a histogram of data divided into 1 sec bins. Red curve is a Poisson curve with rate = median count rate of data. |
 |
 |
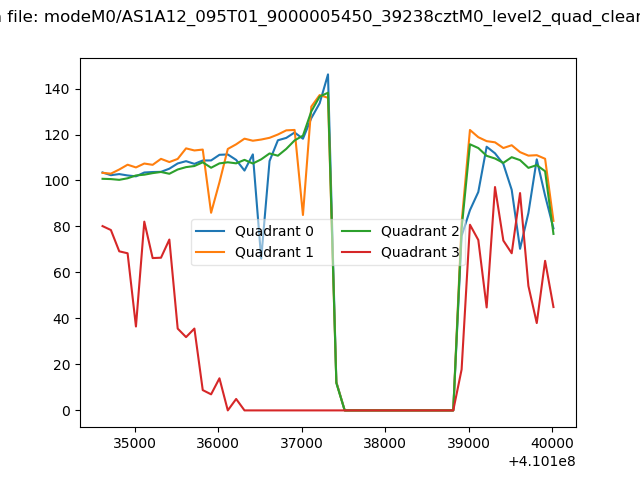
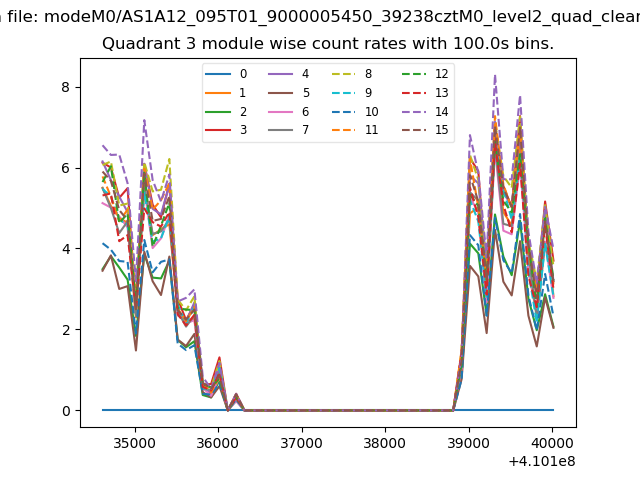
| Quadrant-wise count rates Data is divided into 100 sec bins |
 |
|
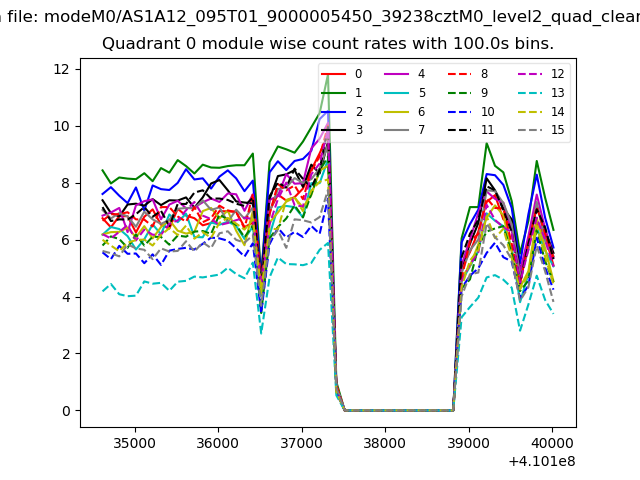
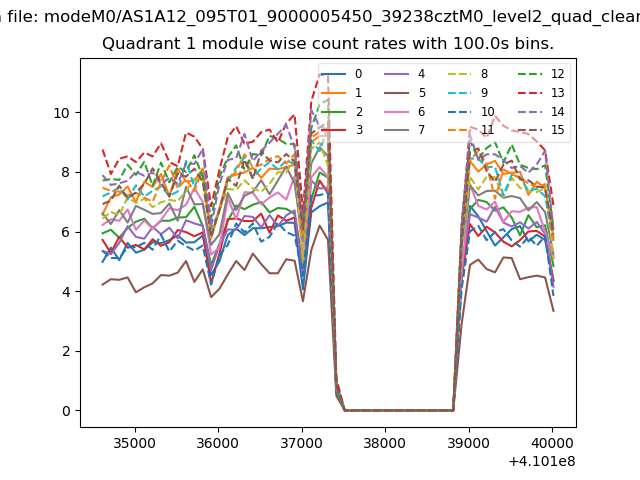
| Module-wise count rates for Quadrant A Data is divided into 100 sec bins |
 |
 |
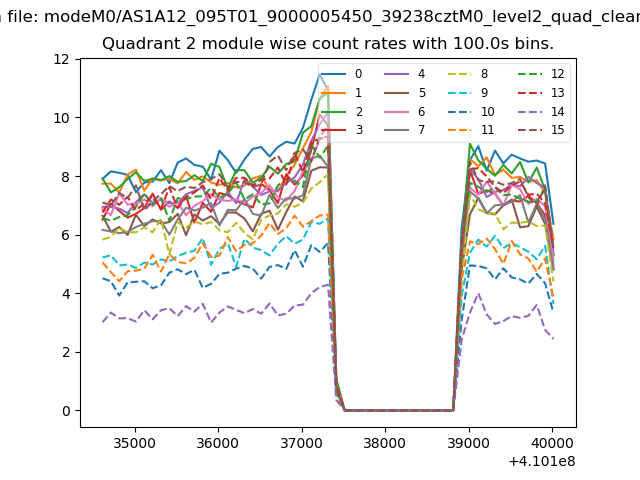
| Module-wise count rates for Quadrant B Data is divided into 100 sec bins |
 |
 |
| Module-wise count rates for Quadrant C Data is divided into 100 sec bins |
 |
 |
| Module-wise count rates for Quadrant D Data is divided into 100 sec bins |
 |
 |
| Parameter | Plot |
|---|---|
| CZT HV Monitor | 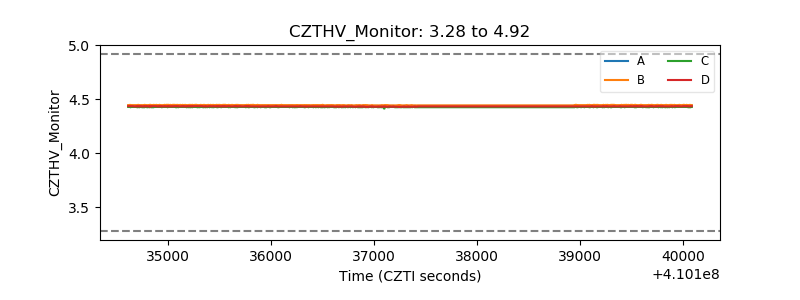 |
| D_VDD | 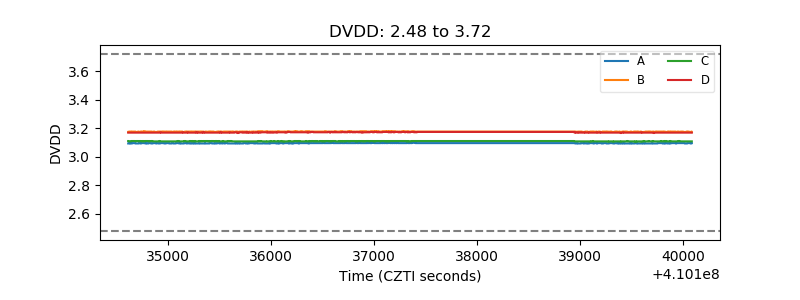 |
| Temperature 1 | 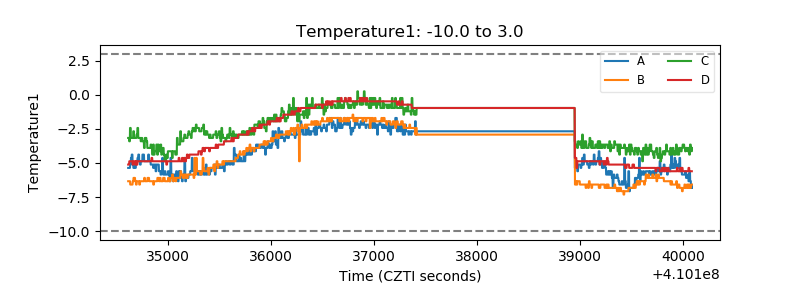 |
| Veto HV Monitor |  |
| Veto LLD | 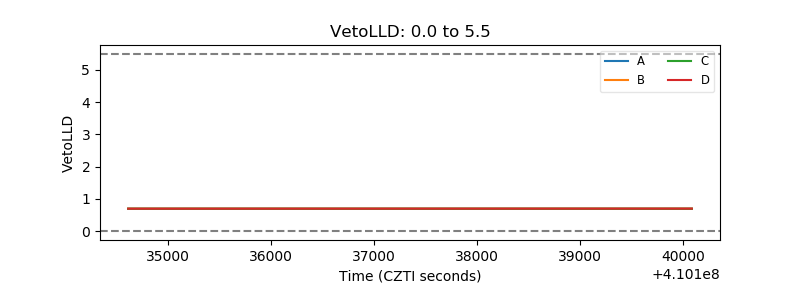 |
| Alpha Counter | 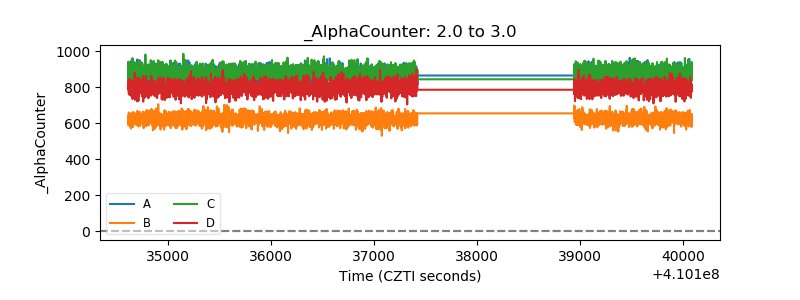 |
| _CPM_Rate | 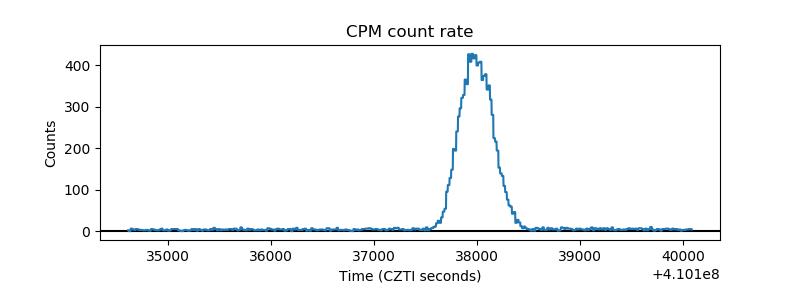 |
| CZT Counter | 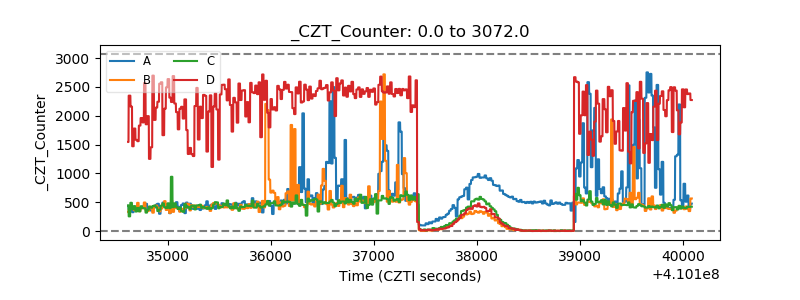 |
| +2.5 Volts monitor | 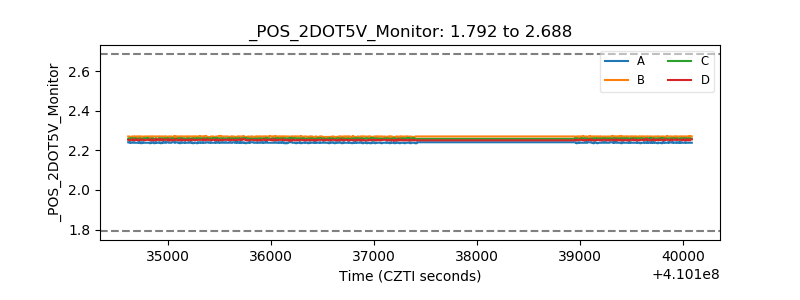 |
| +5 Volts monitor | 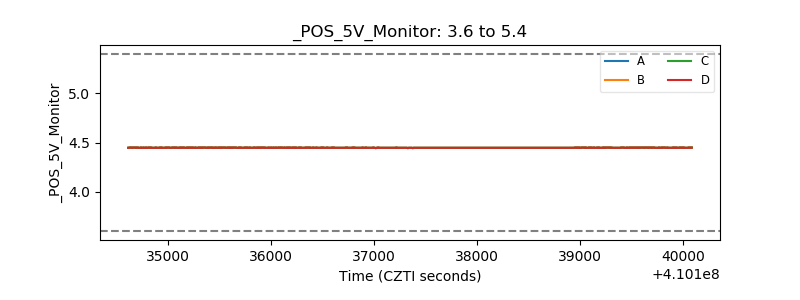 |
| _ROLL_ROT | 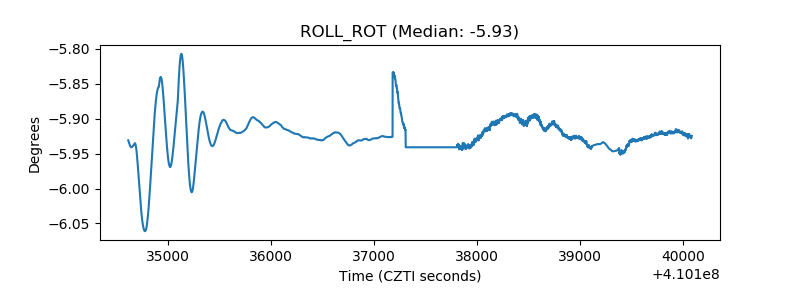 |
| _Roll_DEC | 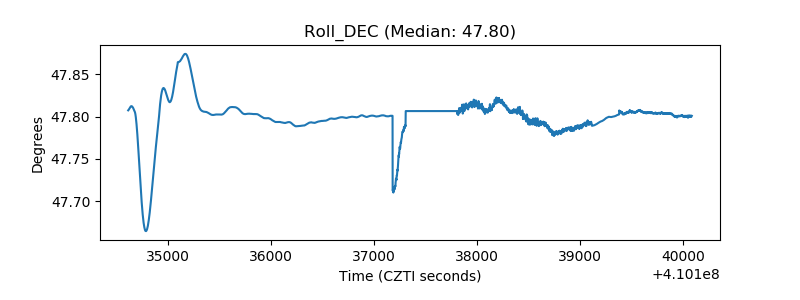 |
| _Roll_RA | 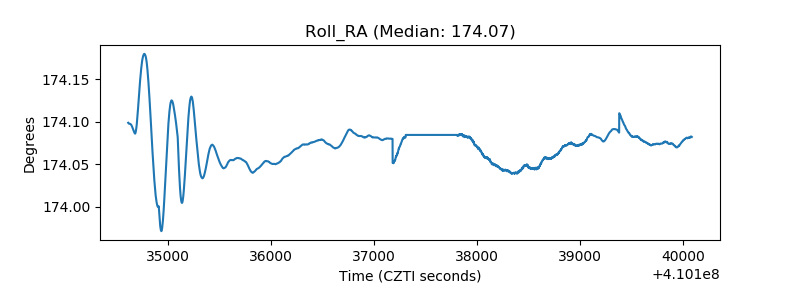 |
| Veto Counter | 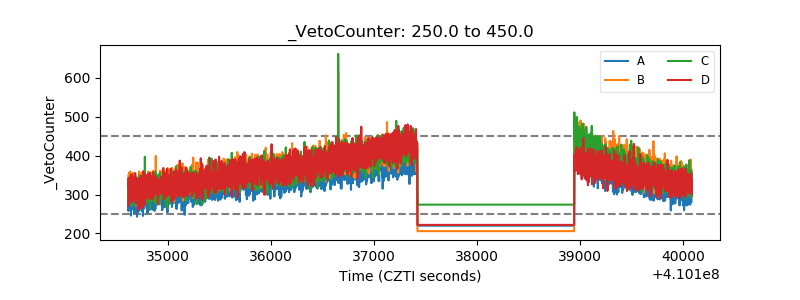 |