| Param | Original file | Final file |
|---|---|---|
| Filename | modeM0/AS1A12_095T01_9000005450_39239cztM0_level2.fits | modeM0/AS1A12_095T01_9000005450_39239cztM0_level2_quad_clean.evt |
| Size (bytes) | 588,772,800 | 83,525,760 |
| Size | 561.5 MB | 79.7 MB |
| Events in quadrant A | 3,663,641 | 613,396 |
| Events in quadrant B | 2,808,473 | 647,115 |
| Events in quadrant C | 2,571,598 | 615,154 |
| Events in quadrant D | 12,310,570 | 257,386 |
| Mode M9 | |||
|---|---|---|---|
| Quadrant | BADHDUFLAG | Total packets | Discarded packets |
| A | 0 | 28 | 0 |
| B | 0 | 28 | 0 |
| C | 0 | 28 | 0 |
| D | 0 | 29 | 0 |
| Mode M0 | |||
|---|---|---|---|
| Quadrant | BADHDUFLAG | Total packets | Discarded packets |
| A | 0 | 14556 | 3 |
| B | 0 | 12397 | 2 |
| C | 0 | 11461 | 2 |
| D | 0 | 40407 | 2 |
| Mode SS | |||
|---|---|---|---|
| Quadrant | BADHDUFLAG | Total packets | Discarded packets |
| A | 0 | 114 | 0 |
| B | 0 | 114 | 0 |
| C | 0 | 114 | 0 |
| D | 0 | 114 | 0 |
| Quadrant | Total seconds | Saturated seconds | Saturation percentage |
|---|---|---|---|
| A | 5664 | 254 | 4.484463% |
| B | 5664 | 63 | 1.112288% |
| C | 5664 | 5 | 0.088277% |
| D | 5664 | 3474 | 61.334746% |
Noise dominated data is calculated using 1-second bins in cleaned event files. If a bin has >2000 counts, and if more than 50% of those come from <1% of pixels, then it is considered to be noise-dominated and hence unusable.
| Quadrant | # 1 sec bins | Bins with >0 counts | Bins with >2000 counts | High rate bins dominated by noise | Noise dominated (total time) | Noise dominated (detector-on time) | Marked lightcurve |
|---|---|---|---|---|---|---|---|
| A | 7307 | 5665 | 197 | 197 | 2.70% | 3.48% | 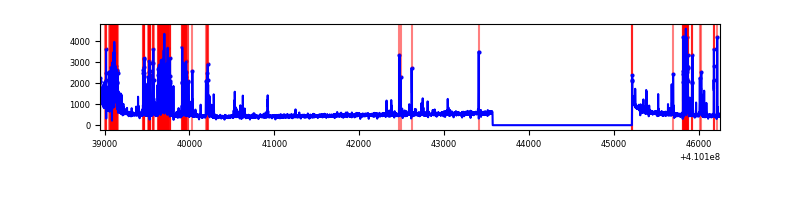 |
| B | 7307 | 5665 | 27 | 27 | 0.37% | 0.48% | 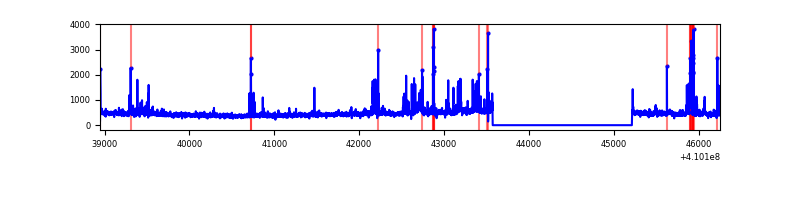 |
| C | 7307 | 5665 | 0 | 0 | 0.00% | 0.00% | 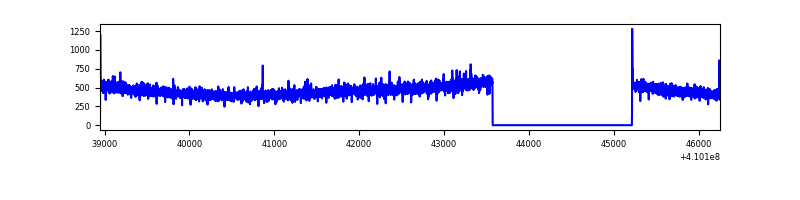 |
| D | 7307 | 5665 | 3623 | 3623 | 49.58% | 63.95% | 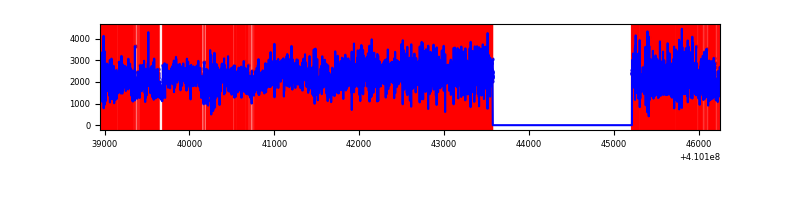 |
Top three noisy pixels from each quadrant. If the there are fewer than three noisy pixels in the level2.evt file, extra rows are filled as -1
| Pixel properties | Quadrant properties | ||||||
|---|---|---|---|---|---|---|---|
| Quadrant | DetID | PixID | Counts | Sigma | Mean | Median | Sigma |
| A | 13 | 248 | 888602 | 7221.93 | 603 | 592 | 123.0 |
| A | 10 | 83 | 430961 | 3500.07 | 603 | 592 | 123.0 |
| A | 10 | 255 | 11191 | 86.2 | 603 | 592 | 123.0 |
| B | 5 | 172 | 227381 | 1934.38 | 608 | 591 | 117.2 |
| B | 5 | 255 | 112712 | 956.32 | 608 | 591 | 117.2 |
| B | 0 | 190 | 32414 | 271.43 | 608 | 591 | 117.2 |
| C | 15 | 214 | 236427 | 1704.1 | 594 | 597 | 138.4 |
| C | 3 | 233 | 8495 | 57.07 | 594 | 597 | 138.4 |
| C | 0 | 10 | 5921 | 38.47 | 594 | 597 | 138.4 |
| D | 12 | 235 | 10344719 | 95396.5 | 439 | 427 | 108.4 |
| D | 12 | 233 | 56456 | 516.71 | 439 | 427 | 108.4 |
| D | 12 | 227 | 53534 | 489.76 | 439 | 427 | 108.4 |
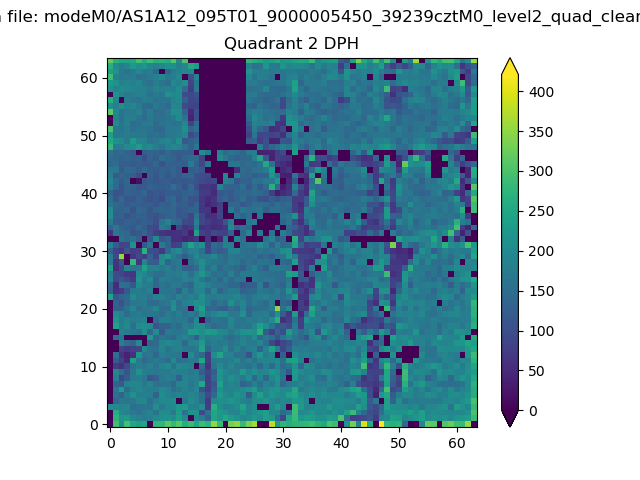
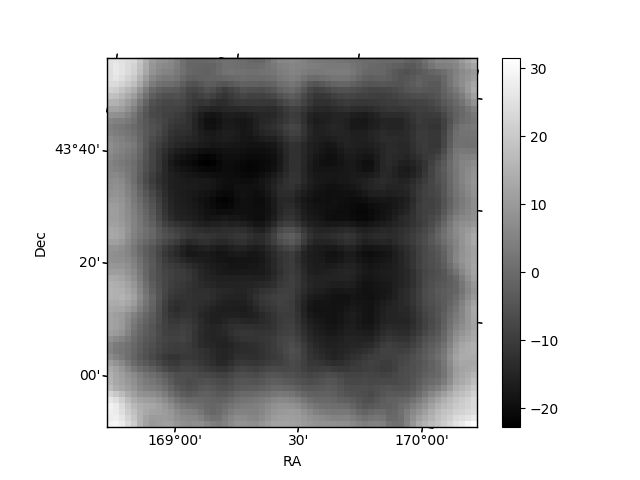
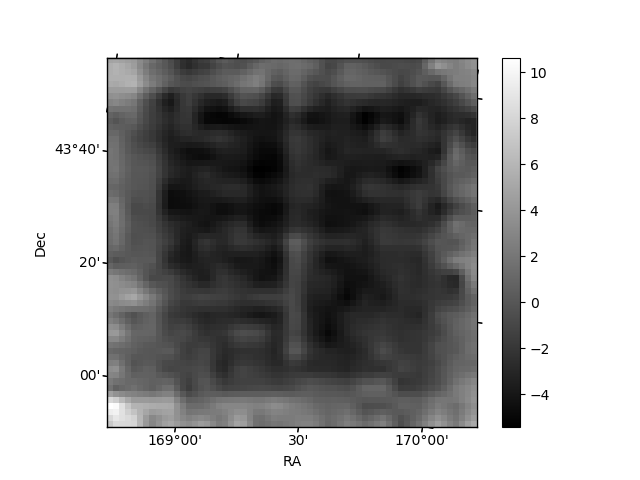
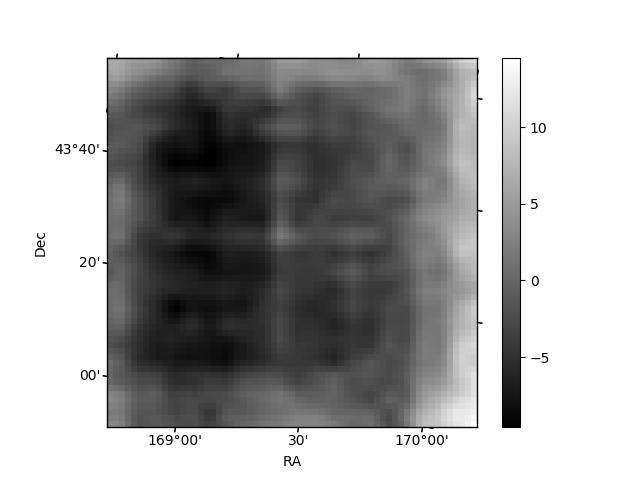
Histogram calculated using DETX and DETY for each event in the final _common_clean file
| Quadrant A | 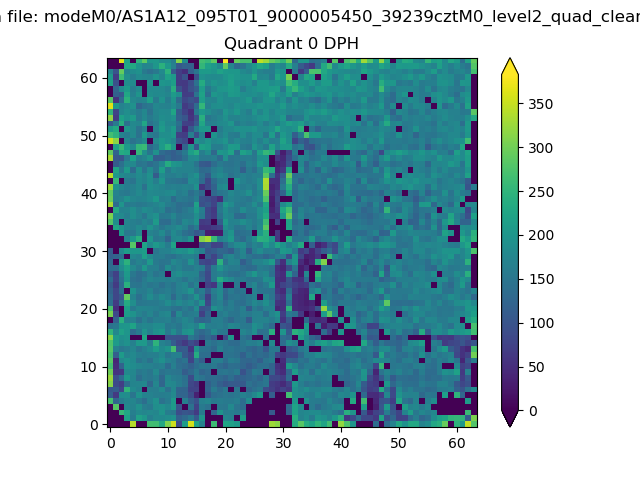 |
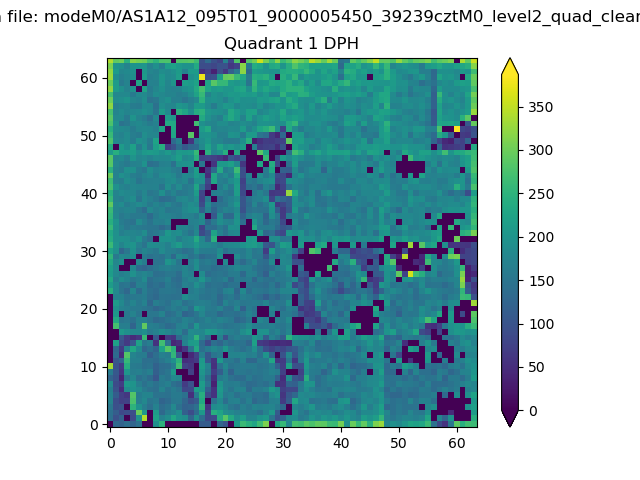 |
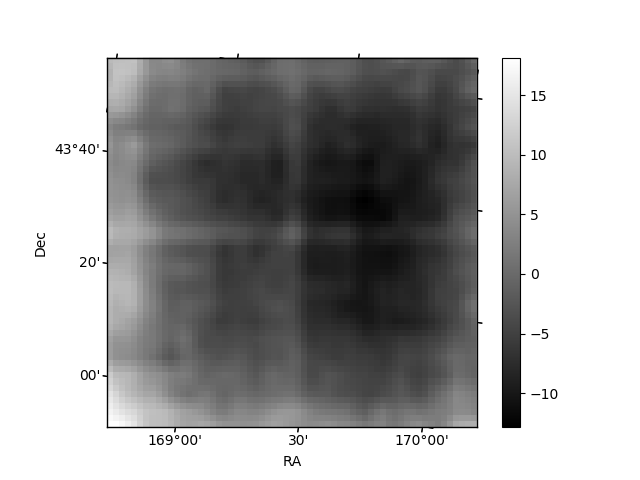
Quadrant B |
|---|---|---|---|
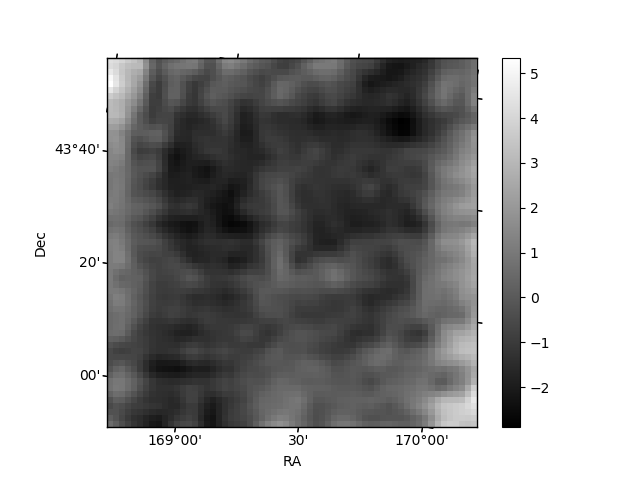
| Quadrant D | 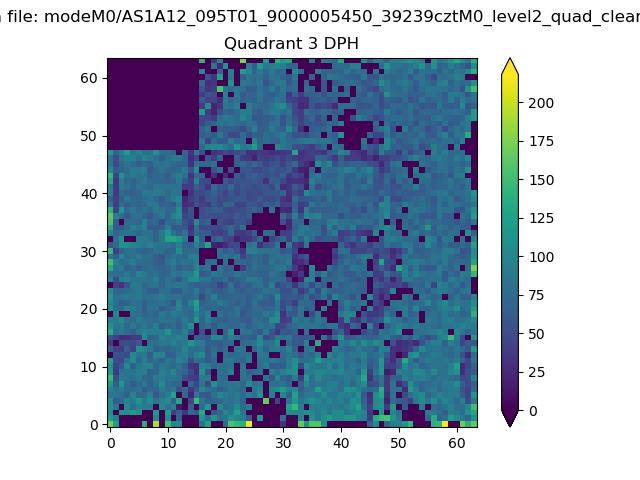 |
 |
Quadrant C |
| Plot type | Count rate plots | Images |
|---|---|---|
| Comparison with Poisson distribution Blue bars denote a histogram of data divided into 1 sec bins. Red curve is a Poisson curve with rate = median count rate of data. |
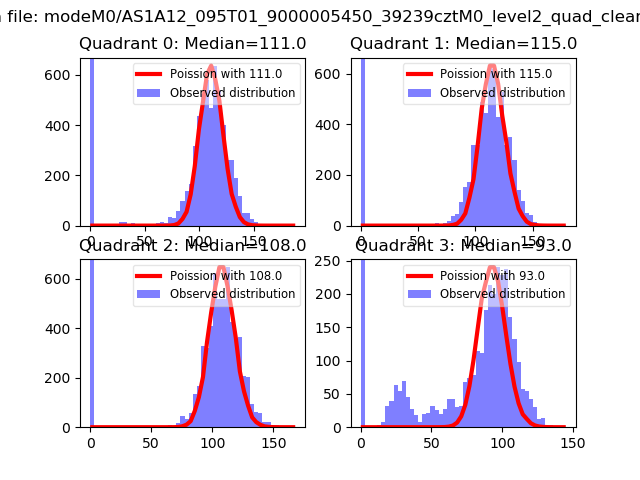 |
 |
| Quadrant-wise count rates Data is divided into 100 sec bins |
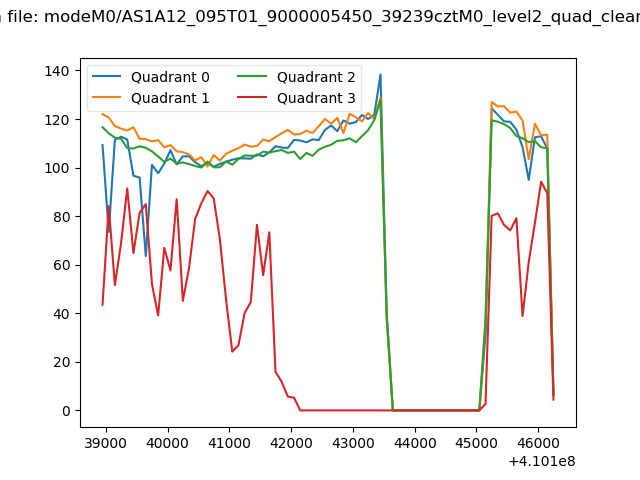 |
|
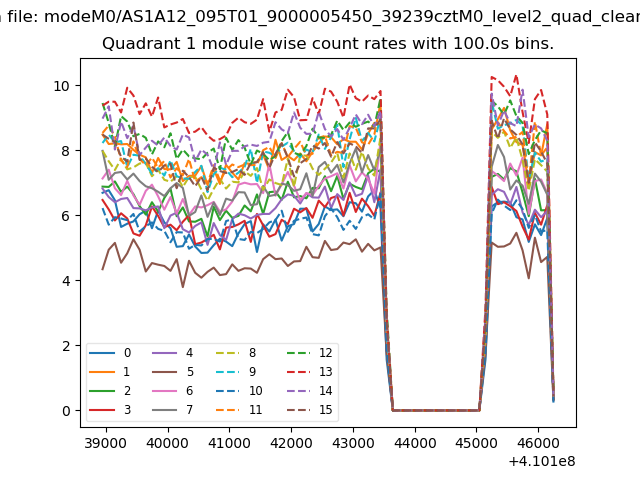
| Module-wise count rates for Quadrant A Data is divided into 100 sec bins |
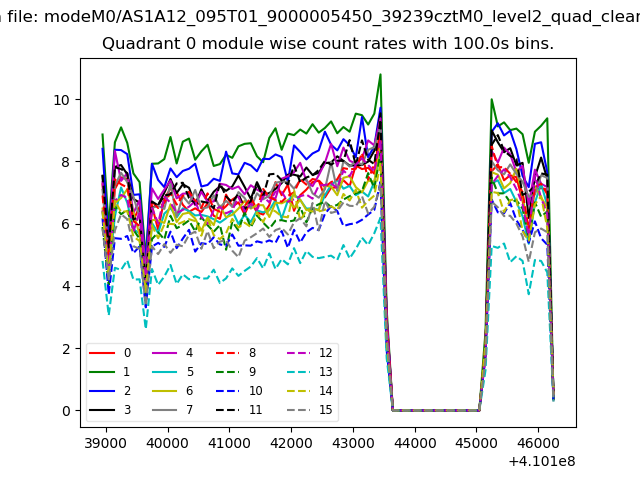 |
 |
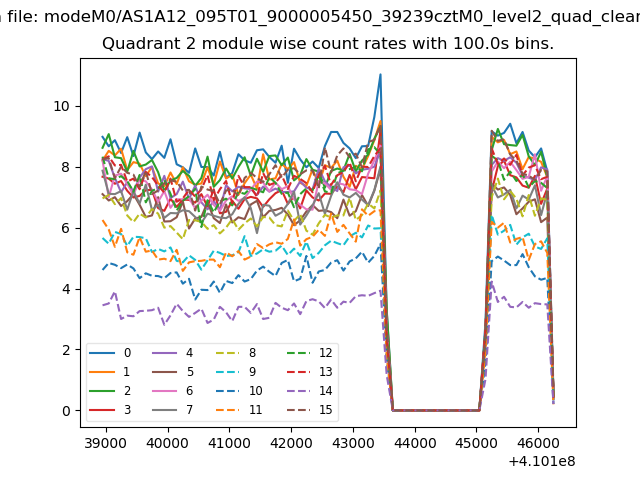
| Module-wise count rates for Quadrant B Data is divided into 100 sec bins |
 |
 |
| Module-wise count rates for Quadrant C Data is divided into 100 sec bins |
 |
 |
| Module-wise count rates for Quadrant D Data is divided into 100 sec bins |
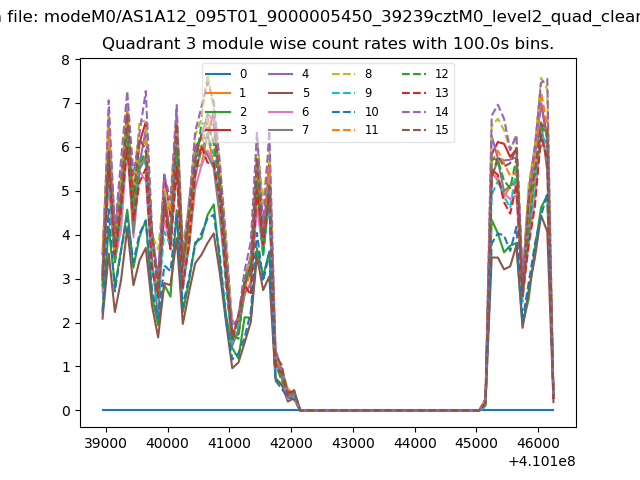 |
 |
| Parameter | Plot |
|---|---|
| CZT HV Monitor | 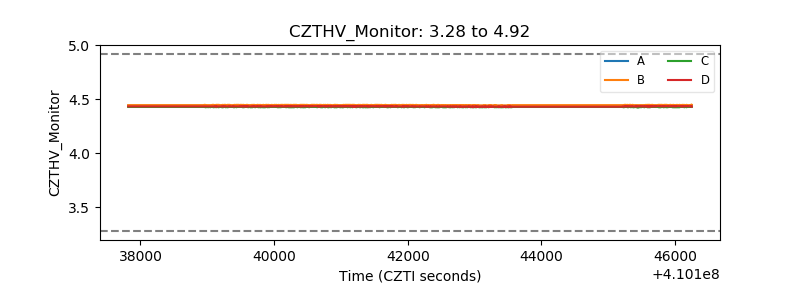 |
| D_VDD | 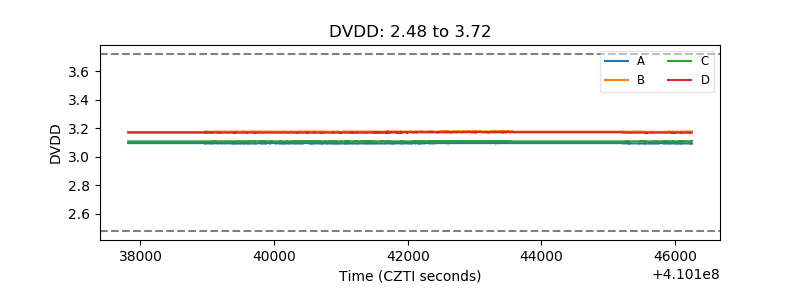 |
| Temperature 1 | 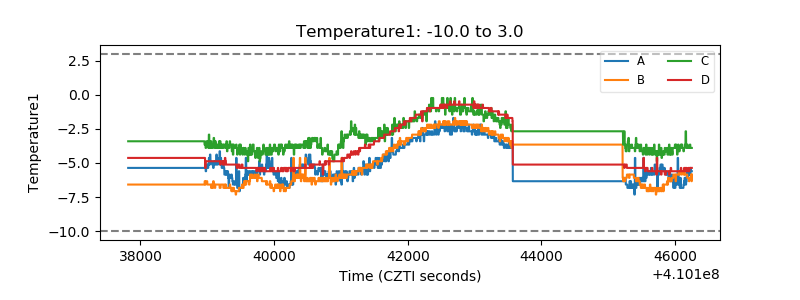 |
| Veto HV Monitor | 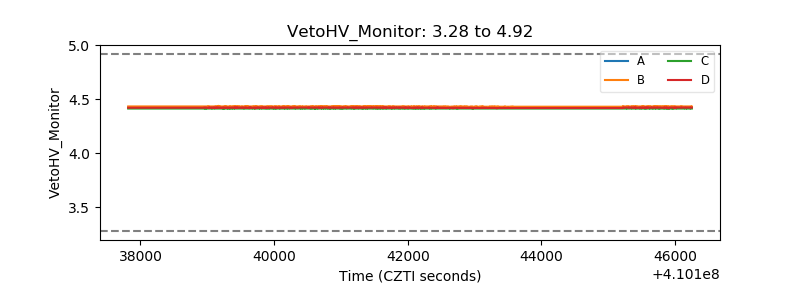 |
| Veto LLD |  |
| Alpha Counter | 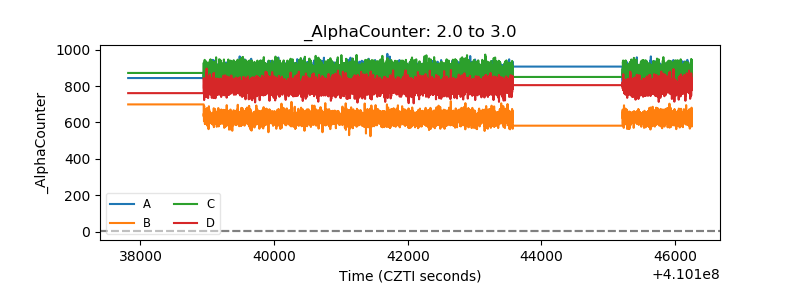 |
| _CPM_Rate | 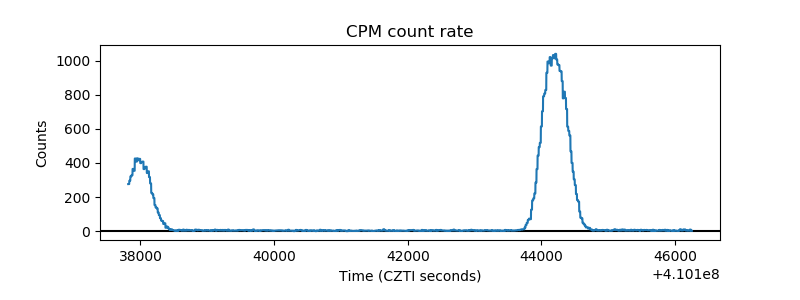 |
| CZT Counter | 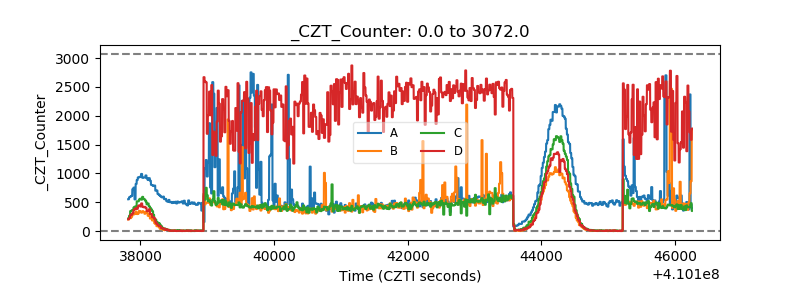 |
| +2.5 Volts monitor | 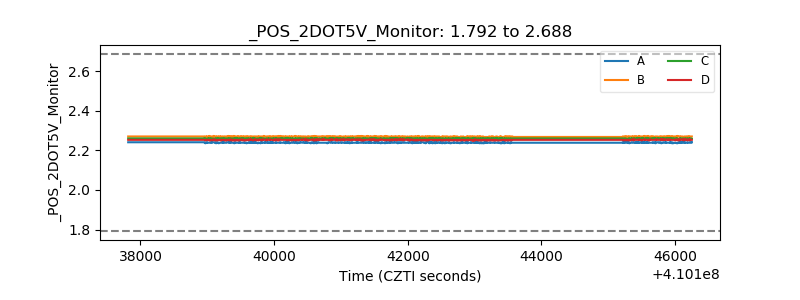 |
| +5 Volts monitor |  |
| _ROLL_ROT | 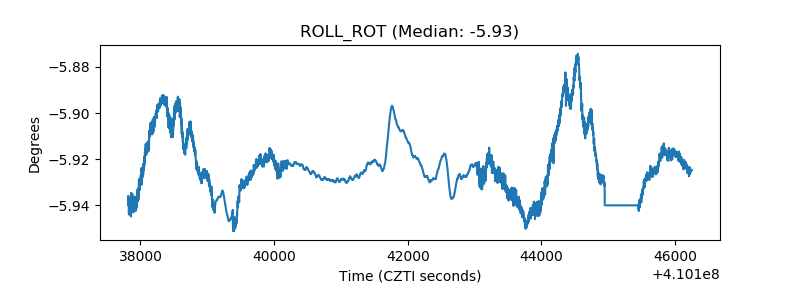 |
| _Roll_DEC | 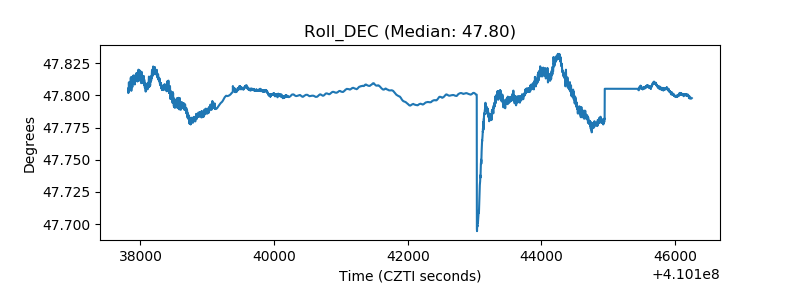 |
| _Roll_RA | 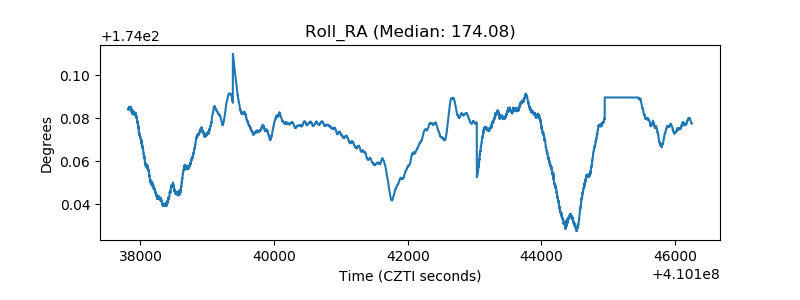 |
| Veto Counter | 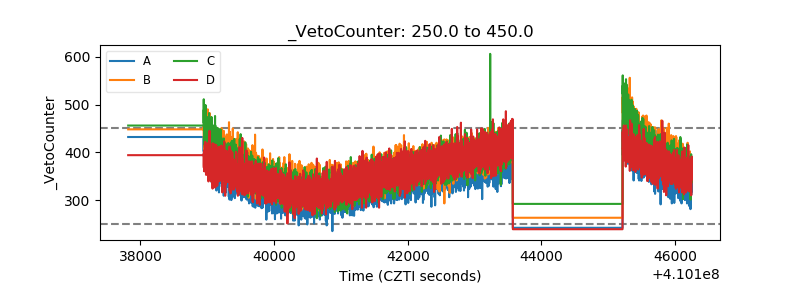 |